Abstract
The normal intestinal epithelium is continuously regenerated at a rapid rate from actively cycling Lgr5-expressing intestinal stem cells (ISCs) that reside at the crypt base. Recent mathematical modeling based on several lineage-tracing studies in mice shows that the symmetric cell division-dominant neutral drift model fits well with the observed in vivo growth of ISC clones and suggests that symmetric divisions are central to ISC homeostasis. However, other studies suggest a critical role for asymmetric cell division in the maintenance of ISC homeostasis in vivo. Here, we show that the stochastic branching and Moran process models with both a symmetric and asymmetric division mode not only simulate the stochastic growth of the ISC clone in silico but also closely fit the in vivo stem cell dynamics observed in lineage-tracing studies. In addition, the proposed model with highest probability for asymmetric division is more consistent with in vivo observations reported here and by others. Our in vivo studies of mitotic spindle orientations and lineage-traced progeny pairs indicate that asymmetric cell division is a dominant mode used by ISCs under normal homeostasis. Therefore, we propose the asymmetric cell division-dominant neutral drift model for normal ISC homeostasis.
NEW & NOTEWORTHY The prevailing mathematical model suggests that intestinal stem cells (ISCs) divide symmetrically. The present study provides evidence that asymmetric cell division is the major contributor to ISC maintenance and thus proposes an asymmetric cell division-dominant neutral drift model. Consistent with this model, in vivo studies of mitotic spindle orientation and lineage-traced progeny pairs indicate that asymmetric cell division is the dominant mode used by ISCs under normal homeostasis.
Keywords: asymmetric cell division, branching process, intestine, Lgr5, lineage tracing, Moran process, neutral drift, random walk, simulation, spindle orientation, stem cell, stochastic, symmetric cell division
INTRODUCTION
Adult stem cells possess the ability to both self-renew as well as generate differentiated progenitor cells using three different cell division modes: symmetric division to generate two stem cells (ss), symmetric division to generate two differentiated progenitors (dd), and asymmetric division to generate one stem cell and one differentiated progenitor (sd) (33). Asymmetric division is a fundamental and evolutionally conserved mode for both self-renewal and generation of progenitors in many aspects of stem cell biology (25, 33, 34). However, asymmetric division has limited flexibility for the rapid expansion of either stem cells or progenitors. For this reason, the more efficient symmetric mode predominates during development and regeneration after injury (25, 33, 34). As most adult stem cells can divide by either asymmetric or symmetric modes, the mode selection is regulated by intrinsic and extrinsic signals necessary to maintain optimal numbers of stem and differentiated daughter cells (33). The proper regulation of stem cell asymmetric vs. symmetric division is essential for tissue homeostasis. In fact, alterations of the mode selection have been implicated in various diseases including human malignancies (1, 10, 21, 26, 30).
The intestinal mucosa is one of the most rapidly renewing tissues in the human body. This homeostatic burden is borne by actively cycling Lgr5-expressing intestinal stem cells (ISCs) (3). The Lgr5+ ISCs reside between Paneth cells at the base of the cylindrically shape crypts and actively divide to both self-renew and give rise to progenitors that further differentiate to specific cell types (3). The progenitor cells migrate up toward the villi while they continue to differentiate with the exception of Paneth cells and a subset of enteroendocrine cells that migrate downward and reside at the crypt bottom (44). This unique spatial and temporal organization of intestinal crypts provides a rich source for studying adult ISC biology.
In the past, most knowledge regarding the nature and behavior of ISCs relied on the use of tritiated thymidine labeling and subsequent mutagen-induced clonogenic assays (6, 9, 27, 36). More recently, the development of inducible genetic labeling of ISCs in mice using the Cre-LoxP recombination system along with the discovery of specific ISC genes (3, 40) has allowed spatiotemporal tracing of ISC-derived clones to become more precise. By virtue of these lineage-tracing technologies, there have been major advances in our understanding of the spatiotemporal dynamics of ISC clones during homeostasis in the murine intestine (28, 45). Recent studies using mathematical modeling of ISC growth dynamics allowed investigators to conclude that the symmetric cell division-dominant (SCD-d) neutral drift model most closely described the observed in vivo behavior of ISC clones (28, 45). According to this model, ISC clones expand or contract within a stem cell pool by neutral competition between symmetrically dividing ISCs at the clonal edge (28, 45). Thus this model implies that ISC division rarely occurs asymmetrically in the normal intestinal epithelium. This is surprising since asymmetric cell division is commonly observed in adult stem cells within many organs (25). Furthermore, asymmetric division of ISCs has been reported in Drosophila, mouse, and human (7, 17, 22, 37, 39, 46). In fact, a majority of ISC divisions in these studies were asymmetric, ranging from 50 to 99%, and indicate that the asymmetric division mode plays a major role in the maintenance of the intestinal epithelium (7, 17, 22, 37, 46). Therefore, we aimed to determine whether experimentally observed lineage-tracing studies of ISC dynamics (28, 45) could be described by a neutral drift model that includes an asymmetric cell division mode. In the current study, we show that the stochastic branching process model and Moran process model including both symmetric and asymmetric division modes explain the experimentally observed ISC dynamics (28, 45). However, the model predicts that the optimal probability for the asymmetric cell division mode (sd) is higher than the symmetric division mode. Finally, the insight from our model is more consistent with the in vivo observations reported by others (22, 37, 46) and our current analysis of mitotic spindle orientations and lineage-traced progeny pairs.
MODELS AND METHODS
Basic principles of previously proposed SCD-d neutral drift model of ISC dynamics.
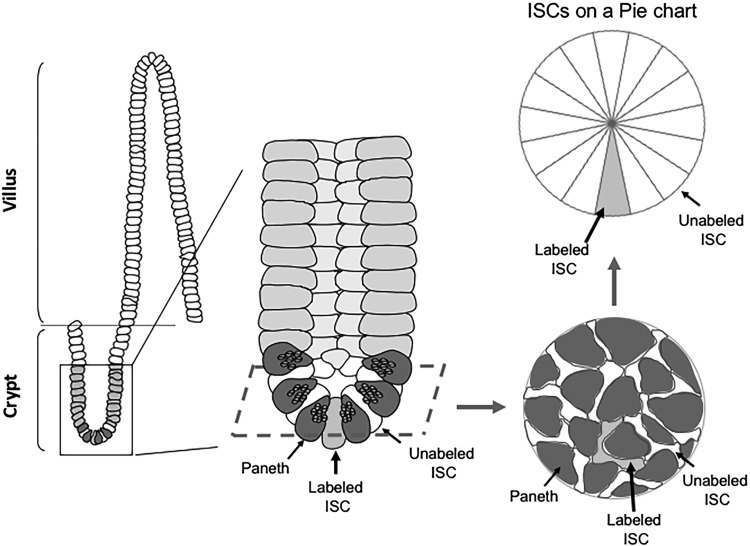
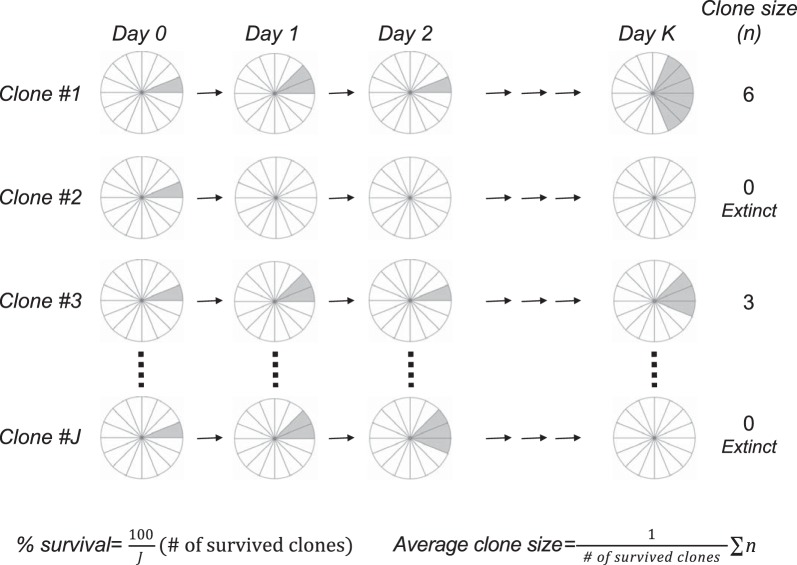
The current model for the stem cell population in the mouse small intestine suggests that ~16 ISCs are located between the Paneth cells at the bottom of the cylindrical shaped crypt (15, 41, 45) (Fig. 1). The ISCs divide at the rate of approximately one cell cycle per day (43), which allows for maintenance of their own numbers as well as producing daughter progenitors. Quantitative analysis of lineage-tracing study data for ISC growth dynamics has been made available (28, 45). In those studies, ISCs are genetically labeled by a tamoxifen (TAM)-inducible Cre/Loxp system, which allowed the observation of trace-labeled ISCs in each crypt based stem cell compartment (Fig. 1). The acquired average number of labeled ISCs per surviving clone (or average clone size per crypt) was quantified over time following the initiation of labeling by a single TAM administration (Fig. 2). These observed lineage traces were mathematically modeled and the SCD-d neutral drift model fits the observed in vivo growth of ISC clones (28, 45). In the SCD-d neutral drift model, labeled clones in the stem cell compartment expand or contract with equal probability (Pr) and follow stochastic behavior in a cell-extrinsic self-renewal manner (contact process) consistent with a pattern of neutral drift dynamics. According to Lopez-Garcia et al. (28), this process is described by
where S(l) and S(u) denote the labeled and unlabeled stem cells, respectively, and λ denotes the average rate of stem cell replacement (λ ≈ 1/day). In accordance with this assumption, the fate and growth of the labeled clone (n = 1 at time 0) mimics a simple random walk with absorbing boundaries at n = 0 and n = 16 (47).
Fig. 1.
Acquisition of clonal growth data for intestinal stem cells (ISCs) by lineage tracing. A tamoxifen-inducible Cre/loxp system genetically labels ISCs and allows us to trace-labeled ISCs in each crypt based stem cell compartment. An intestinal crypt (enlarged in the middle) in the crypt-villus model (on the left) and the positions of unlabeled ISCs (white) and a labeled ISC (gray) between the Paneth cells (dark gray) at the bottom of the crypt is illustrated. Investigators acquired a number of images from tissue sections at different time points after tamoxifen administration for later clonal growth analysis (an example of realistic view is illustrated on the right bottom). For conceptual understanding, we use a pie chart to illustrate growth of the ISC clone (right top). The pie represents a single ISC clone as a 1-dimensional circle of ISCs. The average number of total ISCs in a single crypt is 16; therefore, 16 pies are needed to represent each potential ISC clone. Here the initial condition of clonal growth, i.e., 1 labeled ISC and 15 unlabeled ISCs are shown in this pie chart.
Fig. 2.
Acquiring growth data by lineage tracing of intestinal stem cell (ISC) clones. The schematic pie diagram is used to represent ISCs on a 1-dimensional circular lattice. Labeled cells are shown in gray. Some labeled clones go extinct and some survive and grow after the initiation of labeling following a single tamoxifen administration. The number of labeled cells in a clone can be counted under the microscope after harvesting tissues. The average number of labeled ISC cells per clone (i.e., clone size) = total number of labeled ISCs/number of survived clones (clone size > 0). Percent survival = 100 × number of survived clones/total number of clones examined. The growth curve can be obtained by acquiring these data at multiple time points.
Derivation of the reference curve equation for estimation of the experimentally observed ISC dynamics.
In previously published models (28, 45), it was determined theoretically that the average number of stem cells per surviving clone (or average clone size) (Navg) increased over time according to the square root power law but with different scaling coefficients, (i.e., or ), over short-term clonal evolution in the absence of hitting an upper boundary (28, 45). Since both and were reported to be consistent with the growth of ISC clones in (28, 45), we used the mean values between and as the “reference” to guide a branching process model-based simulation to find optimal parameters.
Determination of the optimal survival fraction of labeled clones that follow neutral drift.
Consider a stem cell clone with probability p of gaining one cell and probability q (= 1 − p) of losing one cell at each independent cell division. Then following the gambler’s ruin problem in probability theory (24), the probability that the clone can reach N cells from i initial cells is
According to the reference model (28, 45), the initial number of cells is 1 (i = 1). The maximum number of stem cells in a crypt is 16 (N = 16). In a neutral drift model, the probability of gain and loss of a cell = 0.5. Therefore, the probability of a clone to reach the maximum of 16 cells is 1/16 (6.25%).
Branching process model with a symmetric/asymmetric cell division.
Computational simulations were designed to study in silico growth of ISC clones based on the branching process model in which the selection of division modes, ss, dd, and sd, for each ISC is autonomous and random with given probabilities (Fig. 3 and Table 1). The simulation with the following assumptions were programmed in Matlab.
Fig. 3.
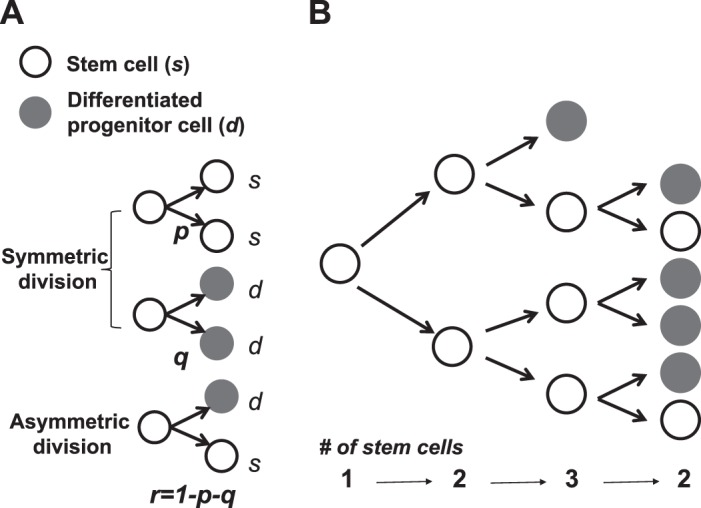
Stochastic branching process with symmetric/asymmetric cell division modes. A: symmetric and asymmetric cell division modes. B: branching process with the realization of 3 generations.
Table1.
Comparison of the models
| Symmetric Cell Division-Dominant Model | Asymmetric Cell Division-Dominant Model |
||
|---|---|---|---|
| Basis of the simulation | Random walk | Branching process | Moran process |
| Total no. of ISCs | 16 | 16 | 16 |
| Initial condition Nave (t = 0) | 1 | 1 | 1 |
| Average rate of cell turnover | 1/day | 1/day | 1/day |
| Optimal probabilities | |||
| p; s→ss (symmetric) | 0.5 | 0.15 | 0.15 |
| q; s→dd (symmetric) | 0.5 | 0.15 | 0.15 |
| r; s→sd (asymmetric) | 0 | 0.7 | 0.7 |
| %Clone survival | 6.25 | 6.27 | 6.45 |
| Potency of each ISC | Equipotent | Equipotent | ≈Equipotent |
| Fitness to equation* | |||
| Peak posterior Pr(θ|D) | 0.315 | 0.476 | 0.1052 |
| θmax** | 2.01 | 1.99 | 2.93 |
| BIC | 2.9946 | 2.6360 | 11.8617 |
| ΔBIC*** | 0 (itself) | 0.3586 | 8.8671 |
| BIC ratio*** | 1 (itself) | 0.8803 | 3.9610 |
ISCs, intestinal stem cells; BIC, Bayesian Information Criterion; ss, 2 stem cells; dd, 2 differentiated progenitor cells; sd, 1 stem cell and 1 differentiated progenitor cell.
Fitness for each model was analyzed by Markov Chain Monte Carlo method using optimal probabilities.
θ = 1 and θ = π fit to experimental growth of ISC clones in vivo; θ of the reference curve is 2.07.
Compared with the BIC value from a random walk simulation.
ISCs divide to self-renew or to produce progenitors using three different modes: symmetric division to generate two stem cells (ss), symmetric division to generate two differentiated progenitors (dd), and asymmetric division to generate one stem cell and one differentiated progenitor (sd).
The average rate of ISC turnover is ~24 h according to the reported estimates (43).
The initial number of labeled ISC clones is set to one per crypt (28, 45). Each ISC derived from a single clone undergoes one cell division per day (assumption 2) and is subject to random selection of division modes ss, dd, or sd according to the assigned probability for each mode.
The probabilities for a stochastic selection of division mode ss, dd, and sd are p, q, and r, respectively, where p + q + r = 1.
For simplicity, the loss of ISC clones by apoptosis was omitted.
The total number of stem cells in a crypt is 16 according to reported estimates (15, 41, 45).
The simulation computes stochastic paths of each surviving stem cell clone between the lower and upper boundaries and the average number of stem cells per surviving clone (clone size). The lower boundary condition is absorbing at n = 0. The upper boundary condition is absorbing at n = 16, which is the estimated average number of stem cells per crypt (assumption 6). The absorption is based on the reported model suggesting potential overcrowding-induced cell extrusion from the epithelium (13). Alternatively, clones are allowed to temporarily expand up to n = 20 with a reflecting boundary condition to accommodate observed fluctuations in the number of Lgr5-eGFP(+) ISCs (our unpublished observation). However, there was no significant difference in growth curves between the two upper boundary conditions for a short-term observation and thus only the results for n = 16 are presented.
Current ISC theory considers two types of ISCs: actively cycling Lgr5+ ISCs and reserve ISCs. When homeostatic renewal is disturbed by loss or stress of Lgr5+ ISCs such as during inflammation or injury, restoration of the epithelium is mediated by reserve ISCs (48, 50). Recent findings show that a subset of the enteroendocrine cell lineage serves as the reserve ISCs not only in response to injury but also, at least in part, in basal homeostatic renewal as well (18, 51). However, because contribution of the reserve ISC population in homeostatic ISC dynamics is small and difficult to detect following the initiation of labeling by a single TAM administration, it is not included in the simulation.
Simulation of the Moran process model with a symmetric/asymmetric cell division mode.
The Moran process model is a stochastic process used in biology to study evolution such as genetic drift and natural selection in finite population, assuming that the total population size remains constant over time (32). Since the number of ISCs remains approximately constant (16 ISCs per crypt), the Moran process model can be used to study ISC dynamics in the crypt (Table 1). The simulation based on the Moran process model was designed by adapting the formula of Dingli et al. (12). Here, we denote the number of labeled ISC by i; the number of unlabeled ISC is then N − i. Following assumption 6, the total number of ISCs (N) is 16. We also denote the probabilities for a stochastic selection of division mode ss, dd, and sd for labeled ISCs as pl, ql, rl, respectively, where pl + ql + rl = 1. Similarly, the probabilities for each mode for unlabeled ISCs are pu, qu, and ru, respectively, where pu + qu + ru = 1. The relative reproductive fitness of labeled and unlabeled ISCs is set to 1, so they are equipotent and the simulation models neutral drift. The transition probabilities for gain or loss of labeled ISC by 1 are given by
If ql = qu = rl = ru = 0, the process is identical to the classical Moran process (31).
Parameter fitting to a square root of time equation and model evaluation.
We assessed the viability of each model by fitting to the simulation growth curves using a Markov Chain Monte Carlo (MCMC) method and obtaining the maximum likelihood estimate for θ (θmax) (Table 1). The data for the branching process model and the Moran process model were obtained from a 98 day-simulation of 50,000 clones with the probabilities p and q for symmetric divisions (ss and dd) set at 0.15 and with probability r for asymmetric division (sd) set at 0.7. The data for a simple random walk model were obtained from a 98-day simulation of 50,000 clones with absorbing boundaries at n = 0 and n = 16. The θmax was estimated for each model using a MCMC method as previously described (35). The posterior probability distribution for the parameter θ conditional on the data D from simulations was obtained using Bayes theorem, given by Pr(θ|D) ∞ Pr(D|θ)Pr(θ), where the likelihood function was given by , where t is time (day) and σ2 is variance. The θmax was obtained from the posterior probability distribution. For comparison of the models, Bayesian Information Criterion (BIC) values were computed using the peak probability at the θmax for each model.
Animal usage and treatment.
Lgr5-eGFP-IRES-CreERT2 (JAX 008875) and Rosa26R-Confetti (JAX013731) were obtained from the Jackson Laboratory (Bar Harbor, ME). All procedures involving mice followed National Institutes of Health guidelines and were approved by the National Institute of Diabetes and Digestive and Kidney Diseases Animal Care and Use Committee. For lineage-tracing studies, 4- to 5-mo-old mice were given a single dose of TAM (Sigma T5648; 200 μl, 10 mg/ml in corn oil) by oral gavage to induce Cre recombinase.
Crypt preparation and immunohistochemistry.
Crypt-enriched preparations were obtained from the small intestine by incubation in Dulbecco’s phosphate-buffered saline (DPBS) containing 2 mM EDTA for 30 min at 4°C followed by vigorous pipetting and filtering through a 70-μm mesh. The crypt-enriched materials were then fixed in 4% paraformaldehyde in DPBS for 1 h at room temperature and treated with DPBS containing 0.1% Triton X-100 for 30 min. Crypts were incubated in DBPS containing 1% bovine serum albumin for 30 min and immunostained with 1:100 rabbit monoclonal anti-survivin antibody (71G4B7; Cell Signaling Technology, Danvers, MA) at room temperature for 1 h. After three washes with DPBS containing 0.1% Triton X-100, crypts were incubated with Alexa Fluor 647-conjugated goat anti-rabbit IgG secondary antibody (Invitrogen, Carlsbad, CA) and DAPI. After three washes with DPBS containing 0.1% Triton X-100, immunostained crypts were subjected to confocal and bright-field examination with a complete Z-stack using a Zeiss LSM510 Meta confocal microscope (Carl Zeiss).
RESULTS
Simulation studies of cell division mode of ISCs under normal homeostasis.
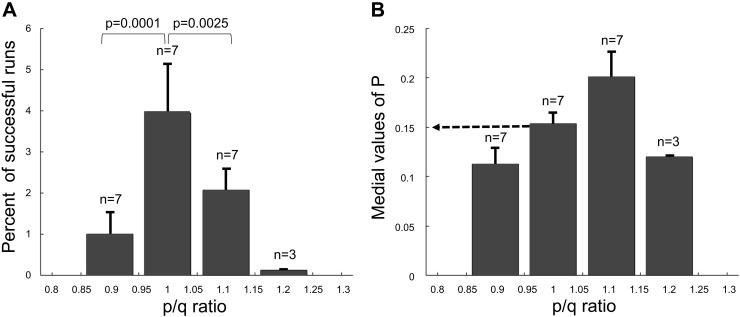
Our aim was to explore whether the stochastic branching process model with a symmetric/asymmetric division mode can explain the experimentally observed ISC dynamics (28, 45). For this purpose, the in silico results were examined for survival fraction of clones and compared with the expected reference curve, which is the mean values between and as defined in models and methods to find probabilities (p, q, and r) that can fit optimally with the clonal dynamics observed in lineage-tracing studies (28, 45). For our initial screening, we performed simulations for 100 ISC clones with a range of p between 0.01 and 0.5 (at an interval 0.01) for a period of 98 days. At each value of p, we performed simulations with different ranges of p/q ratios, 0.85 –0.95, 0.95–1.05, 1.05–1.15, 1.15–1.25, or 1.25–1.35 with r = 1 − p − q, to find which p, q, and r best satisfied the following criteria: 1) average number of ISCs per clone (clone size) is between , at day 21 (a time point during the rapid growth phase) necessary to achieve the optimal growth rate; and 2) the final percent survival of the clones is equal to 6.25 ± 1% to ensure equipotency of each clone. The results from this initial screening indicated that best p, q, and r values that satisfied criteria had p = q = 0.15 and r = 0.7. More precisely, the estimated p/q ratio range of 0.95–1.05 was significantly better than the ranges 0.85 –0.95 (P < 0.0001) and 1.05–1.15 (P < 0.0025) (Fig. 4A) with a median p of 0.15 (Fig. 4B).
Fig. 4.
Screening optimal range of p/q ratios and value of p. A: percent of successful runs produced from branching process simulations with different ranges of p/q ratios. B: median values of p obtained from branching process simulations with different ranges of p/q ratios. The simulations of 100 clones were performed at every combination of value of p and p/q ratio.
We replicated the simulations using 1,000 ISC clones for the range of p/q ratios between 0.95 and 1.05 determined to be most successful in the simulations using 100 ISC clones. Again, we performed simulations for every combination of p and p/q, using intervals of 0.01 for p between 0.01 and 0.5 and p/q intervals between 0.95 and 1.05, respectively (Fig. 5). The dot-plot of the relationship between p and %survival displayed a trend of diminishing survival fraction with increasing p (Fig. 5A). The dot-plot of the relationship between p and simulation/reference ratios, which are the ratios of clonal sizes obtained from the in silico derived curve to the sizes from the reference curve at day 21 after the initiation of labeling, displayed a clear trend of increasing growth rate with increasing p. The p of 0.15 was optimal when the ratio was the closest to 1 (Fig. 5B). These results suggest that the clones tend to go extinct when p increases and that only a small number of clones that grew fast enough by chance in a very early phase of the growth curve are able to survive. From this screening, we analyzed the successful runs based on the criteria described above and obtained a median p of 0.15 and a median p/q ratio of 1.0 for the runs. To confirm the results, we then performed simulations of 50,000 clones for different values of p with a fixed p/q ratio, p/q = 1 (Fig. 6). The comparison of in silico growths from different p showed that simulations with P = 0.15 most closely aligned with the reference curve with a survival of 6.27% that was nearly identical to the expected 6.25% (Fig. 6). Hence, the in silico growth curve derived from the branching process model fits optimally to the reference curve with the probabilities p and q for symmetric divisions (ss and dd) at 0.15 and with probability r for asymmetric division (sd) at 0.7. Under these optimal p, q, and r values, each ISC within a crypt is expected to be equipotent, consistent with random ISC selection and neutral clonal drift. Further, under these optimal p, q, and r values, a simplified square root of time equation model, , fits with the highest likelihood at θmax = 1.99, which was not significantly different from θmax = 2.01 obtained from a simple random walk model (Table 1). The difference in BIC values between the models was an insignificant 0.3586 (Table 1).
Fig. 5.
Optimal values of p for survival and growth rate of labeled clones obtained from the current branching process simulations. A: relationship between value of p and percent survival. B: relationship between value of p and in silico clone size/reference ratio. The mean values between and were used as reference. Although the majority of dots are overlapping, each dot was obtained from simulations of 1,000 clones, which was performed for every combination of value of p and p/q ratio. The dots are spread vertically at each value of p due to different p/q ratios.
Fig. 6.
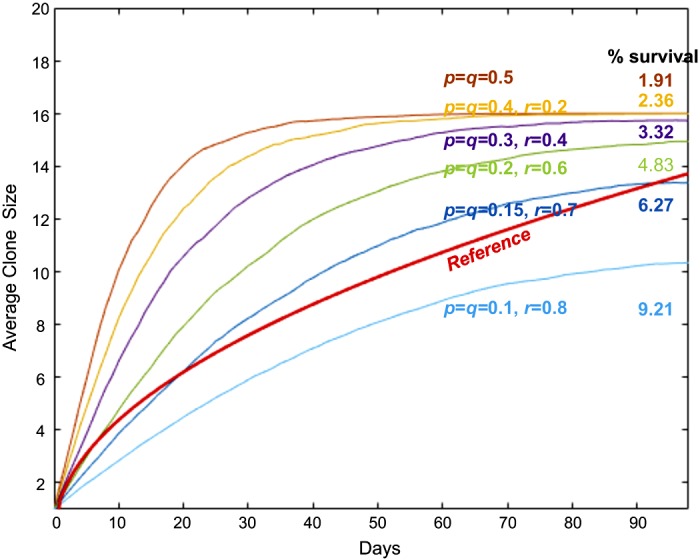
In silico growth of intestinal stem cell (ISC) clones based on branching process model. In silico growth curves with different p, q, and r values. Simulations of 50,000 clones were performed for each curve. The reference curve, the mean values between and is shown by the red solid line.
We obtained a similar conclusion from in silico growth based on the Moran process model, such that the high probability for the asymmetric cell division mode was required to be optimal (Fig. 7). In silico growth with the probabilities p and q at 0.15, and with probability r at 0.7, produced a 6.45% survival that allows for equipotency of each clone. Under these probabilities, the growth curve fits with the highest likelihood at θmax = 2.90 (Table1). The BIC value for the Moran process model showed a strong evidence against a random walk model (delta BIC = 8.8671) (Table 1). This result indicated that a branching process model had a better fit to a random walk model than the Moran process model.
Fig. 7.
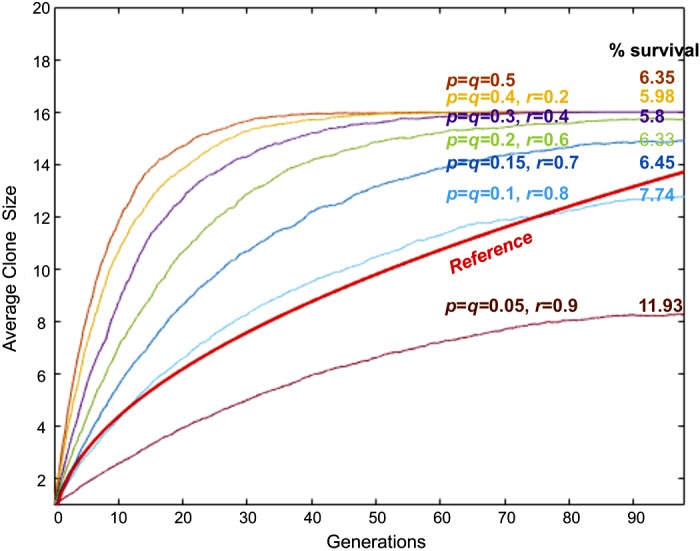
In silico growth of intestinal stem cell clones based on Moran process model. In silico growth curves with different p, q, and r values. Simulations of 50,000 clones were performed for each curve. The generation time, i.e., the time to complete one generation, is set to be one day. The reference curve, the mean values between and is shown by the red solid line.
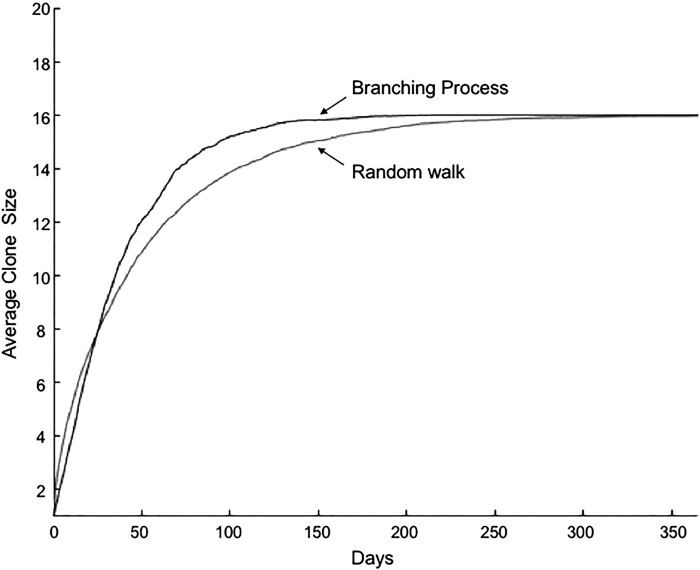
We also examined the branching process model for a long-term lineage tracing. Since the reference curve has no upper boundary and cannot be applied to the growth of over 100 days, we used the average path obtained from a simple random walk simulation with the boundaries between 0 and 16 as a reference curve for a long term. The simulations for 50,000 clones with P = 0.15 and p/q = 1.0 for 365 days closely approximate the reference curve for a long duration (Fig. 8). However, for this long-time period, a p/q ratio ≈1.04 was necessary to maintain the optimal percent survival.
Fig. 8.
Long-term in silico growth of intestinal stem cell clones based on branching process model. In silico growth curves from branching process simulations and from random walk simulations with absorbing boundaries at n = 0 and 16. Simulations of 50,000 clones were performed for each curve.
In vivo cell division mode of ISCs in adult mice.
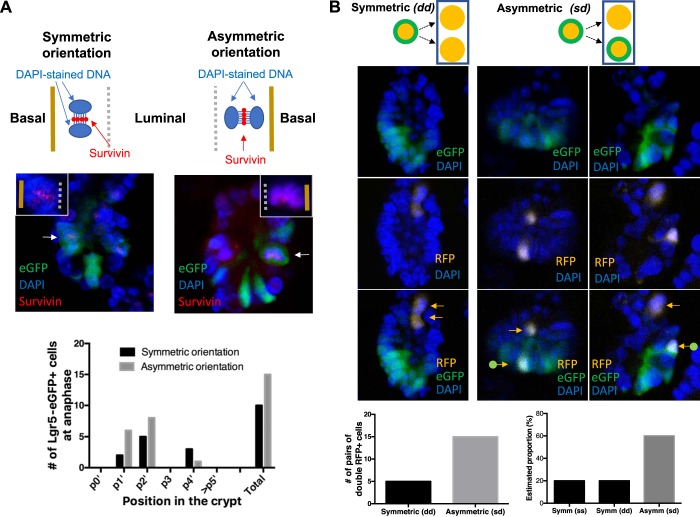
To study the cell division mode of ISCs, crypts from Lgr5-eGFP-CreERT2 mice were immunostained for survivin, stained for DNA with DAPI, and examined for mitotic orientations of dividing Lgr5+ ISCs by confocal microscopy (Fig. 9A). Survivin is known to be essential, expressed in ISCs (29), increased with Ki67 (42) and clustered at the spindle midzone between DAPI-stained DNA during anaphase (49). Therefore, the spindle orientation during mitosis in ISCs can be assessed on the basis of the DAPI-survivin-DAPI axis (Fig. 10A). Using this approach, we examined 100 crypts and identified 25 dividing Lgr5+ ISCs in which the DAPI-survivin-DAPI axis was clearly discernable (Fig. 9A). Among these 25, we observed that the DAPI-survivin-DAPI axis was oriented perpendicular to the basal cell surface (asymmetric orientation) in 15 cell divisions (60%) compared with 10 cell divisions with parallel orientation (symmetric orientation) (40%). All of these Lgr5+ ISC divisions were located at positions 1’, 2’, and 4. These results on mitotic spindle orientations indicate that asymmetric division plays a significant if not dominant role in Lgr5+ ISC dynamics.
Fig. 9.
In vivo evidence for asymmetric cell division mode in Lgr5+ intestinal stem cells (ISCs) in the small intestine under normal homeostasis. A: evaluation of cell division mode by mitotic spindle orientation. A, top: cartoons illustrating relationship between cell division mode and mitotic orientation that can be determined by orientation of survivin cluster and DAPI-stained DNA. Symmetric and asymmetric cell division shows DAPI-survivin-DAPI axis being parallel (left) or perpendicular (right) to the basal surface, respectively. A, middle: representative images of dividing survivin-positive Lgr5+ cells showing symmetric mitotic orientation (left) and asymmetric mitotic orientation (right). Insets: high-power images showing survivin and DAPI-stained DNA of dividing Lgr5+ cells (shown by arrows in the lower power images). Lgr5-eGFP, survivin (Alexa-647), and nucleus (DAPI) appear in green, red, and blue, respectively. A, bottom: the position and cell division mode of Lgr5-eGFP+ ISCs in the small intestine. B: evaluation of cell division mode by lineage tracing using Lgr5-eGFP-CreERT2; Rosa26R-Confetti mice. B, top: cartoons illustrating our interpretation of lineage-traced progeny pairs. Cell division mode assessed when 2 RFP+ (orange) cells (rectangular outline) were present in a single crypt and either both or 1 of the RFP+ cells were Lgr5-eGFP (green)-negative. B, middle left: representative images of a crypt having two Lgr5-eGFP-negative RFP+ cells (orange arrows) suggesting symmetric (dd) cell division. B, middle and middle right: representative images of a crypt having 1 Lgr5-eGFP-negative RFP+ cell (orange arrow) and 1 Lgr5-eGFP-positive RFP+ cell (orange arrow with green origin), suggesting asymmetric cell division. Lgr5-eGFP, RFP and nucleus (DAPI) appear in green, yellow, and blue, respectively. Note that RFP+ DAPI stained cells appear in white. B, bottom left: graph of the observed number of the progeny pairs that suggest symmetric (dd) or asymmetric (sd) cell division. B, bottom right: graph of the estimated proportion (%) of the progeny pairs that suggest symmetric (ss), symmetric (dd) or asymmetric (sd) cell division. Note that confocal images of the crypts in A, middle, and B, middle, were oriented vertically with the crypt base located at the bottom.
Fig. 10.
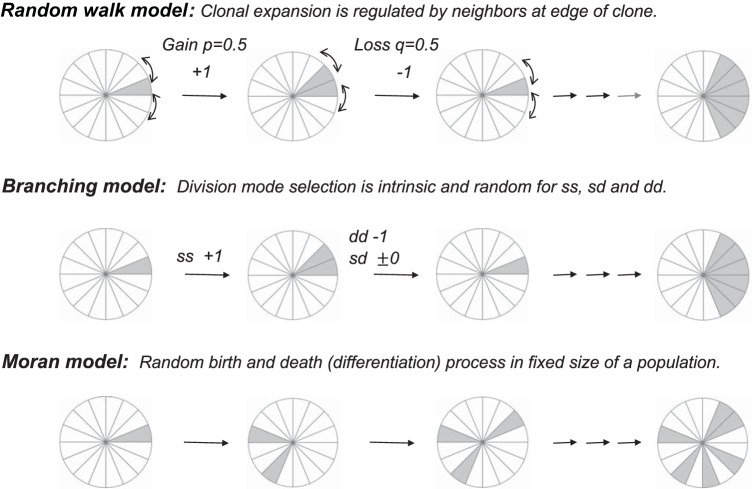
Expected clonal growth patterns in different models. The schematic pi diagram is used to represent intestinal stem cells (ISCs) on a 1-dimensional circular lattice. Labeled cells are shown in gray. Since differentiated precursor cells move upward and migrate out from the stem cell compartment, each clone grows as a cluster in both the population asymmetry-based random walk model and the branching process model. The Moran model considers no geometric association in theory.
We also investigated the cell division mode of ISCs by lineage tracing using Lgr5-eGFP-CreERT2;Rosa26R-Confetti mice. In these animals, eGFP is constitutively expressed in Lgr5-promoter active ISCs while Confetti-fluorescent proteins were induced by TAM administration. During short-term lineage tracing, we examined expression of constitutive Lgr5-eGFP and Cre-induced RFP. Crypts containing RFP+ cells (usually a single RFP+ cell per crypt) were found in 5–7% of the crypts examined 48 h postinduction. It appeared that RFP+ cells were all derived from Lgr5-promoter active cells (i.e., Lgr5-eGFP+ ISCs) because RFP+ cells were always Lgr5-eGFP(+) in crypts containing a single RFP+ cell. However, occasionally Lgr5-eGFP(−)/RFP+ cells were present in crypts with 2 or more RFP+ cells. Assuming that the cell of origin of all the RFP+ cells should be Lgr5-eGFP+ ISCs, crypts with a pair of two RFP+ cells where only one cell was Lgr5-eGFP positive suggested asymmetric division, sd, while crypts with two RFP+ cells where the cells were either both Lgr5-eGFP positive or both negative indicated symmetric division, ss or dd, respectively. On this basis, a pair of two RFP+ cells in a single crypt would be informative regarding the cell division mode. However, because reporter eGFP remain in cytoplasm for a prolonged time (half-life over 24 h) (11), the current state of Lgr5-promoter activity is uncertain for Lgr5-eGFP positive cells and therefore noninformative. For this reason, we excluded pairs of Lgr5-eGFP(+)/RFP+ cells from our analysis to eliminate false ascertainment of symmetric division ss vs. dd. For these reasons, we considered a pair of Lgr5-eGFP(−)/RFP+ cells (dd) and a mixed pair of Lgr5-eGFP(+)/RFP+ and Lgr5-eGFP(−)/RFP+ cells (sd) to be informative regarding the cell division mode. Presumably because these informative pairs required more time to clear eGFP, they were observed less frequently than the noninformative pairs of Lgr5-eGFP(+)/RFP+ cells. After screening more than 7,500 crypts, we found 20 crypts that had an informative pair of two RFP+ cells of which one or both were Lgr5-eGFP negative (Fig. 9B). Among these 20 crypts, 15 crypts had one Lgr5-eGFP(−)/RFP+ and one Lgr5-eGFP(+)/RFP+, suggesting asymmetric cell division (sd). In contrast, five crypts had a pair of Lgr5-eGFP(−)/RFP+ cells suggesting symmetric cell division (dd). Given an observed asymmetric (sd)/symmetric (dd) ratio of 3 and the predicted symmetric (ss)/symmetric (dd) ratio of 1, the calculated proportion of asymmetric cell division (sd) was 60%. This proportion is consistent with the results obtained using the independent method of mitotic spindle orientation and suggests that asymmetric division is a dominant mode for maintenance of Lgr5+ ISCs under normal homeostasis.
DISCUSSION
Bjerknes, in his inspiring paper entitled “A test of the stochastic theory of stem cell differentiation” in 1986 (5), examined the fate of 328 crypts over a period of 3 wk. The author predicted that the probability of crypt extinction was ~40% using a branching process model, which was based on the theory that stem cells divide stochastically by symmetric cell division. His calculations were based on parameters of a 16-h cell cycle and 15 cells per crypt (5). However, his observations of only increasing crypt number without crypt loss was contrary to his prediction. Hence, Bjerknes concluded that the theory needed revision. With advances in stem cell research, we now realize that the model needs to consider an asymmetric cell division mode. In fact, as observed in the results from our current simulations, the increase in the proportion of the asymmetric cell division mode results in an increase in the percent of surviving stem cell clones (i.e., higher fixation or lower extinction) (Fig. 5). Although the characterization of ISC division modes in vivo is rather challenging, there are convincing reports clearly demonstrating asymmetric cell divisions of ISCs in the mouse and human. These studies have documented that >50% of ISCs undergo asymmetric cell division either on the basis of spindle orientation analysis (7, 37) or RNA in situ-based clonal tracing (22). In the present study, we showed that 60% of ISC cell division in mice was asymmetric by examining mitotic spindle orientation and lineage-traced progeny pairs (Fig. 9). Therefore, in vivo observations shown here and by others (7, 22, 37, 46) indicate that the asymmetric division mode plays a major role in the maintenance of the intestinal epithelium under normal homeostasis.
The SCD-d neutral model is an attractive model that could explain the experimentally observed growth of labeled ISC clones in the lineage-tracing studies in mice (28, 45) and in human (2). This SCD-d neutral drift model, which was inspired by the stepping stone model of neutral drift in population genetics (23) and voter model (20), hypothesizes that self-renewal is regulated extrinsically in a coordinated and geometrically restricted fashion and that the growth of the clones is compensated by the behavior (loss or gain) of neighbors (24). As a result, labeled ISCs are treated differently from unlabeled ISCs such that labeled ISCs belong to a geometrically restricted labeled group and behave coordinately within the group while unlabeled ISCs do not (population asymmetry). In a similar manner, labeled ISCs at the edges of the clone (or cluster) are treated differently from the rest of labeled ISCs within a labeled clone (or cluster) (Fig. 10). Therefore, in the SCD-d neutral drift model, every ISC is not treated equally. Although such assumptions are relevant when we analyze genetically mutated clones that behave differently from normal clones, these assumptions may be inappropriate under normal physiological conditions when cell and molecular properties of labeled ISCs are the same as those of unlabeled ISCs. More controversially, the SCD-d neutral drift model depends on an assumption that self-renewal occurs almost exclusively by symmetric divisions.
In contrast to the SCD-d neutral drift model, the growing behavior of labeled and unlabeled ISCs in the stochastic branching process model and Moran process model is not geometrically restricted. Every ISC is treated equally. Although a cluster formation is not expected from the Moran process model, the growth pattern of labeled clones expected from the branching process model should be similar to the pattern expected from the SCD-d model and therefore to the in vivo pattern (Fig. 10). This is because the labeled differentiated precursors leave the compartment by migrating directly upward. Moreover, the results here indicate that the branching process model could simulate the stochastic neutral clonal drift of the ISC clone. In fact, the simulation is comparable with the reference growth and therefore to the in vivo dynamics observed in lineage-tracing studies (28, 45) using comparable optimal probabilities for ss, dd and sd division modes (Table 1). Although these optimal probabilities need to be recomputed in accordance with changes in parameters such as division rate and total number of ISCs in the stem cell pool, we expect the major conclusions from the present in silico results to remain the same. The current simulation studies demonstrate that different modeling could lead to different insights in ISC dynamics observed in in vivo experiments (4, 8, 16, 38). As our simulation illustrates, the difference in the presence or absence (70% vs. 0%) of the asymmetric cell division mode in the ISC dynamics is highly significant in terms of ISC biology.
A recent in vivo live lineage-tracing study of Lgr5+ ISCs suggests the presence of stem niche-dependent heterogeneity of ISC dynamics in which ISCs near the niche border are prone to differentiate into progenitors while core ISCs at the crypt base possess a short-term bias toward self-renewal (38). In this hypothesis, all Lgr5+ ISCs equally retain a long-term self-renewal potential by stochastic reciprocal exchange between ISCs cells positioned near the border and at the crypt base (38). Moreover, for many adult stem cells, signaling that involves fate-determining genes such as Notch, Numb, and Hes is closely linked with division mode selection within the stem cell niche (14, 19). These intrinsic signals are coordinated by extrinsic stem niche signals and others such as those from immune cells to regulate ISC dynamics and maintain normal homeostasis of the intestinal epithelium. We expect that the optimal cell division mode is dramatically altered during development (22) and under pathological conditions such as injuries, inflammation, and cancers (17). Future challenges include the incorporation of such significant spatial and temporal extrinsic and intrinsic signals into the in silico model to better understand in vivo ISC dynamics under normal and pathological conditions.
GRANTS
This work was supported by the Intramural Research Programs of the National Institute of Diabetes and Digestive and Kidney Diseases, National Institutes of Health.
DISCLOSURES
No conflicts of interest, financial or otherwise, are declared by the authors.
AUTHOR CONTRIBUTIONS
Y.S. and S.A.W. conceived and designed research; Y.S. and J.F. performed experiments; Y.S. and J.F. analyzed data; Y.S., C.C.C., and S.A.W. interpreted results of experiments; Y.S. prepared figures; Y.S. drafted manuscript; Y.S., C.C.C., and S.A.W. edited and revised manuscript; Y.S., C.C.C., and S.A.W. approved final version of manuscript.
REFERENCES
- 1.Bajaj J, Zimdahl B, Reya T. Fearful symmetry: subversion of asymmetric division in cancer development and progression. Cancer Res 75: 792–797, 2015. doi: 10.1158/0008-5472.CAN-14-2750. [DOI] [PMC free article] [PubMed] [Google Scholar]
- 2.Baker AM, Cereser B, Melton S, Fletcher AG, Rodriguez-Justo M, Tadrous PJ, Humphries A, Elia G, McDonald SA, Wright NA, Simons BD, Jansen M, Graham TA. Quantification of crypt and stem cell evolution in the normal and neoplastic human colon. Cell Reports 8: 940–947, 2014. doi: 10.1016/j.celrep.2014.07.019. [DOI] [PMC free article] [PubMed] [Google Scholar]
- 3.Barker N, van Es JH, Kuipers J, Kujala P, van den Born M, Cozijnsen M, Haegebarth A, Korving J, Begthel H, Peters PJ, Clevers H. Identification of stem cells in small intestine and colon by marker gene Lgr5. Nature 449: 1003–1007, 2007. doi: 10.1038/nature06196. [DOI] [PubMed] [Google Scholar]
- 4.Bertalan Z, Zapperi S, La Porta CA. Modeling mechanical control of spindle orientation of intestinal crypt stem cells. J Theor Biol 430: 103–108, 2017. doi: 10.1016/j.jtbi.2017.07.012. [DOI] [PubMed] [Google Scholar]
- 5.Bjerknes M. A test of the stochastic theory of stem cell differentiation. Biophys J 49: 1223–1227, 1986. doi: 10.1016/S0006-3495(86)83751-1. [DOI] [PMC free article] [PubMed] [Google Scholar]
- 6.Bjerknes M, Cheng H. Clonal analysis of mouse intestinal epithelial progenitors. Gastroenterology 116: 7–14, 1999. doi: 10.1016/S0016-5085(99)70222-2. [DOI] [PubMed] [Google Scholar]
- 7.Blackmore K, Zhou W, Dailey MJ. LKB1-AMPK modulates nutrient-induced changes in the mode of division of intestinal epithelial crypt cells in mice. Exp Biol Med (Maywood) 242: 1490–1498, 2017. doi: 10.1177/1535370217724427. [DOI] [PMC free article] [PubMed] [Google Scholar]
- 8.Carulli AJ, Samuelson LC, Schnell S. Unraveling intestinal stem cell behavior with models of crypt dynamics. Integr Biol 6: 243–257, 2014. doi: 10.1039/c3ib40163d. [DOI] [PMC free article] [PubMed] [Google Scholar]
- 9.Cheng H, Leblond CP. Origin, differentiation and renewal of the four main epithelial cell types in the mouse small intestine. I. Columnar cell. Am J Anat 141: 461–479, 1974. doi: 10.1002/aja.1001410403. [DOI] [PubMed] [Google Scholar]
- 10.Clevers H. Stem cells, asymmetric division and cancer. Nat Genet 37: 1027–1028, 2005. doi: 10.1038/ng1005-1027. [DOI] [PubMed] [Google Scholar]
- 11.Corish P, Tyler-Smith C. Attenuation of green fluorescent protein half-life in mammalian cells. Protein Eng 12: 1035–1040, 1999. doi: 10.1093/protein/12.12.1035. [DOI] [PubMed] [Google Scholar]
- 12.Dingli D, Traulsen A, Michor F. (A)symmetric stem cell replication and cancer. PLOS Comput Biol 3: e53, 2007. doi: 10.1371/journal.pcbi.0030053. [DOI] [PMC free article] [PubMed] [Google Scholar]
- 13.Dunn SJ, Näthke IS, Osborne JM. Computational models reveal a passive mechanism for cell migration in the crypt. PLoS One 8: e80516, 2013. doi: 10.1371/journal.pone.0080516. [DOI] [PMC free article] [PubMed] [Google Scholar]
- 14.Egger B, Gold KS, Brand AH. Notch regulates the switch from symmetric to asymmetric neural stem cell division in the Drosophila optic lobe. Development 137: 2981–2987, 2010. doi: 10.1242/dev.051250. [DOI] [PMC free article] [PubMed] [Google Scholar]
- 15.Farin HF, Van Es JH, Clevers H. Redundant sources of Wnt regulate intestinal stem cells and promote formation of Paneth cells. Gastroenterology 143: 1518–1529.e7, 2012. doi: 10.1053/j.gastro.2012.08.031. [DOI] [PubMed] [Google Scholar]
- 16.Fletcher AG, Breward CJ, Jonathan Chapman S. Mathematical modeling of monoclonal conversion in the colonic crypt. J Theor Biol 300: 118–133, 2012. doi: 10.1016/j.jtbi.2012.01.021. [DOI] [PubMed] [Google Scholar]
- 17.Goulas S, Conder R, Knoblich JA. The Par complex and integrins direct asymmetric cell division in adult intestinal stem cells. Cell Stem Cell 11: 529–540, 2012. doi: 10.1016/j.stem.2012.06.017. [DOI] [PMC free article] [PubMed] [Google Scholar]
- 18.Gross S, Balderes D, Liu J, Asfaha S, Gu G, Wang TC, Sussel L. Nkx2.2 is expressed in a subset of enteroendocrine cells with expanded lineage potential. Am J Physiol Gastrointest Liver Physiol 309: G975–G987, 2015. doi: 10.1152/ajpgi.00244.2015. [DOI] [PMC free article] [PubMed] [Google Scholar]
- 19.Hatakeyama J, Kageyama R. Notch1 expression is spatiotemporally correlated with neurogenesis and negatively regulated by Notch1-independent Hes genes in the developing nervous system. Cereb Cortex 16, Suppl 1: i132–i137, 2006. doi: 10.1093/cercor/bhj166. [DOI] [PubMed] [Google Scholar]
- 20.Holley RA, Liggett TM. Ergodic theorems for weakly interacting infinite systems and voter model. Ann Probab 3: 643–663, 1975. doi: 10.1214/aop/1176996306. [DOI] [Google Scholar]
- 21.Hwang WL, Jiang JK, Yang SH, Huang TS, Lan HY, Teng HW, Yang CY, Tsai YP, Lin CH, Wang HW, Yang MH. MicroRNA-146a directs the symmetric division of Snail-dominant colorectal cancer stem cells. Nat Cell Biol 16: 268–280, 2014. doi: 10.1038/ncb2910. [DOI] [PubMed] [Google Scholar]
- 22.Itzkovitz S, Blat IC, Jacks T, Clevers H, van Oudenaarden A. Optimality in the development of intestinal crypts. Cell 148: 608–619, 2012. doi: 10.1016/j.cell.2011.12.025. [DOI] [PMC free article] [PubMed] [Google Scholar]
- 23.Kimura M, Weiss GH. The stepping stone model of population structure and the decrease of genetic correlation with distance. Genetics 49: 561–576, 1964. [DOI] [PMC free article] [PubMed] [Google Scholar]
- 24.Klein AM, Simons BD. Universal patterns of stem cell fate in cycling adult tissues. Development 138: 3103–3111, 2011. doi: 10.1242/dev.060103. [DOI] [PubMed] [Google Scholar]
- 25.Knoblich JA. Mechanisms of asymmetric stem cell division. Cell 132: 583–597, 2008. doi: 10.1016/j.cell.2008.02.007. [DOI] [PubMed] [Google Scholar]
- 26.Lathia JD, Hitomi M, Gallagher J, Gadani SP, Adkins J, Vasanji A, Liu L, Eyler CE, Heddleston JM, Wu Q, Minhas S, Soeda A, Hoeppner DJ, Ravin R, McKay RD, McLendon RE, Corbeil D, Chenn A, Hjelmeland AB, Park DM, Rich JN. Distribution of CD133 reveals glioma stem cells self-renew through symmetric and asymmetric cell divisions. Cell Death Dis 2: e200, 2011. doi: 10.1038/cddis.2011.80. [DOI] [PMC free article] [PubMed] [Google Scholar]
- 27.Loeffler M, Birke A, Winton D, Potten C. Somatic mutation, monoclonality and stochastic models of stem cell organization in the intestinal crypt. J Theor Biol 160: 471–491, 1993. doi: 10.1006/jtbi.1993.1031. [DOI] [PubMed] [Google Scholar]
- 28.Lopez-Garcia C, Klein AM, Simons BD, Winton DJ. Intestinal stem cell replacement follows a pattern of neutral drift. Science 330: 822–825, 2010. doi: 10.1126/science.1196236. [DOI] [PubMed] [Google Scholar]
- 29.Martini E, Wittkopf N, Günther C, Leppkes M, Okada H, Watson AJ, Podstawa E, Backert I, Amann K, Neurath MF, Becker C. Loss of survivin in intestinal epithelial progenitor cells leads to mitotic catastrophe and breakdown of gut immune homeostasis. Cell Reports 14: 1062–1073, 2016. doi: 10.1016/j.celrep.2016.01.010. [DOI] [PubMed] [Google Scholar]
- 30.Mizukawa B, O’Brien E, Moreira DC, Wunderlich M, Hochstetler CL, Duan X, Liu W, Orr E, Grimes HL, Mulloy JC, Zheng Y. The cell polarity determinant CDC42 controls division symmetry to block leukemia cell differentiation. Blood 130: 1336–1346, 2017. doi: 10.1182/blood-2016-12-758458. [DOI] [PMC free article] [PubMed] [Google Scholar]
- 31.Moran P. The Statistical Processes of Evolutionary Theory. Oxford, UK: Clarendon, 1962, p. 200. [Google Scholar]
- 32.Moran PA. Random processes in genetics. Math Proc Camb Philos Soc 54: 60–71, 1958. doi: 10.1017/S0305004100033193. [DOI] [Google Scholar]
- 33.Morrison SJ, Kimble J. Asymmetric and symmetric stem-cell divisions in development and cancer. Nature 441: 1068–1074, 2006. doi: 10.1038/nature04956. [DOI] [PubMed] [Google Scholar]
- 34.Neumüller RA, Knoblich JA. Dividing cellular asymmetry: asymmetric cell division and its implications for stem cells and cancer. Genes Dev 23: 2675–2699, 2009. doi: 10.1101/gad.1850809. [DOI] [PMC free article] [PubMed] [Google Scholar]
- 35.Periwal V, Chow CC, Bergman RN, Ricks M, Vega GL, Sumner AE. Evaluation of quantitative models of the effect of insulin on lipolysis and glucose disposal. Am J Physiol Regul Integr Comp Physiol 295: R1089–R1096, 2008. doi: 10.1152/ajpregu.90426.2008. [DOI] [PMC free article] [PubMed] [Google Scholar]
- 36.Potten CS. Stem cells in gastrointestinal epithelium: numbers, characteristics and death. Philos Trans R Soc Lond B Biol Sci 353: 821–830, 1998. doi: 10.1098/rstb.1998.0246. [DOI] [PMC free article] [PubMed] [Google Scholar]
- 37.Quyn AJ, Appleton PL, Carey FA, Steele RJ, Barker N, Clevers H, Ridgway RA, Sansom OJ, Näthke IS. Spindle orientation bias in gut epithelial stem cell compartments is lost in precancerous tissue. Cell Stem Cell 6: 175–181, 2010. doi: 10.1016/j.stem.2009.12.007. [DOI] [PubMed] [Google Scholar]
- 38.Ritsma L, Ellenbroek SI, Zomer A, Snippert HJ, de Sauvage FJ, Simons BD, Clevers H, van Rheenen J. Intestinal crypt homeostasis revealed at single-stem-cell level by in vivo live imaging. Nature 507: 362–365, 2014. doi: 10.1038/nature12972. [DOI] [PMC free article] [PubMed] [Google Scholar]
- 39.Sallé J, Gervais L, Boumard B, Stefanutti M, Siudeja K, Bardin AJ. Intrinsic regulation of enteroendocrine fate by Numb. EMBO J 36: 1928–1945, 2017. doi: 10.15252/embj.201695622. [DOI] [PMC free article] [PubMed] [Google Scholar]
- 40.Sangiorgi E, Capecchi MR. Bmi1 is expressed in vivo in intestinal stem cells. Nat Genet 40: 915–920, 2008. doi: 10.1038/ng.165. [DOI] [PMC free article] [PubMed] [Google Scholar]
- 41.Sato T, van Es JH, Snippert HJ, Stange DE, Vries RG, van den Born M, Barker N, Shroyer NF, van de Wetering M, Clevers H. Paneth cells constitute the niche for Lgr5 stem cells in intestinal crypts. Nature 469: 415–418, 2011. doi: 10.1038/nature09637. [DOI] [PMC free article] [PubMed] [Google Scholar]
- 42.Scheer A, Knauer SK, Verhaegh R. Survivin expression pattern in the intestine of normoxic and ischemic rats. BMC Gastroenterol 17: 76, 2017. doi: 10.1186/s12876-017-0625-6. [DOI] [PMC free article] [PubMed] [Google Scholar]
- 43.Schepers AG, Vries R, van den Born M, van de Wetering M, Clevers H. Lgr5 intestinal stem cells have high telomerase activity and randomly segregate their chromosomes. EMBO J 30: 1104–1109, 2011. doi: 10.1038/emboj.2011.26. [DOI] [PMC free article] [PubMed] [Google Scholar]
- 44.Sei Y, Lu X, Liou A, Zhao X, Wank SA. A stem cell marker-expressing subset of enteroendocrine cells resides at the crypt base in the small intestine. Am J Physiol Gastrointest Liver Physiol 300: G345–G356, 2011. doi: 10.1152/ajpgi.00278.2010. [DOI] [PMC free article] [PubMed] [Google Scholar]
- 45.Snippert HJ, van der Flier LG, Sato T, van Es JH, van den Born M, Kroon-Veenboer C, Barker N, Klein AM, van Rheenen J, Simons BD, Clevers H. Intestinal crypt homeostasis results from neutral competition between symmetrically dividing Lgr5 stem cells. Cell 143: 134–144, 2010. doi: 10.1016/j.cell.2010.09.016. [DOI] [PubMed] [Google Scholar]
- 46.Stamp C, Zupanic A, Sachdeva A, Stoll EA, Shanley DP, Mathers JC, Kirkwood TB, Heer R, Simons BD, Turnbull DM, Greaves LC. Predominant asymmetrical stem cell fate outcome limits the rate of niche succession in human colonic crypts. EBioMedicine 31: 166–173, 2018. doi: 10.1016/j.ebiom.2018.04.017. [DOI] [PMC free article] [PubMed] [Google Scholar]
- 47.Taylor HM, Karlin S. An Introduction to Stochastic Modeling. San Diego, CA: Academic, 1998, p. xi. [Google Scholar]
- 48.Tian H, Biehs B, Warming S, Leong KG, Rangell L, Klein OD, de Sauvage FJ. A reserve stem cell population in small intestine renders Lgr5-positive cells dispensable. Nature 478: 255–259, 2011. doi: 10.1038/nature10408. [DOI] [PMC free article] [PubMed] [Google Scholar]
- 49.Uren AG, Wong L, Pakusch M, Fowler KJ, Burrows FJ, Vaux DL, Choo KH. Survivin and the inner centromere protein INCENP show similar cell-cycle localization and gene knockout phenotype. Curr Biol 10: 1319–1328, 2000. doi: 10.1016/S0960-9822(00)00769-7. [DOI] [PubMed] [Google Scholar]
- 50.Yan KS, Chia LA, Li X, Ootani A, Su J, Lee JY, Su N, Luo Y, Heilshorn SC, Amieva MR, Sangiorgi E, Capecchi MR, Kuo CJ. The intestinal stem cell markers Bmi1 and Lgr5 identify two functionally distinct populations. Proc Natl Acad Sci USA 109: 466–471, 2012. doi: 10.1073/pnas.1118857109. [DOI] [PMC free article] [PubMed] [Google Scholar]
- 51.Yan KS, Gevaert O, Zheng GX, Anchang B, Probert CS, Larkin KA, Davies PS, Cheng ZF, Kaddis JS, Han A, Roelf K, Calderon RI, Cynn E, Hu X, Mandleywala K, Wilhelmy J, Grimes SM, Corney DC, Boutet SC, Terry JM, Belgrader P, Ziraldo SB, Mikkelsen TS, Wang F, von Furstenberg RJ, Smith NR, Chandrakesan P, May R, Chrissy MAS, Jain R, Cartwright CA, Niland JC, Hong YK, Carrington J, Breault DT, Epstein J, Houchen CW, Lynch JP, Martin MG, Plevritis SK, Curtis C, Ji HP, Li L, Henning SJ, Wong MH, Kuo CJ. Intestinal enteroendocrine lineage cells possess homeostatic and injury-inducible stem cell activity. Cell Stem Cell 21: 78–90.e6, 2017. doi: 10.1016/j.stem.2017.06.014. [DOI] [PMC free article] [PubMed] [Google Scholar]


