

Abstract
Appropriate scaling of motor output from mouse to humans is essential. The motoneurons that generate all motor output are, however, very different in rodents compared with humans, being smaller and much more excitable. In contrast, feline motoneurons are more similar to those in humans. These scaling differences need to be taken into account for the use of rodents for translational studies of motor output.
Introduction
Rodents provide many advantages for examining cellular and molecular mechanisms. These animals are, however, much smaller than humans, and the consequences of this wide difference in scale are often unclear. In neural control of movement, scale considerations are fundamentally important, since failure of motor commands to consider body mass and dimension will cause major movement errors. Here, we focus on a fundamental aspect of the scaling across species for control of movement and generation of motor output by motoneurons.
Motoneurons form the neural part of the motor unit, which comprises one motoneuron in the ventral gray matter of the spinal cord, its axon, and the muscle fibers that this axon innervates. The set of muscle fibers within a motor unit is often referred to as its muscle unit. A motor pool is the set of all motoneurons innervating a single muscle. The term motor unit pool is sometimes used to refer to an entire motor pool and its muscle (23). All motor commands are implemented by motor units, which constitute the quantal elements of motor control. In this review, we consider scaling of both mechanical and neural parameters of the motor unit but focus on electrical properties of the motoneuron to provide a basis for considering scaling of neural control of motor output.
The size of a motor unit in a larger animal is impressive. Consider, for example, a human motor unit for an ankle extensor. Its axon is on the order of a meter long and will branch to innervate 500–1,000 or more muscle fibers (23). In the ventral horn, the dendritic tree of the motoneuron has extensive branches, with as many 10–20 major primary trunks extending from the soma (78), each with its own complex set of sub-branches (7, 10, 11). As a result, motoneurons are probably the largest neurons in the CNS. FIGURE 1 shows the size of a motoneuron compared with other types of CNS neurons (note: the axon of the motoneuron forms part of the peripheral nervous system, but the cell body is within the CNS, behind the blood-brain barrier). Presumably, the reason for the large size of motoneurons is that all motor command systems, descending, sensory, and pattern generators, have to each be able to generate substantial motor output. Thus motoneuron need to have large numbers of synapses.
FIGURE 1.
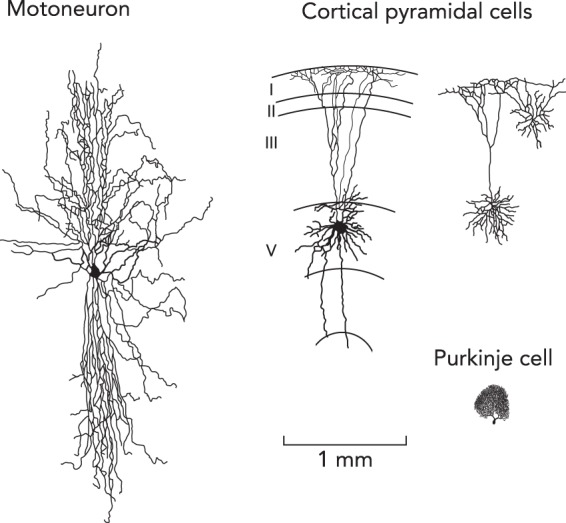
Comparison of sizes of motoneurons to other types of neurons
All data were obtained from cat experiment and are drawn to the same scale. Unpublished data are from Ken Rose and colleagues and used with permission.
The focus of this review is on the range of average motor unit properties across animals of different sizes, but it is important to realize that there are wide differences in sizes of the motor units that compose a single motor unit pool for each muscle in every animal. These within-muscle differences are well understood and form the fundamental basis of all motor output, Henneman’s size principle of motor unit recruitment (27). This principle has been the topic of multiple reviews (see Ref. 23) and will be only briefly summarized here. The differences within a pool of motor units have been most thoroughly studied in the cat and rat, with systematic data for the mouse just emerging. The ranges of motor unit properties within a single motor unit pool are impressive in all three species (4–6, 42–45, 52, 53, 58, 67, 72, 77). Perhaps the most important points for generation of motor output are that threshold currents for onset of spiking in motoneurons vary as much as 30-fold (20) and that these differences are strongly correlated with wide ranges in the properties of their muscle units, with up to a 5-fold range in contraction speed, a 50- to 100-fold range in maximum forces, and similarly wide ranges in fatigue resistances (this latter range is difficult to specify, since slow motor units are so resistant to fatigue that putting a maximum on this parameter is not practical) (3). These within-pool differences are highly intercorrelated, and these correlations are often used to define types of motor units. Type S motor units have low current thresholds for spiking, slow contraction speeds, and low forces but high resistances to fatigue, whereas type FF (fast fatigable) have the opposite properties, and type FR (fast fatigue resistant) have intermediate properties (3). It should be kept in mind, however, that all motor unit properties are distributed along a continuum with no clusters (23). FIGURE 2 illustrates a relationship at the core of the mechanism of the size principle, the strong correlation between motoneuron input conductance and muscle unit twitch force. Input conductance is the primary determinant of threshold currents and, moreover, is proportional to the size of the motoneuron (62), whereas twitch force is proportional to size of the muscle unit. Thus recruitment order proceeds according to motor unit size (S > FR > FF), providing near optimal fatigue resistance and energy efficiency at any given force level. Equally important, this single organizing principle for motor output provides computational simplicity, since it is the motoneurons themselves that determine their recruitment order via their differences in threshold (27)
FIGURE 2.
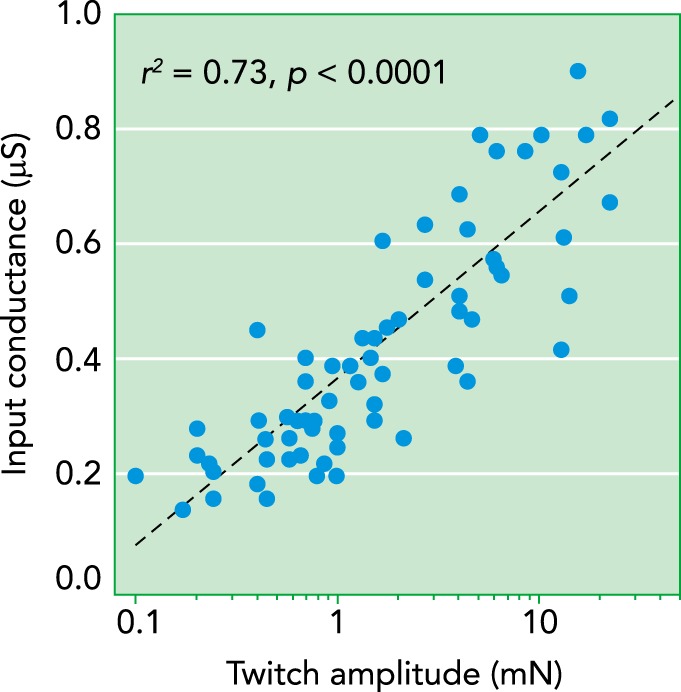
Systematic relation between a key motoneuron electrical parameter and a key muscle unit mechanical parameter
Systematic relation between a key motoneuron electrical parameter and a key muscle unit mechanical parameter within a single motor unit pool in the mouse for the ankle extensor medial gastrocnemius. Input conductance (y-axis) is proportional to motoneuron size, and muscle twitch amplitude (x-axis) is proportional to muscle unit size. This relationship is the core mechanism of Henneman’s size principle of motor unit recruitment because input conductance is the primary determinant of threshold currents for spike initiation. Data set is from Ref. 55.
The differences in mass from mouse to man are enormous, more than 1,000-fold from ~30 g to ~70,000 g. This review will focus on data from mouse, rat (~300 g), and cat (~3,000 g), and then consider extrapolation of these smaller animal data to human motor units. This limitation results from the impossibility of direct measurements of the electrical properties of mature human motoneurons and the difficulties in measuring human motor unit forces. The only recordings from human motoneurons have been performed in vitro, either in embryos (70) or on induced pluripotent stem cells (14). Furthermore, even when individual human motor axons are stimulated by invasive methods, the resulting motor unit torques depend on joint moment arms and may also be distorted by passive interactions with the comparatively vast surrounding tissue (25). Even in animal preparations, the electrical properties of motoneurons and the forces of motor units have been measured in relatively few muscles. Most studies have focused on the medial gastrocnemius (MG) muscle, a major ankle extensor that contributes to the Achilles tendon, so we focus on the MG motor unit pool (3, 23). Motor unit composition of the MG, however, is not constant, with rats having a higher percentage of FR units and cats having a higher percentage of FF units (45) [mice probably also have more FR units (see Ref. 55)]. These differences may relate to behavior. Rodents tend to have constant exploratory behavior, whereas cats tend to have extended periods of rest interspersed with short periods of activity. Nonetheless, clear patterns emerge with scale.
Scaling of Mechanical Parameters
Although body mass scales ~100-fold from mouse to cat, MG motor unit forces scale only ~50- to 60-fold (45, 52). Maximum tetanic forces of the whole MG muscle range from ~1.8 N for the mouse (39) to ~11 N for the rat (38) to ~100 N for the cat (9), again a 50- to 60-fold range. The decrease in muscle contraction speed as the size of the animal increases is well established and has previously been reviewed (8). From mouse to cat, there is about a two- to threefold slowing in contraction speed, with contraction times to the peak of twitch force varying from ~10 to 30 ms (average FF to average S) (55, 58) to 26 to 57 ms (45). This speed range is much smaller than the mass and force ranges.
Direct studies of individual motor unit forces by stimulation of their axons in humans are extremely difficult, requiring demanding microneurographic techniques based on insertion of fine electrodes into nerves. The most complete study by Fuglevand and colleagues (16) of extrinsic and intrinsic hand muscle revealed average tetanic torques at the thumb or fingers of ~200–220 mN, with a range from ~100 to 500 mN. These force values are measured at the distal finger, not, as in animal preparations, via direct measurements from the tendon. The number of motor units in the human MG and their forces have not been measured, but presumably human MG forces are much greater than in the cat MG. Contraction speed is also likely to be much slower in humans. Contraction times of human ankle extensors are, however, undoubtedly much slower than in the cat. Measurements of twitch torque from electrical stimulation of all the ankle extensors generate contraction times of 110–120 ms (57). The contraction time of the whole MG muscle in the mouse is ~22 ms (26, 51), suggesting a five- to sixfold difference in speed from mouse to human.
Motoneuron Anatomy
Given the large differences in animal size and mass, and the nearly as large differences in motor unit forces, one might expect equally large differences in sizes of motoneurons. On the other hand, perhaps scaling in the CNS is largely achieved by increases in numbers of neurons instead of their sizes (for example, see Ref. 50). The available data for motoneurons show that there is substantial scaling in size, although this falls well short of mass scaling. Soma diameter from mouse to human has about a twofold range (mouse: 27 µm; rat: 35 µm; cat 53 µm; humans: 62 µm) [the only reference for all of these species using the same histological method is that of Hardesty (22) from 1902]. Scaling of volume should be larger, given the nonlinear conversion from diameter to volume. Using the simple assumption of converting these diameters to spheres, the scaling factor would be ~10-fold (~10,000 µm3 for mouse to ~125,000 µm3 for humans). Total surface area is perhaps a better measure, since it includes the very extensive dendritic tree of motoneurons (see FIGURES 1 AND 3). This data is only available for rat (151,000 µm2) (7) and cat (559,000 µm2) (10), giving about a 3.7-fold difference. Since these modern studies had similar values for soma diameters for rat and cat (rat: 35.2 µm; cat: 51.7 µm) as in the classic study by Hardesty (35 µm and 53 µm), and since the estimation of soma volume gives a 3.7-fold difference between rat and cat (with the simple assumption of spheres), it is perhaps reasonable to assume surface area scales approximately with soma volume. If this assumption is correct, then human motoneurons would have a surface area of ~10-fold greater than that of mice (human data are highly unlikely to become available, but we are working on mouse motoneuron reconstructions). The large surface area of the motoneuron may reflect its primary function, in that all sensory afferents and motor circuits that influence movement have to do so via motoneurons, requiring large numbers of synaptic contacts. The issue of whether the density of these contacts remains constant across species is unclear due to lack of data.
FIGURE 3.

Approximate scaling of motoneurons across species
All are shown to the same scale (scale bars are 250 µm for the mouse, 500 µm for the rat and cat, and 2 mm for the human). The human motoneuron is a rough estimate obtained by expanding the cat motoneuron image to fill the ventral horn from a human subject. Mouse motoneuron is from unpublished data from Nicolas Delestrée, Daniel Zytnicki, and Marin Manuel. Rat motoneuron is from Ref. 7 and reproduced with permission. Cat motoneuron is from Ref. 73 and reproduced with permission. Human spinal cord outline is from Ref. 68 and used with permission.
FIGURE 3 shows 2D views of 3D reconstructions of mouse, rat, and cat motoneurons, all to the same scale, which are then used to generate a very approximate estimate of a human motoneuron. This estimate was done by noting that, in all 3 smaller species, motoneuron dendrites more than fill the extent of the ventral horn (7, 54, 60). We therefore obtained the outline of a human ventral horn (68) and scaled up the cat motoneuron to fill it to a similar extent as for the smaller animals. The maximum overall extents of the dendritic trees is thereby estimated to vary approximately from mouse to human 5- to 10-fold. Note that this scaling is most likely overly simplistic. For one, the dendritic tree of motoneurons is not spherical but tends to extend further in the rostro-caudal direction that in the transversal plane (7), and we have no way of estimating the rostro-caudal extent of the dendritic tree in humans. Nevertheless, FIGURE 3 illustrates visually (albeit crudely) the leap that one has to make to jump from mouse motoneurons to humans'. In particular, the large size of human motoneurons presumably permits a larger amount of synaptic contacts, particularly direct connections from the cortico-spinal tract, which are absent in lower vertebrates. Overall, these anatomical scaling factors are substantial but of course fall well short of the 100-fold differences mass from mouse to cat and 1,000-fold mouse to human. The larger sizes of muscles in larger animals thus requires many more motor units—for example, in the rat MG, there are ~55 motor units (6), in the cat MG ~270 motor units (3), and in large primate muscles over 1,000 motor units (36).
Motoneuron Electrical Properties
With the recent completion of our studies of the electrical properties of mouse motoneurons using in vivo voltage clamp measurements (33), a full set of data for electrical properties of motoneurons is now available for mouse (33, 35, 52, 53, 58), rat (5, 21, 72), and cat (33, 41, 47, 48). One key parameter for determining the net excitability of the motoneuron is the passive electrical conductance at the resting potential [i.e., the input conductance (GN)]. This conductance is set by the leak current flowing through the K channels that determines the resting potential (62). There is an approximately threefold range in conductance between mouse (0.41 µS) and cat (1.22 µS) motoneurons (33). The range of these values within each species is, however, ~5 to 10-fold (e.g., see FIGURE 2), as required by Henneman’s size principle. Because of this within-species range, there are mouse FF motoneurons with conductances as large as cat S motoneurons.
From the perspective of how recruitment and rate patterns are produced to generate muscle forces, the crucial parameters are the threshold currents required to depolarize the cell from rest to onset of repetitive firing (F-ITHRES), and slope of the relationship between frequency of firing and amplitude of injected current (F-I gain). These two parameters are usually assessed from a slow triangular modulation of injected current. In response to such a protocol, mouse motoneurons have a substantial “sub-primary” range (35, 52, 53), where spiking patterns are highly noisy, before settling into the classic steady firing known as the primary range (40). Interestingly, existence of a sub-primary range has also been demonstrated in rat motoneurons soon after its demonstration in mice (72). Moreover, the presence of a sub-primary range in cat motoneurons has been acknowledged very recently and was shown to persist even in the absence of anesthetics in both mice and cats (36a). The firing rate at the onset of the primary range in the mouse is relatively high (30–70 Hz) (52), much higher than in the cat (10–15 Hz) (42). This difference is important for the matching of electrical to mechanical properties of the motor unit (see below).
Voltage clamp studies to identify the main steady currents underlying repetitive firing have revealed a surprise. Motoneurons have very strong persistent inward currents (PICs), which are generated by voltage-sensitive Na and Ca channels that inactivate slowly (the Na PIC lasts several seconds) or not at all (the CaPIC can last minutes) (32, 49, 63). In the comparative voltage clamp studies, the data are dominated by the NaPIC, since the CaPIC is in a dis-facilitated state in the anesthetized preparation (see Neuromodulatory Inputs from the Brain Stem below). The surprising result is that, unlike all other mechanical and electrical parameters considered thus far, the PICs in mouse motoneurons (2.39 ± 1.96 nA) are not significantly smaller than in cat motoneurons (3.38 ± 4.47 nA) (33) (see Table 1). The implications of similarity of PICs values are considered next.
Table 1.
Electrical parameters and ranges of motoneurons in three different species
| GN, µS | F-ITHRES, nA | F-I gain, Hz/nA | PIC, nA | PIC/GN | %Max F at Rmin | |
|---|---|---|---|---|---|---|
| Cat | 1.2a | 15a | 1.7a | 3.4a | 2.7a | ~10e |
| Rat | 0.5b | 9.5d | 4.7a | 7.7b | 15.4a,b | ~70f |
| Mouse | 0.4a | 5.0c | 10.6a | 2.4a | 5.8a | ~90c |
| X-fold | ~3 | ~3 | ~6 | ~1 | ~2 | ~9 |
aPentobarbital anesthetized cat data from Ref. 33. bData from Ref. 21. cData from Ref. 52. dData from Ref. 72. eData from Ref. 42. fData from T. H. Hamm personal communication. GN, input conductance; F-ITHRES, current threshold for repetitive firing; F-I gain, slope of the relationship between injected current and firing frequency; PIC, persistent inward current; %MaxF, percentage of maximum muscle unit force; Rmin, firing rate at onset of steady repetitive firing.
Because of the fundamental role of the thresholds and gains of the F-I relationships of motoneurons in determining the recruitment and rate coding patterns during normal motor behavior (23), these two parameters are the canonical measurements of intrinsic motoneuron excitability. Mouse motoneurons are much more excitable than cat motoneurons. Values for F-ITHRES in the mouse ranged from ~1 to 12 nA (33, 52), from ~1.6 to 22 nA in the rat (72), but from ~3 to 30 nA in the cat (43). Overall, there is about a threefold difference in mean values, which is consistent with the range of input conductances (Table 1). This similarity is expected because, as noted above, conductance is the main determinant of F-I threshold (62). FIGURE 4A shows the F-I gains in the primary range for mouse (10.6 ± 5.69 Hz/nA), rat (4.7 ± 3.3 Hz/nA), and cat (1.7 ± 0.5 Hz/nA) (see also Table 1) (33). Note that although there is some overlap between mouse and cat GN values (FIGURE 3), the nearly sixfold differences in average values for F-I gains preclude overlap in mouse and cat. FIGURE 4B shows each species has some covariation between gain and GN, although covariation is much stronger within the rodents. The wider range for F-I slope than conductances and thresholds is likely due to three factors. The first is that the PICs in mouse motoneurons are much larger compared with their input conductances than in the cat, giving approximately a twofold difference (see the PIC/GN ratios in Table 1; note that the relatively high value for PICs in the rat reflect a difference in anesthetic—ketamine/xylazine in the rat vs. pentobarbital in the mouse and cat studies) (21, 33). The second is that the afterhyperpolarization (AHP) that follows each spike in the mouse is much shorter than in cat, approximately twofold (53, 58). Finally, the basic time constant of the membrane is approximately twofold faster in the mouse (53). The PIC, especially the Na component, plays a major role in initiation of each spike, whereas the AHP is the main determinant of the time of occurrence of each spike, and the time constant plays a fundamental role in speed of all electrical behaviors. Thus, as a result of difference in conductances, PICs, AHPs, and time constants, each of which is approximately twofold, the intrinsic excitability (gain) of mouse motoneurons is approximately sixfold greater than of cat motoneurons (Table 1). Because the range contraction speed of the motor units from mouse to cat is only approximately two- to threefold, the mouse motoneuron is relatively faster compared with its muscle unit than is the cat, as discussed next.
FIGURE 4.

Differences in the slope (gain) of the relationship between injected current and firing frequency in mouse, rat, and cat
This F-I function is the primary determinant of rate modulation for control of muscle force. A: ranges. B: relationships between F-I gain and input conductance (GN), which, within each species, is proportional to cell size. Data are from Ref. 33.
Even though most human motoneuron properties are impossible to estimate in vivo, since this requires intracellular recording, there is one exception: the AHP. Statistical methods employed at low firing rates (56, 64) indicate the AHP durations of low-threshold human motoneurons, presumably type S and perhaps some type FR, are ~125–140 ms (18, 69), compared with ~40–60 ms in the mouse (58), i.e., about a threefold range.
Matching of Electrical and Mechanical Properties
The classic studies of motoneuron and muscle unit properties within cat motor units by Kernell and colleagues (40, 42) strongly supported the concept of a finely tuned neuromechanical match. There can be little doubt that effective tuning of electrical properties to mechanical output would be subject to strongly evolutionary pressure, given the fundamental role of movement for survival. Yet recent studies have shown that this tuning is very different in mouse vs. cat. In the cat, the motoneuron AHP has about the same duration as its muscle unit force twitch, so that type S motoneurons have AHPs longer than 100 ms and twitches longer than 100 ms, whereas type FFs have short AHPs and twitches, ~30–40 ms (2, 77). A similar match was found for rat motor units in MG (2) but was less clear in a muscle with primarily fast motor units, the ankle flexor tibialis anterior (1). In the mouse MG motor units, AHP and twitch duration are also correlated, but the AHP tends to be significantly shorter than the twitch (52, 58). As emphasized above, this relatively short AHP contributes to the high F-I gains, so that mouse motoneurons are relatively faster and more excitable compared with their muscle units than in the cat. Moreover, because the mouse motoneurons have a very high firing rate at the onset of the primary range, they generate a much higher percentage of maximum motor unit force when steady firing begins, ~80–90% on average (52). In comparison, rats generate ~60–70% (Hamm TM, personal communication), whereas the value for cats is much lower, 10% or less (42). These differences in % force generation arise from equally large differences in firing rate at the onset of the primary range. These firing rates are ~5–15 Hz in the cat (42) but 30–70 in the mouse (52, 53). The low rate in the cat means that the individual twitches generated by each spike are unfused. We have hypothesized that the high percentage of force at primary range onset for mice means that force modulation in this small animal primarily occurs via recruitment instead of rate modulation (52). Recently, Jensen et al. (36a) revisited this issue to take into account variations in muscle temperature on force output. Since they measured whole muscle force, which is dominated by the largest FF units, their data confirm that force summation at the end of the SPR is substantially larger—although maybe not quite as high as initially reported, due to small temperature differences between our two studies—in mouse than in cat motor units (36a).
Although electrical properties of human motoneurons cannot be directly measured, it is relatively easy to measure firing patterns in humans during steady or slowly varying patterns of muscle activation while their lengths are held approximately constant (isometric conditions) (15). It is likely that human motor units fire at much lower rates than in rodents, but quantitative comparisons are difficult. Although there are many studies of measurements of firing patterns in humans, there are few in animals (23, 37). Moreover, the motor patterns studied are different, with human studies focusing on the technically straightforward isometric conditions and animals studies focusing on the more-demanding conditions of locomotion. The few studies done in humans during walking found firing rates between ~12 and 25 Hz (12, 19). In cats, walking rates are ~15–40 Hz (29), which are not far above human rates. For the rat, the range is much higher, ~20–100 Hz, with averages of ~50–60 Hz (17). Hadzipasic et al. (57) performed extracellular recordings of adult mouse motoneuron spiking during locomotion. These mouse motoneurons fired at very high rates (85 Hz and often higher). Even during quiet standing, mouse motor units exhibit rates as high as 30–50 Hz for periods of activity lasting a minimum of several seconds (paradoxically, some units exhibited very low rates; the reason for this wide range is unclear) (67). During long periods of steady activation during quiet standing and posture, rat firing rates range from ~20 to 50 Hz (28). During activation of steady reflexes in the cat, which are likely involved in quiet standing and posture, motor unit firing rates are very low, 5–15 Hz (71). These low cat rates are again similar to those in humans. In humans, during isometric contractions in the range of postural behaviors (~20% or less of maximum), motor units also fire from ~5 to 10 Hz (23). Thus, as a rough estimate, mouse and rat motor units fire three to four times faster than humans, whereas cats are closer to humans, perhaps 1.5 times faster. This closeness of cat to human is consistent with the low percentage of force generated at onset of steady firing in cat motor units (10% or less, see above). As in cats, human motor unit forces near their recruitment are unfused, with clear individual twitches; in fact, this lack of twitch summation at these low rates is the basis of the spike triggered averaging technique to estimate human motor unit twitch parameters (59). The reasonably close rates for humans and cats are also supported by our computer simulations of human motoneurons, which are based on properties of cat motoneurons obtained in intracellular recordings adapted by a modest slowing of the AHP and other minor alterations (65, 66).
Neuromodulatory Inputs from the Brain Stem
Thus far in this review, scaling of excitability of motoneurons has only been considered with respect to data from the anesthetized state. It is, however, well established that motoneuron excitability during normal motor behavior is highly dependent on neuromodulatory inputs (23, 34). These inputs activate G-protein-coupled receptors to alter the behavior of ion channels and thus alter excitability. We have hypothesized that these inputs serve to adjust the excitability of motoneurons to match the wide range of motor behaviors, from precise to crude and weak to strong (24). Motor patterns differ widely as well, from posture to locomotion to an incredible range of volitional movements. Perhaps the strongest neuromodulatory actions on motoneurons are mediated by serotonin, norepinephrine, and acetylcholine, with the first two released by axons originating in the brain stem (30) and acetylcholine by local spinal circuits (76). Unfortunately for the goal of this review, there are few cross-species comparisons of neuromodulatory actions. It is clear that both cat (e.g., Refs. 31, 46) and human (75) motoneurons have a very strong brain stem neuromodulatory drive, which can modulate excitability over a fivefold range. PICs are especially sensitive to this drive (13, 46, 61). One interesting point is that, because mouse motoneurons have a high ratio of PIC amplitude to GN, only a small degree of neuromodulatory facilitation of the mouse PIC amplitudes can have a large impact on overall excitability (33, 61). Thus it is possible rodents have a more restricted range of neuromodulation of motor output, but much further work on this issue is needed.
Summary
Scaling of spinal motor output from mouse to cat to human is not solely based on increases in numbers of motoneurons but also involves considerable increases in the average size of the motoneurons (FIGURE 3) and in their electrical properties. None of the electrical properties of motoneurons, however, exhibited the scaling of mass from mouse to human, which is at least 1,000-fold. The largest difference is in gain of the F-I current function, which is approximately sixfold from mouse to cat (mouse being higher) and thus perhaps eightfold to humans (this is just a guess—direct measurements of motoneuron electrical properties are impossible, except for the spike AHP). Anatomic parameters like soma volume and total surface area exhibit a broader range in scale, with total surface area differing by 10-fold (again, this is an estimate). On the mechanical side, human motor units are perhaps four- to fivefold slower than in mice; estimates of force generated in large muscles like MG are not as yet available, but the force range from mouse to cat is 50-fold or more. Perhaps if human motor unit and muscle forces could be measured directly from the tendon, the difference might be >100-fold.
The main lesson from examining scaling of electrical properties is that mouse motoneurons are relatively more excitable compared with their muscle unit properties than rat or, especially, cat. Presumably, human motoneurons are even less excitable in this respect. As a result of this increase in excitability compared with muscle unit speed, mouse motoneurons readily fire at rates that produce near tetanic motor unit forces, whereas cat and human motoneurons have the capacity to generate repetitive firing at rates far below tetanic max, 10% or less. This implies a much greater scope for rate modulation in larger animals than in rodents. Firing patterns during motor behaviors are consistent with these motoneuron properties—human motor units fire at very low rates for slow or steady motor output; firing rates in rodents can be much higher. These differences imply a fundamental differences in the control of motor output and in the control of movement. For example, fine gradation of force in a rodent muscle where the number of motor units is small and the firing rates of motoneurons is high is unlikely to be possible. Perhaps surprisingly, although cat and human masses differ by >20-fold (3,000–70,000 g), their motoneuron behavior is reasonably similar (low firing rates at onset of repetitive firing, ample scope for rate modulation). Thus translational studies of motor output need to include studies in animals at least as large as the cat, whereas translational studies of motor output from mouse to human are inherently problematic. Substantial differences in behavior of sensory afferents from muscle have also been demonstrated for rat vs. cat (74), with higher dynamic sensitivity of length-sensitive afferents in the rodents. This high dynamic sensitivity would be consistent with the high relative excitability of mouse motoneurons and thus may perhaps also be a feature of sensory input in these very small rodents. Thus scaling issues and differences in the neural control may be a general feature across motor systems of different species. An unresolved question is whether these scaling differences are unique to the neurons directly connected to the periphery (i.e., motoneurons and sensory neurons) or also apply to other neurons involved in generation of motor commands in the spinal cord, brain stem, and higher centers.
Acknowledgments
This work was financed by National Institute of Neurological Disorders and Stroke Grants R01 NS-077863 and R01 NS-09850. M.C. is supported by TL1R001423. V.M.T. is supported by K01 HD-084672.
No conflicts of interest, financial or otherwise, are declared by the author(s).
M.M. and C.J.H. conceived and designed research; M.M., M.C., and C.J.H. prepared figures; M.M., V.M.T., and C.J.H. drafted manuscript; M.M., M.C., V.M.T., and C.J.H. edited and revised manuscript; M.M., M.C., V.M.T., and C.J.H. approved final version of manuscript.
References
- 1.Bakels R, Kernell D. Average but not continuous speed match between motoneurons and muscle units of rat tibialis anterior. J Neurophysiol 70: 1300–1306, 1993. doi: 10.1152/jn.1993.70.4.1300. [DOI] [PubMed] [Google Scholar]
- 2.Bakels R, Kernell D. Matching between motoneurone and muscle unit properties in rat medial gastrocnemius. J Physiol 463: 307–324, 1993. doi: 10.1113/jphysiol.1993.sp019596. [DOI] [PMC free article] [PubMed] [Google Scholar]
- 3.Burke RE. Motor units: anatomy, physiology, and functional organization. In: Handbook of Physiology. The Nervous System. Motor Control. Bethesda, MD: American Physiological Society, 1981, sect. 1, vol. II, pt. 2, chapt. 10, p. 345–422. [Google Scholar]
- 4.Burke RE, Tsairis P. Anatomy and innervation ratios in motor units of cat gastrocnemius. J Physiol 234: 749–765, 1973. doi: 10.1113/jphysiol.1973.sp010370. [DOI] [PMC free article] [PubMed] [Google Scholar]
- 5.Button DC, Gardiner K, Marqueste T, Gardiner PF. Frequency-current relationships of rat hindlimb alpha-motoneurones. J Physiol 573: 663–677, 2006. doi: 10.1113/jphysiol.2006.107292. [DOI] [PMC free article] [PubMed] [Google Scholar]
- 6.Celichowski J, Drzymała-Celichowska H. The number of motor units in the medial gastrocnemius muscle of male and female rats. J Physiol Pharmacol 58: 821–828, 2007. [PubMed] [Google Scholar]
- 7.Chen XY, Wolpaw JR. Triceps surae motoneuron morphology in the rat: a quantitative light microscopic study. J Comp Neurol 343: 143–157, 1994. doi: 10.1002/cne.903430111. [DOI] [PubMed] [Google Scholar]
- 8.Close RI. Dynamic properties of mammalian skeletal muscles. Physiol Rev 52: 129–197, 1972. doi: 10.1152/physrev.1972.52.1.129. [DOI] [PubMed] [Google Scholar]
- 9.Cui L, Perreault EJ, Maas H, Sandercock TG. Modeling short-range stiffness of feline lower hindlimb muscles. J Biomech 41: 1945–1952, 2008. doi: 10.1016/j.jbiomech.2008.03.024. [DOI] [PMC free article] [PubMed] [Google Scholar]
- 10.Cullheim S, Fleshman JW, Glenn LL, Burke RE. Membrane area and dendritic structure in type-identified triceps surae alpha motoneurons. J Comp Neurol 255: 68–81, 1987. doi: 10.1002/cne.902550106. [DOI] [PubMed] [Google Scholar]
- 11.Cullheim S, Fleshman JW, Glenn LL, Burke RE. Three-dimensional architecture of dendritic trees in type-identified alpha-motoneurons. J Comp Neurol 255: 82–96, 1987. doi: 10.1002/cne.902550107. [DOI] [PubMed] [Google Scholar]
- 12.De Serres SJ, Yang JF, Patrick SK. Mechanism for reflex reversal during walking in human tibialis anterior muscle revealed by single motor unit recording. J Physiol 488: 249–258, 1995. doi: 10.1113/jphysiol.1995.sp020963. [DOI] [PMC free article] [PubMed] [Google Scholar]
- 13.Delgado-Lezama R, Perrier JF, Nedergaard S, Svirskis G, Hounsgaard J. Metabotropic synaptic regulation of intrinsic response properties of turtle spinal motoneurones. J Physiol 504: 97–102, 1997. doi: 10.1111/j.1469-7793.1997.097bf.x. [DOI] [PMC free article] [PubMed] [Google Scholar]
- 14.Devlin A-C, Burr K, Borooah S, Foster JD, Cleary EM, Geti I, Vallier L, Shaw CE, Chandran S, Miles GB. Human iPSC-derived motoneurons harbouring TARDBP or C9ORF72 ALS mutations are dysfunctional despite maintaining viability. Nat Commun 6: 5999, 2015. doi: 10.1038/ncomms6999. [DOI] [PMC free article] [PubMed] [Google Scholar]
- 15.Duchateau J, Enoka RM. Human motor unit recordings: origins and insight into the integrated motor system. Brain Res 1409: 42–61, 2011. doi: 10.1016/j.brainres.2011.06.011. [DOI] [PubMed] [Google Scholar]
- 16.Fuglevand AJ, Macefield VG, Bigland-Ritchie B. Force-frequency and fatigue properties of motor units in muscles that control digits of the human hand. J Neurophysiol 81: 1718–1729, 1999. doi: 10.1152/jn.1999.81.4.1718. [DOI] [PubMed] [Google Scholar]
- 17.Gorassini M, Eken T, Bennett DJ, Kiehn O, Hultborn H. Activity of hindlimb motor units during locomotion in the conscious rat. J Neurophysiol 83: 2002–2011, 2000. doi: 10.1152/jn.2000.83.4.2002. [DOI] [PubMed] [Google Scholar]
- 18.Gossen ER, Ivanova TD, Garland SJ. The time course of the motoneurone afterhyperpolarization is related to motor unit twitch speed in human skeletal muscle. J Physiol 552: 657–664, 2003. doi: 10.1113/jphysiol.2003.048132. [DOI] [PMC free article] [PubMed] [Google Scholar]
- 19.Grimby L. Firing properties of single human motor units during locomotion. J Physiol 346: 195–202, 1984. doi: 10.1113/jphysiol.1984.sp015016. [DOI] [PMC free article] [PubMed] [Google Scholar]
- 20.Gustafsson B, Pinter MJ. An investigation of threshold properties among cat spinal alpha-motoneurones. J Physiol 357: 453–483, 1984. doi: 10.1113/jphysiol.1984.sp015511. [DOI] [PMC free article] [PubMed] [Google Scholar]
- 21.Hamm TM, Turkin VV, Bandekar NK, O’Neill D, Jung R. Persistent currents and discharge patterns in rat hindlimb motoneurons. J Neurophysiol 104: 1566–1577, 2010. doi: 10.1152/jn.00380.2010. [DOI] [PMC free article] [PubMed] [Google Scholar]
- 22.Hardesty I. Obeservations on the medulla spinalis of the elephant with some comparative studies of the intumescneita cervicalis and the neurones of the coliuman anterior. J Comp Neurol 12: 125–182, 1902. doi: 10.1002/cne.910120203. [DOI] [Google Scholar]
- 23.Heckman CJ, Enoka RM. Motor unit. Compr Physiol 2: 2629–2682, 2012. . [DOI] [PubMed] [Google Scholar]
- 24.Heckman CJ, Johnson MD. Reconfiguration of the electrical properties of motoneurons to match the diverse demands of motor behavior. Adv Exp Med Biol 826: 33–40, 2014. doi: 10.1007/978-1-4939-1338-1_3. [DOI] [PubMed] [Google Scholar]
- 25.Heckman CJ, Weytjens JLF, Loeb GE. Effect of velocity and mechanical history on the forces of motor units in the cat medial gastrocnemius muscle. J Neurophysiol 68: 1503–1515, 1992. doi: 10.1152/jn.1992.68.5.1503. [DOI] [PubMed] [Google Scholar]
- 26.Hegedus J, Putman CT, Tyreman N, Gordon T. Preferential motor unit loss in the SOD1 G93A transgenic mouse model of amyotrophic lateral sclerosis. J Physiol 586: 3337–3351, 2008. doi: 10.1113/jphysiol.2007.149286. [DOI] [PMC free article] [PubMed] [Google Scholar]
- 27.Henneman E, Mendell LM. Functional organization of motoneuron pool and its inputs. In: Handbook of Physiology. The Nervous System. Motor Control. Bethesda, MD: Am. Physiol. Soc., 1981, sect. 1, vol. II, pt. 2, chapt. 11, p. 423–507. [Google Scholar]
- 28.Hennig R, Lømo T. Firing patterns of motor units in normal rats. Nature 314: 164–166, 1985. doi: 10.1038/314164a0. [DOI] [PubMed] [Google Scholar]
- 29.Hoffer JA, Sugano N, Loeb GE, Marks WB, O’Donovan MJ, Pratt CA. Cat hindlimb motoneurons during locomotion. II. Normal activity patterns. J Neurophysiol 57: 530–553, 1987. doi: 10.1152/jn.1987.57.2.530. [DOI] [PubMed] [Google Scholar]
- 30.Holstege JC, Kuypers HG. Brainstem projections to spinal motoneurons: an update. Neuroscience 23: 809–821, 1987. doi: 10.1016/0306-4522(87)90160-6. [DOI] [PubMed] [Google Scholar]
- 31.Hounsgaard J, Hultborn H, Jespersen B, Kiehn O. Bistability of alpha-motoneurones in the decerebrate cat and in the acute spinal cat after intravenous 5-hydroxytryptophan. J Physiol 405: 345–367, 1988. doi: 10.1113/jphysiol.1988.sp017336. [DOI] [PMC free article] [PubMed] [Google Scholar]
- 32.Hounsgaard J, Kiehn O. Serotonin-induced bistability of turtle motoneurones caused by a nifedipine-sensitive calcium plateau potential. J Physiol 414: 265–282, 1989. doi: 10.1113/jphysiol.1989.sp017687. [DOI] [PMC free article] [PubMed] [Google Scholar]
- 33.Huh S, Siripuram R, Lee RH, Turkin VV, O’Neill D, Hamm TM, Heckman CJ, Manuel M. PICs in motoneurons do not scale with the size of the animal: a possible mechanism for faster speed of muscle contraction in smaller species. J Neurophysiol 118: 93–102, 2017. doi: 10.1152/jn.00045.2017. [DOI] [PMC free article] [PubMed] [Google Scholar]
- 34.Hultborn H, Zhang M, Meehan CF. Control and role of plateau potential properties in the spinal cord. Curr Pharm Des 19: 4357–4370, 2013. doi: 10.2174/1381612811319240004. [DOI] [PubMed] [Google Scholar]
- 35.Iglesias C, Meunier C, Manuel M, Timofeeva Y, Delestrée N, Zytnicki D. Mixed mode oscillations in mouse spinal motoneurons arise from a low excitability state. J Neurosci 31: 5829–5840, 2011. doi: 10.1523/JNEUROSCI.6363-10.2011. [DOI] [PMC free article] [PubMed] [Google Scholar]
- 36.Jenny AB, Inukai J. Principles of motor organization of the monkey cervical spinal cord. J Neurosci 3: 567–575, 1983. doi: 10.1523/JNEUROSCI.03-03-00567.1983. [DOI] [PMC free article] [PubMed] [Google Scholar]
- 36a.Jensen B, Stecina DK, Wienecke J, Hedegaard A, Sukiasyan N, Hultborn H, Meehan CF. The subprimary range of firing is present in both cat and mouse spinal motoneurons and its relationship to force development is similar for the two species. J Neurosci 38: 9741–9753, 2018. doi: 10.1523/JNEUROSCI.2898-17.2018. [DOI] [PMC free article] [PubMed] [Google Scholar]
- 37.Johnson MD, Thompson CK, Tysseling VM, Powers RK, Heckman CJ. The potential for understanding the synaptic organization of human motor commands via the firing patterns of motoneurons. J Neurophysiol 118: 520–531, 2017. doi: 10.1152/jn.00018.2017. [DOI] [PMC free article] [PubMed] [Google Scholar]
- 38.Kadhiresan VA, Hassett CA, Faulkner JA. Properties of single motor units in medial gastrocnemius muscles of adult and old rats. J Physiol 493: 543–552, 1996. doi: 10.1113/jphysiol.1996.sp021402. [DOI] [PMC free article] [PubMed] [Google Scholar]
- 39.Kan HE, Buse-Pot TE, Peco R, Isbrandt D, Heerschap A, de Haan A. Lower force and impaired performance during high-intensity electrical stimulation in skeletal muscle of GAMT-deficient knockout mice. Am J Physiol Cell Physiol 289: C113–C119, 2005. doi: 10.1152/ajpcell.00040.2005. [DOI] [PubMed] [Google Scholar]
- 40.Kernell D. The Motoneurone and Its Muscle Fibres. Oxford: Oxford University Press, 2006, p. 360. doi: 10.1093/acprof:oso/9780198526551.001.0001. [DOI] [Google Scholar]
- 41.Kernell D. The repetitive discharge of motoneurones, in Muscular afferents and Motor Control Nobel Symp I, edited by Granit R. Stockholm: Almqvist and Wiksell, 1966, p. 351–362. [Google Scholar]
- 42.Kernell D. Rhythmic properties of motoneurones innervating muscle fibres of different speed in m. gastrocnemius medialis of the cat. Brain Res 160: 159–162, 1979. doi: 10.1016/0006-8993(79)90612-7. [DOI] [PubMed] [Google Scholar]
- 43.Kernell D, Monster AW. Threshold current for repetitive impulse firing in motoneurones innervating muscle fibres of different fatigue sensitivity in the cat. Brain Res 229: 193–196, 1981. doi: 10.1016/0006-8993(81)90756-3. [DOI] [PubMed] [Google Scholar]
- 44.Kernell D, Zwaagstra B. Input conductance axonal conduction velocity and cell size among hindlimb motoneurones of the cat. Brain Res 204: 311–326, 1981. doi: 10.1016/0006-8993(81)90591-6. [DOI] [PubMed] [Google Scholar]
- 45.Krutki P, Celichowski J, Lochyński D, Pogrzebna M, Mrówczyński W. Interspecies differences of motor units properties in the medial gastrocnemius muscle of cat and rat. Arch Ital Biol 144: 11–23, 2006. [PubMed] [Google Scholar]
- 46.Lee RH, Heckman CJ. Adjustable amplification of synaptic input in the dendrites of spinal motoneurons in vivo. J Neurosci 20: 6734–6740, 2000. doi: 10.1523/JNEUROSCI.20-17-06734.2000. [DOI] [PMC free article] [PubMed] [Google Scholar]
- 47.Lee RH, Heckman CJ. Bistability in spinal motoneurons in vivo: systematic variations in persistent inward currents. J Neurophysiol 80: 583–593, 1998. doi: 10.1152/jn.1998.80.2.583. [DOI] [PubMed] [Google Scholar]
- 48.Lee RH, Heckman CJ. Bistability in spinal motoneurons in vivo: systematic variations in rhythmic firing patterns. J Neurophysiol 80: 572–582, 1998. doi: 10.1152/jn.1998.80.2.572. [DOI] [PubMed] [Google Scholar]
- 49.Lee RH, Heckman CJ. Paradoxical effect of QX-314 on persistent inward currents and bistable behavior in spinal motoneurons in vivo. J Neurophysiol 82: 2518–2527, 1999. doi: 10.1152/jn.1999.82.5.2518. [DOI] [PubMed] [Google Scholar]
- 50.MacGregor RJ, Tajchman G. Theory of dynamic similarity in neuronal systems. J Neurophysiol 60: 751–768, 1988. doi: 10.1152/jn.1988.60.2.751. [DOI] [PubMed] [Google Scholar]
- 51.Major LA, Hegedus J, Weber DJ, Gordon T, Jones KE. Method for counting motor units in mice and validation using a mathematical model. J Neurophysiol 97: 1846–1856, 2007. doi: 10.1152/jn.00904.2006. [DOI] [PubMed] [Google Scholar]
- 52.Manuel M, Heckman CJ. Adult mouse motor units develop almost all of their force in the subprimary range: a new all-or-none strategy for force recruitment? J Neurosci 31: 15188–15194, 2011. doi: 10.1523/JNEUROSCI.2893-11.2011. [DOI] [PMC free article] [PubMed] [Google Scholar]
- 53.Manuel M, Iglesias C, Donnet M, Leroy F, Heckman CJ, Zytnicki D. Fast kinetics, high-frequency oscillations, and subprimary firing range in adult mouse spinal motoneurons. J Neurosci 29: 11246–11256, 2009. doi: 10.1523/JNEUROSCI.3260-09.2009. [DOI] [PMC free article] [PubMed] [Google Scholar]
- 54.Maratta R, Fenrich KK, Zhao E, Neuber-Hess MS, Rose PK. Distribution and density of contacts from noradrenergic and serotonergic boutons on the dendrites of neck flexor motoneurons in the adult cat. J Comp Neurol 523: 1701–1716, 2015. doi: 10.1002/cne.23765. [DOI] [PubMed] [Google Scholar]
- 55.Martínez-Silva ML, Imhoff-Manuel RD, Sharma A, Heckman CJ, Shneider NA, Roselli F, Zytnicki D, Manuel M. Hypoexcitability precedes denervation in the large fast-contracting motor units in two unrelated mouse models of ALS. eLife 7: e30955, 2018. doi: 10.7554/eLife.30955. [DOI] [PMC free article] [PubMed] [Google Scholar]
- 56.Matthews PB. Properties of human motoneurones and their synaptic noise deduced from motor unit recordings with the aid of computer modelling. J Physiol Paris 93: 135–145, 1999. doi: 10.1016/S0928-4257(99)80144-2. [DOI] [PubMed] [Google Scholar]
- 57.Mayfield DL, Cresswell AG, Lichtwark GA. Effects of series elastic compliance on muscle force summation and the rate of force rise. J Exp Biol 219: 3261–3270, 2016. doi: 10.1242/jeb.142604. [DOI] [PubMed] [Google Scholar]
- 58.Meehan CF, Sukiasyan N, Zhang M, Nielsen JB, Hultborn H. Intrinsic properties of mouse lumbar motoneurons revealed by intracellular recording in vivo. J Neurophysiol 103: 2599–2610, 2010. doi: 10.1152/jn.00668.2009. [DOI] [PubMed] [Google Scholar]
- 59.Milner-Brown HS, Stein RB, Yemm R. The contractile properties of human motor units during voluntary isometric contractions. J Physiol 228: 285–306, 1973. doi: 10.1113/jphysiol.1973.sp010087. [DOI] [PMC free article] [PubMed] [Google Scholar]
- 60.Montague SJ, Fenrich KK, Mayer-Macaulay C, Maratta R, Neuber-Hess MS, Rose PK. Nonuniform distribution of contacts from noradrenergic and serotonergic boutons on the dendrites of cat splenius motoneurons. J Comp Neurol 521: 638–656, 2013. doi: 10.1002/cne.23196. [DOI] [PubMed] [Google Scholar]
- 61.Murray KC, Stephens MJ, Ballou EW, Heckman CJ, Bennett DJ. Motoneuron excitability and muscle spasms are regulated by 5-HT2B and 5-HT2C receptor activity. J Neurophysiol 105: 731–748, 2011. doi: 10.1152/jn.00774.2010. [DOI] [PMC free article] [PubMed] [Google Scholar]
- 62.Powers RK, Binder MD. Input-output functions of mammalian motoneurons. Rev Physiol Biochem Pharmacol 143: 137–263, 2001. doi: 10.1007/BFb0115594. [DOI] [PubMed] [Google Scholar]
- 63.Powers RK, Binder MD. Persistent sodium and calcium currents in rat hypoglossal motoneurons. J Neurophysiol 89: 615–624, 2003. doi: 10.1152/jn.00241.2002. [DOI] [PubMed] [Google Scholar]
- 64.Powers RK, Binder MD, Matthews PBC. Relationship between the time course of the afterhyperpolarization and discharge variability in cat spinal motoneurones. J Physiol 528: 131–150, 2000. doi: 10.1111/j.1469-7793.2000.t01-1-00131.x. [DOI] [PMC free article] [PubMed] [Google Scholar]
- 65.Powers RK, Elbasiouny SM, Rymer WZ, Heckman CJ. Contribution of intrinsic properties and synaptic inputs to motoneuron discharge patterns: a simulation study. J Neurophysiol 107: 808–823, 2012. doi: 10.1152/jn.00510.2011. [DOI] [PMC free article] [PubMed] [Google Scholar]
- 66.Powers RK, Heckman CJ. Contribution of intrinsic motoneuron properties to discharge hysteresis and its estimation based on paired motor unit recordings: a simulation study. J Neurophysiol 114: 184–198, 2015. doi: 10.1152/jn.00019.2015. [DOI] [PMC free article] [PubMed] [Google Scholar]
- 67.Ritter LK, Tresch MC, Heckman CJ, Manuel M, Tysseling VM. Characterization of motor units in behaving adult mice shows a wide primary range. J Neurophysiol 112: 543–551, 2014. doi: 10.1152/jn.00108.2014. [DOI] [PMC free article] [PubMed] [Google Scholar]
- 68.Sengul G, Watson C, Tanaka I, Paxinos G. Atlas of the Spinal Cord. Amsterdam, The Netherlands: Elsevier Academic Press, 2013. [Google Scholar]
- 69.Suresh AK, Hu X, Powers RK, Heckman CJ, Suresh NL, Rymer WZ. Changes in motoneuron afterhyperpolarization duration in stroke survivors. J Neurophysiol 112: 1447–1456, 2014. doi: 10.1152/jn.01091.2012. [DOI] [PMC free article] [PubMed] [Google Scholar]
- 70.Tadros MA, Lim R, Hughes DI, Brichta AM, Callister RJ. Electrical maturation of spinal neurons in the human fetus: comparison of ventral and dorsal horn. J Neurophysiol 114: 2661–2671, 2015. doi: 10.1152/jn.00682.2015. [DOI] [PMC free article] [PubMed] [Google Scholar]
- 71.Thompson CK, Negro F, Johnson MD, Holmes MR, McPherson LM, Powers RK, Farina D, Heckman CJ. Robust and accurate decoding of motoneuron behaviour and prediction of the resulting force output. J Physiol 596: 2643–2659, 2018. doi: 10.1113/JP276153. [DOI] [PMC free article] [PubMed] [Google Scholar]
- 72.Turkin VV, O’Neill D, Jung R, Iarkov A, Hamm TM. Characteristics and organization of discharge properties in rat hindlimb motoneurons. J Neurophysiol 104: 1549–1565, 2010. doi: 10.1152/jn.00379.2010. [DOI] [PMC free article] [PubMed] [Google Scholar]
- 73.Ulfhake B. A morphometric study of the soma, first-order dendrites and proximal axon of cat lumbar alpha-motoneurones intracellularly labelled with HRP. Exp Brain Res 56: 327–334, 1984. doi: 10.1007/BF00236288. [DOI] [PubMed] [Google Scholar]
- 74.Vincent JA, Gabriel HM, Deardorff AS, Nardelli P, Fyffe REW, Burkholder T, Cope TC. Muscle proprioceptors in adult rat: mechanosensory signaling and synapse distribution in spinal cord. J Neurophysiol 118: 2687–2701, 2017. doi: 10.1152/jn.00497.2017. [DOI] [PMC free article] [PubMed] [Google Scholar]
- 75.Wei K, Glaser JI, Deng L, Thompson CK, Stevenson IH, Wang Q, Hornby TG, Heckman CJ, Kording KP. Serotonin affects movement gain control in the spinal cord. J Neurosci 34: 12690–12700, 2014. doi: 10.1523/JNEUROSCI.1855-14.2014. [DOI] [PMC free article] [PubMed] [Google Scholar]
- 76.Zagoraiou L, Akay T, Martin JF, Brownstone RM, Jessell TM, Miles GB. A cluster of cholinergic premotor interneurons modulates mouse locomotor activity. Neuron 64: 645–662, 2009. doi: 10.1016/j.neuron.2009.10.017. [DOI] [PMC free article] [PubMed] [Google Scholar]
- 77.Zengel JE, Reid SA, Sypert GW, Munson JB. Membrane electrical properties and prediction of motor-unit type of medial gastrocnemius motoneurons in the cat. J Neurophysiol 53: 1323–1344, 1985. doi: 10.1152/jn.1985.53.5.1323. [DOI] [PubMed] [Google Scholar]
- 78.Zwaagstra B, Kernell D. Sizes of soma and stem dendrites in intracellularly labelled alpha-motoneurones of the cat. Brain Res 204: 295–309, 1981. doi: 10.1016/0006-8993(81)90590-4. [DOI] [PubMed] [Google Scholar]