Abstract
In this study, the effect of lung volume on quantitative measures of lung ventilation was investigated using MRI with hyperpolarized 3He and 129Xe. Six volunteers were imaged with hyperpolarized 3He at five different lung volumes [residual volume (RV), RV + 1 liter (1L), functional residual capacity (FRC), FRC + 1L, and total lung capacity (TLC)], and three were also imaged with hyperpolarized 129Xe. Imaging at each of the lung volumes was repeated twice on the same day with corresponding 1H lung anatomical images. Percent lung ventilated volume (%VV) and variation of signal intensity [heterogeneity score (Hscore)] were evaluated. Increased ventilation heterogeneity, quantified by reduced %VV and increased Hscore, was observed at lower lung volumes with the least ventilation heterogeneity observed at TLC. For 3He MRI data, the coefficient of variation of %VV was <1.5% and <5.5% for Hscore at all lung volumes, while for 129Xe data the values were 4 and 10%, respectively. Generally, %VV generated from 129Xe images was lower than that seen from 3He images. The good repeatability of 3He %VV found here supports prior publications showing that percent lung-ventilated volume is a robust method for assessing global lung ventilation. The greater ventilation heterogeneity observed at lower lung volumes indicates that there may be partial airway closure in healthy lungs and that lung volume should be carefully considered for reliable longitudinal measurements of %VV and Hscore. The results suggest that imaging patients at different lung volumes may help to elucidate obstructive disease pathophysiology and progression.
NEW & NOTEWORTHY We present repeatability data of quantitative metrics of lung function derived from hyperpolarized helium-3, xenon-129, and proton anatomical images acquired at five lung volumes in volunteers. Increased regional ventilation heterogeneity at lower lung inflation levels was observed in the lungs of healthy volunteers.
Keywords: hyperpolarized gas, imaging, inflation, lungs, MRI
INTRODUCTION
Hyperpolarized (HP) gas ventilation-weighed magnetic resonance imaging (MRI) allows the visualization of gas distribution within the lung and has been shown to detect early lung disease in patients with cystic fibrosis and normal spirometry (4, 19) and in the lungs of smokers (33). Additionally, it has been used to assess the response to treatment in patients with asthma (13, 29) to longitudinally assess patients with chronic obstructive pulmonary disease (17) and has been shown to be clinically feasible for assessing lung function in children (1).
HP gas and proton anatomical (1H) lung magnetic resonance imaging (MRI) can be combined to quantify lung ventilation using percent lung-ventilated volume (%VV) or its counterpart the ventilation defect percentage (33), both of which have been widely adopted as simple and robust image-derived metrics. %VV is the ratio of the ventilated lung, defined from HP gas ventilation-weighted images to the thoracic cavity volume, defined from the 1H anatomical images (16, 33). Previous work has shown improved repeatability of %VV when the anatomical image is acquired in the same breath-hold as the HP gas ventilation-weighted image (12).
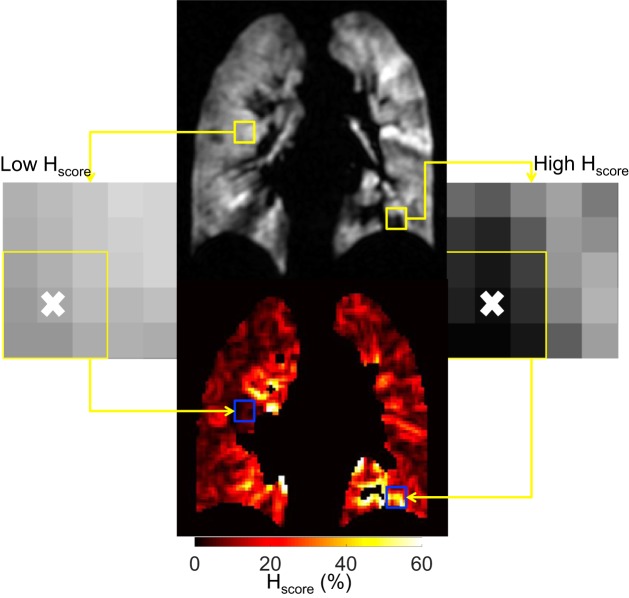
Ventilation heterogeneity may be assessed by using the Hscore metric developed by Tzeng et al. (31), which calculates the variation of signal intensity in a kernel around a given voxel as the standard deviation divided by the mean (e.g., Fig. 1) (23, 31).
Fig. 1.
Example of local heterogeneity score (Hscore) calculation in the residual volume + 1 liter ventilation-weighted image of volunteer 5 (top). The yellow box on the left shows an area of low Hscore (enhanced image on the left, with the local area outlined and the voxel that is replaced denoted with an “x”), which is highlighted with the blue box in the Hscore map (bottom). The same is shown for a region of high Hscore on the right.
The clinical standard for assessing lung volumes is body plethysmography (22, 32), while changes in forced expiratory volume in 1 s (FEV1) and forced vital capacity, measured using spirometry, are used as clinical markers for lung function decline in certain diseases (22, 32). However, patient coaching of inhalation from a bag of gas rather than spirometric gating is generally used to achieve the lung volumes for HP gas MR imaging, which may lead to variability in lung volumes as will the ability of the patient to inhale the entire contents of the bag of gas being used. The most frequently used lung volume is functional residual capacity plus 1 liter (FRC + 1L) (6–8, 16, 18, 27, 34). However, if a 1-liter bag is inhaled from FRC in smaller patients, this volume may be close to total lung capacity (TLC); thus understanding the effect of lung inflation level on these image-derived metrics is important.
Previous work by Muradyan et al. (23) analyzed the effect of inhalation of HP xenon-129 (129Xe) from residual volume (RV) in healthy volunteers and sub-RV in elite divers by acquiring coronal projection images with an in-plane resolution of 4.7 × 9.4 mm. Muradyan et al. calculated the global Hscore in the ventilated regions of the image and found that when the elite divers inhaled low volumes of gas (0.9 and 0.4 liters, respectively) compared with larger volumes of gas (1.3 and 0.9 liters, respectively) from sub-RV, increased heterogeneity was seen in the images, consistent with punctate reopening of some airways that were closed at sub-RV. Marshall et al. (20) carried out preliminary work demonstrating the effect of airway opening between FRC + 1L and TLC using HP 3He imaging showing decreased heterogeneity and increased %VV at TLC when compared with FRC + 1L. With these studies demonstrating important mechanisms at work in healthy controls and patients, it is clear that understanding the effect of lung inflation on quantitative metrics derived from HP gas and 1H anatomical MRI is an important step in moving these techniques forward into standard clinical practice.
Historically, noble gas MRI studies have made use of HP helium-3 (3He); however, with the rising cost and scarcity of 3He, the focus of the pulmonary imaging community is switching to the use of HP 129Xe (18, 27) where differences in metrics have been reported due to the differences in diffusivity and the achievable signal of 129Xe MRI. Thus the aims of this study were to use both HP 3He and 129Xe MRI to 1) assess the effect of different lung inflation levels on the HP gas image-derived metrics %VV and Hscore; and 2) assess the repeatability of %VV and Hscore from two same-day imaging sessions.
MATERIALS AND METHODS
Subjects.
The study was performed with national research ethics committee approval and with written informed consent from all volunteers. Six volunteers (all men) were recruited for this study with the only criterion being that subjects were suitable for MRI and had no known respiratory complications. Two volunteers were former smokers, two were occasional smokers, and two were never smokers. Table 1 shows the subject demographics.
Table 1.
Subject demographics
| Subject | Age, yr | Height, cm | Weight, kg | FEV1 | Pack Years |
|---|---|---|---|---|---|
| V1 | 32 | 183.0 | 87.0 | 102.0 | 0.15 |
| V2 | 35 | 184.0 | 76.0 | 77.2 | 0.13 |
| V3 | 31 | 182.0 | 83.0 | 105.0 | 0.06 |
| V4 | 34 | 185.6 | 94.0 | 83.6 | 0.70 |
| V5 | 27 | 189.5 | 74.0 | 102.9 | 0 |
| V6 | 28 | 187.6 | 90.0 | 99.9 | 0 |
V, volunteer; FEV1, forced expiratory volume in 1 s %predicted.
Study protocol.
Spirometry was performed to international standards (32) to ensure subjects were defined as spirometrically free from respiratory conditions.
All 3He imaging was carried out on a GE HDx 1.5T MRI scanner (GE Healthcare, Milwaukee, WI) using a 3He transmit-receive flexible chest coil (Clinical MR Solutions, Brookfield, WI). 3He was polarized using a commercial polarizer (GE Healthcare, Amersham, UK). HP 3He 3D-balanced steady-state free precession and 1H spoiled gradient echo images were acquired in the same breath (12) at five different lung volumes: RV, RV + 1 liter (1L), FRC, FRC + 1L, and TLC. For 129Xe imaging, the gas was polarized using a home-built polarizer (24) and images were acquired using a 129Xe transmit-receive flexible vest coil (Clinical MR Solutions) and the 1H system body coil at five different lung volumes, as with 3He imaging. 129Xe and 1H images were acquired in separate breath-holds as previously described (27, 28), and this was due to the longer acquisition time of the 129Xe scan. Note that only a subset of the volunteers (V2, V3, and V6) were scanned using HP 129Xe and separate-breath 1H imaging as a feasibility study as some participants were no longer available to be scanned. A 1-liter mixture of hyperpolarized gas and nitrogen was used as it is the most commonly used volume in adults (6–8, 16, 18, 27, 34).
For the breathing maneuvers (Fig. 2), volunteers were coached and instructed to breathe within the scanner by a pulmonary physiologist. During imaging, breathing maneuvers started with inhalation of the contents of the 1-liter bag from FRC, except for imaging at RV + 1L where volunteers first exhaled to RV. To acquire images at TLC, volunteers inhaled room air to maximum lung capacity after the inhalation of 1-liter of gas from the bag. For imaging at FRC, volunteers inhaled the contents of the 1-liter bag from FRC and then exhaled back to FRC. For RV imaging, volunteers inhaled the contents of the 1-liter bag from FRC and then exhaled to RV. Gas doses were increased for the exhalation maneuvers and for imaging at TLC with the aim of ensuring sufficient signal for imaging, and before exhalation participants held their breath for 5 s to allow the gas to diffuse into the peripheral lung. Inhaled gas doses are given in Table 2; note that images were also acquired in the order presented in Table 2.
Fig. 2.
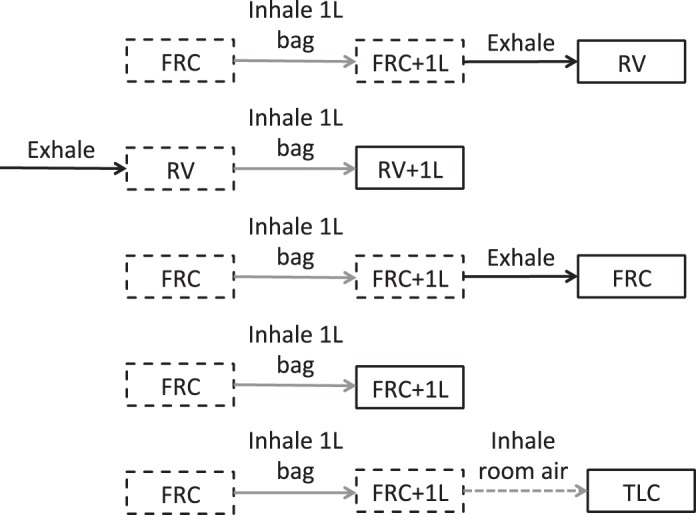
Breathing maneuvers and acquisition volumes used in this study. Solid gray lines indicate an inhalation from a 1-liter bag, solid black lines indicate an exhalation and dashed gray lines indicate an inhalation of room air. Solid boxes represent acquisition volumes and dashed boxes represent intermediate volumes as part of the breathing maneuver. RV, residual volume; RV + 1L, residual volume plus 1 liter of gas mixture; FRC, functional residual capacity; FRC + 1L, functional residual capacity volume plus 1 liter of gas mixture; TLC, total lung capacity.
Table 2.
Gas doses for HP 3He and 129Xe acquisitions reported as HP gas dose (N2)
| Acquisition | 3He (N2), ml | 129Xe (N2), ml |
|---|---|---|
| RV | 200 (800) | 1000 (0) |
| RV + 1L | 150 (850) | 750 (250) |
| FRC | 200 (800) | 1000 (0) |
| FRC + 1L | 150 (850) | 600 (400) |
| TLC | 200 (800) | 750 (250) |
RV, residual volume; RV + 1L, residual volume plus 1 liter of gas mixture; FRC, functional residual capacity; FRC + 1L, functional residual capacity volume plus 1 liter of gas mixture; TLC, total lung capacity; N2, nitrogen; 3He, helium-3; 29Xe, xenon-129; HP, hyperpolarized.
For 3He acquisitions, subjects were scanned twice on the same day, with a 10- to 20-min break (remaining supine within the scanner) in between imaging sessions. 3He imaging sessions lasted 20–30 min on average. For 129Xe imaging, subjects were scanned twice on the same day, with a 20- to 40-min break between imaging sessions and were removed from the scanner during this break. 129Xe imaging sessions lasted 35–45 min on average, due to limitations imposed by gas polarization time.
Image analysis.
Thoracic cavity volume (TCV) and ventilated volume (VV) were extracted from the 1H anatomical and HP gas ventilation images, respectively, using the semiautomated segmentation method based on spatial Fuzzy C-means thresholding previously described (15). Percent lung-ventilated volume was calculated according to %VV = (VV/TCV × 100).
Ventilation heterogeneity was assessed using a modified version of the Hscore method previously described (31). Images were subsampled from 256 × 256 voxels in-plane to 128 × 128 voxels, resulting in an apparent image resolution of ~3.2 × 3.2 × 5 mm for 3He images or ~3.2 × 3.2 × 10 mm for 129Xe images. To avoid partial volume effects at the edge of the ventilation-weighted images, the TCV mask was eroded by one pixel, and the ventilation-weighted image was then multiplied by the VV mask and eroded TCV masks, with voxels outside of the VV and TCV masks being excluded from the local heterogeneity calculation. To generate maps of ventilation heterogeneity, a 3 × 3 voxel kernel (~9 × 9 mm) was then passed over the images, centered on every voxel in the ventilated volume, to calculate the local variation of signal intensity (Hi,j,k at voxel i,j,k). Hscore in this work was then defined as the median of the non-zero values of the local heterogeneity map rather than the mean as previously reported, as the histograms of Hscore were not normally distributed. For images acquired at TLC, where there was clear signal dropout due to coil sensitivity coverage, VV and TCV masks were matched, i.e., where signal dropout occurred emulating a defect it was manually excluded on both the TCV and VV masks, to ensure that this did not cause increased Hscore and decreased %VV.
Additionally, the mean Hscore of the most posterior slice was compared with the mean Hscore of the remaining image slices for each volunteer at each inflation level for the data acquired with 3He. The mean values were grouped by volunteer and lung volume, and significant differences were assessed using either a paired t-test or Wilcoxon matched-pairs signed rank test depending on the normality of the data. This analysis was not carried out for 129Xe data due to the reduced number of subjects.
Repeatability and statistical analysis.
To assess the repeatability of %VV and Hscore between session 1 and session 2, the coefficient of variation (CoV), Bland-Altman analysis (2), paired t-tests, and the repeatability limit were used. For CoV analysis, values were grouped by inflation level and session e.g., RV session 1 for all volunteers was compared with RV session 2 for all volunteers. Additionally, to assess repeatability in the image domain, voxel-wise correlation (25) was carried out where each of the six same-inflation intersession image pairs were spatially aligned via deformable image registration (3) to facilitate computation of Spearman correlation coefficients as previously described (30). The repeatability limit was calculated as , where sw is the within-subjects standard deviation calculated using SPSS (version 23, IBM) (21).
Spearman’s correlation was also used to assess the relationship between TCV and %VV and Hscore along with the relationship between TCV and the absolute change of %VV and Hscore over the two imaging sessions. Finally, a two-way repeated measures ANOVA was performed to statistically validate the effect of lung volume on Hscore and %VV where within subject factors were defined as the imaging session and lung inflation level, and multiple comparisons were carried out using the Tukey correction. Voxel-wise correlation and two-way repeated measures ANOVA were not carried out for the 129Xe data due to the reduced number of subjects scanned.
RESULTS
Comparison of HP 129Xe and HP 3He MRI at different inflation levels.
The signal-to-noise ratio (SNR) of the 129Xe images was lower than the SNR of the 3He images, particularly at RV, RV + 1L, and FRC, as can be seen in Fig. 3. The RV image of HV3 (129Xe, session 2) had complete loss of signal from posterior sections of the lung due to a coil sensitivity issue at the time of the experiment and was thus excluded from analysis. 129Xe images had consistently lower %VV (P < 0.0001) and higher Hscore (P < 0.0001) when compared with those obtained with HP 3He (Tables 3 and 4).
Fig. 3.
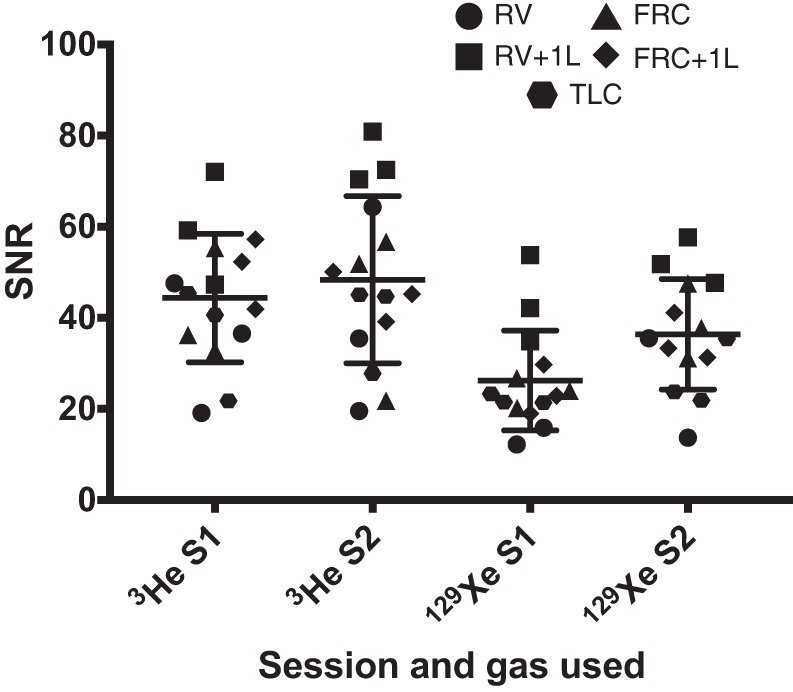
Signal-to-noise ratio (SNR) values from the volunteers scanned with both 3He and 129Xe only. RV, residual volume; RV + 1L, residual volume plus 1 liter of gas mixture; FRC, functional residual capacity; FRC + 1L, functional residual capacity volume plus 1 liter of gas mixture; TLC, total lung capacity.
Table 3.
Mean %VV and median Hscore values at each lung volume and S1/S2 over all volunteers derived from hyperpolarized 3He and 129Xe
| RV S1 | RV S2 | RV + 1L S1 | RV + 1L S2 | FRC S1 | FRC S2 | FRC + 1L S1 | FRC + 1L S2 | TLC S1 | TLC S2 | |
|---|---|---|---|---|---|---|---|---|---|---|
| %VV 3He | 95.65 | 97.17 | 97.39 | 97.84 | 97.30 | 97.80 | 98.18 | 98.05 | 97.33 | 97.98 |
| Hscore 3He | 10.47 | 9.98 | 10.12 | 10.1 | 9.37 | 9.23 | 9.10 | 9.20 | 7.55 | 7.39 |
| %VV 129Xe | 82.94 | 87.43 | 92.36 | 90.86 | 93.53 | 94.99 | 92.99 | 96.55 | 95.83 | 94.98 |
| Hscore 129Xe | 15.89 | 14.92 | 11.51 | 12.29 | 10.83 | 10.99 | 11.09 | 10.53 | 8.71 | 8.24 |
RV, residual volume; RV + 1L, residual volume plus 1 liter of gas mixture; FRC, functional residual capacity; FRC + 1L, functional residual capacity volume plus 1 liter of gas mixture; TLC, total lung capacity; 3He, helium-3; 29Xe, xenon-129; HP, hyperpolarized; %VV, percent lung ventilated volume; S, session; Hscore, local heterogeneity score.
Table 4.
Average %VV and median Hscore values over sessions 1 and 2 generated from hyperpolarized 3He and 129Xe images for the three volunteers scanned with both gases
| 3He V2 | 129Xe V2 | 3He V3 | 129Xe V3 | 3He V6 | 129Xe V6 | |
|---|---|---|---|---|---|---|
| Acquisition, %VV | ||||||
| RV | 98.68 | 96.26 | 97.03 | NA | 95.41 | 88.88 |
| RV + 1L | 97.67 | 90.46 | 99.49 | 91.54 | 98.26 | 92.84 |
| FRC | 98.85 | 97.53 | 98.34 | 94.41 | 97.85 | 90.85 |
| FRC + 1L | 98.46 | 96.70 | 98.76 | 94.51 | 98.10 | 93.11 |
| TLC | 99.46 | 95.58 | 99.12 | 93.14 | 97.82 | 97.50 |
| Acquisition, Hscore | ||||||
| RV | 8.96 | 12.53 | 11.63 | NA | 10.16 | 16.16 |
| RV + 1L | 10.26 | 12.08 | 8.82 | 11.74 | 9.04 | 11.89 |
| FRC | 8.85 | 11.01 | 9.15 | 10.91 | 8.90 | 10.82 |
| FRC + 1L | 9.33 | 10.83 | 8.61 | 10.62 | 8.59 | 10.98 |
| TLC | 6.15 | 8.10 | 7.33 | 8.95 | 6.50 | 8.38 |
RV, residual volume; RV + 1L, residual volume plus 1 liter of gas mixture; FRC, functional residual capacity; FRC + 1L, functional residual capacity volume plus 1 liter of gas mixture; TLC, total lung capacity; V, volunteer; %VV, percent lung ventilated volume; Hscore, local heterogeneity score.
The effect of lung inflation level on %VV and Hscore.
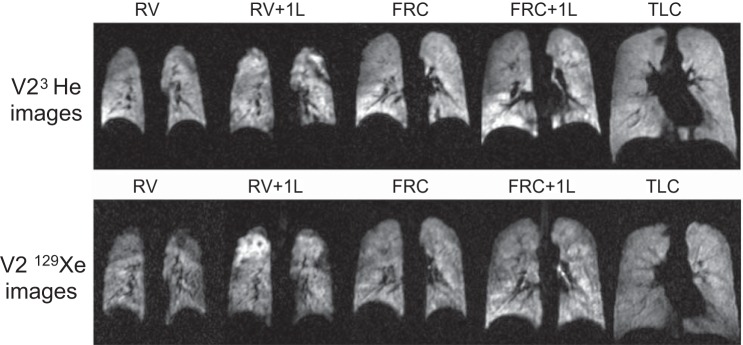
The effect of lung inflation level on 3He and 129Xe images acquired at different lung volumes is shown in Fig. 4 for volunteer 2. There was a trend toward increased ventilation homogeneity at higher lung volumes, which was seen using both gases. For 3He data, significant differences between Hscore were found when TLC was compared to all other lung volumes via the two-way ANOVA (P < 0.0001 for all). No other significant differences in Hscore between different inflation levels were found.
Fig. 4.
Representative slices from all acquisition volumes in volunteer 2 (V2) from both 3He and 129Xe images. Top row: 3He images; bottom row: 129Xe images. RV, residual volume; RV + 1L, residual volume plus 1 liter of gas mixture; FRC, functional residual capacity; FRC + 1L, functional residual capacity volume plus 1 liter of gas mixture; TLC, total lung capacity.
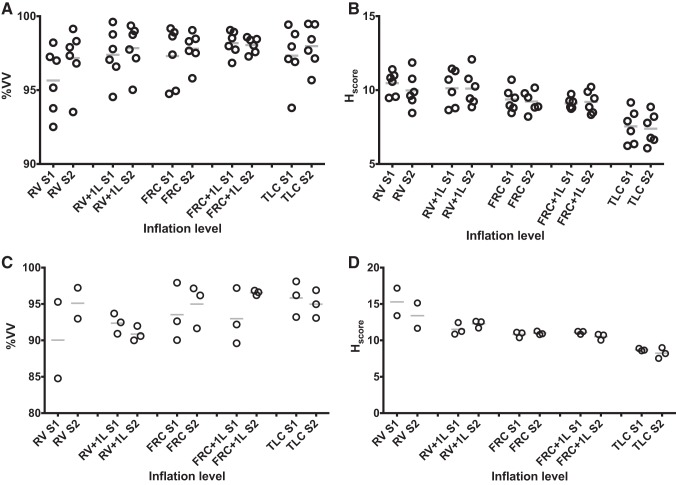
%VV also varied with lung volume as can be seen from the mean values of %VV and Hscore shown in Table 4, which are visualized in Fig. 5. For 3He data, %VV at RV and FRC + 1L were the only volumes that were significantly different from each other when compared using the two-way ANOVA (P = 0.0155). Lung volume had a significant effect on both %VV (P = 0.0265) and Hscore (P < 0.0001).
Fig. 5.
Plots of percent lung-ventilated volume (A) from 3He data, heterogeneity score (Hscore; %; B) from 3He data, percent lung-ventilated volume from 129Xe data (C), and Hscore (%; D) from 129Xe data at each acquisition volume. Each circle represents a volunteer while the lines represent the mean of the values. RV, residual volume; RV + 1L, residual volume plus 1 liter of gas mixture; FRC, functional residual capacity; FRC + 1L, functional residual capacity volume plus 1 liter of gas mixture; TLC, total lung capacity; %VV, percent venilated volume.
When considering the 1H MRI acquired in the same breath as 3He MRI, TCV generated from the 1H images correlated strongly with Hscore (r = −0.75, P < 0.0001) but not with %VV (r = 0.27, P = 0.15). TCV had a weak correlation with the absolute change in %VV (r = −0.39, P = 0.03) but not Hscore (r = 0.01, P = 0.53). For the 1H MRI acquired in a separate breath to the 129Xe MRI, TCV had a strong correlation with Hscore (r = −0.90, P < 0.0001) and a moderate correlation with the absolute change of Hscore over the two sessions (r = −0.66, P = 0.01). TCV had no significant correlation with %VV or the absolute change in %VV over both sessions (r = 0.44, P = 0.12 and r = −0.33, P = 0.25 respectively).
Regardless of the acquisition volume increased Hscore was seen in the posterior region of the lung (Fig. 6) with the most posterior slice having a mean ± SD Hscore over all volunteers and inflation levels of 15.4 ± 7.1% while all other slices combined had values of 9.8 ± 3.1% when considering 3He data. Additionally, significant differences between the most posterior slice and the remaining slices (Table 5) of the image were seen at RV + 1L and FRC + 1L (P = 0.0087 and P = 0.031, respectively) while no significant difference was seen at RV, FRC, and TLC (P = 0.1562, P = 0.3125, and P = 0.0790 respectively).
Fig. 6.
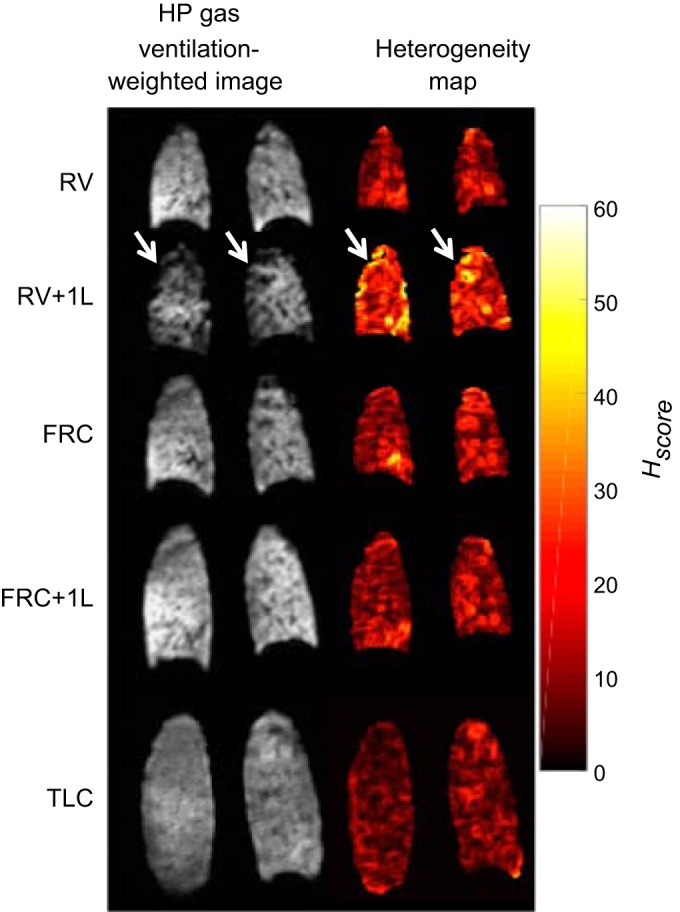
Representative posterior slices of hyperpolarized (HP) 3He ventilation images and heterogeneity maps at all acquisition volumes from volunteer 2 (V2). The arrows are pointing to areas of decreased ventilation and increased heterogeneity score (Hscore). RV, residual volume; RV + 1L, residual volume plus 1 liter of gas mixture; FRC, functional residual capacity; FRC + 1L, functional residual capacity volume plus 1 liter of gas mixture; TLC, total lung capacity.
Table 5.
Mean Hscore (over sessions 1 and 2) at the most posterior slice and all remaining slices for all volunteers at each lung volume for all images acquired using hyperpolarized 3He
| RV |
RV + 1L |
FRC |
FRC + 1L |
TLC |
||||||
|---|---|---|---|---|---|---|---|---|---|---|
| Volunteer | Posterior slice | Remaining slices | Posterior slice | Remaining slices | Posterior slice | Remaining slices | Posterior slice | Remaining slices | Posterior slice | Remaining slices |
| V1 | 14.95 | 11.75 | 21.38 | 12.11 | 23.9 | 12.19 | 21.13 | 10.72 | 17.45 | 10.3 |
| V2 | 12.68 | 9.13 | 23.97 | 11.62 | 15.11 | 9.30 | 23.59 | 10.22 | 9.28 | 6.85 |
| V3 | 8.28 | 11.15 | 18.18 | 8.58 | 5.59 | 9.06 | 10.16 | 8.65 | 7.64 | 7.40 |
| V4 | 20.23 | 10.91 | 17.83 | 10.24 | 18.15 | 10.65 | 20.46 | 10.74 | 25.71 | 9.39 |
| V5 | 9.98 | 10.98 | 27.03 | 11.03 | 5.37 | 9.42 | 9.53 | 9.60 | 8.29 | 8.25 |
| V6 | 15.57 | 11.00 | 9.58 | 9.57 | 11.53 | 9.40 | 13.60 | 9.02 | 27.03 | 7.18 |
RV, residual volume; RV + 1L, residual volume plus 1 liter of gas mixture; 3He, helium-3; V, volunteer; FRC, functional residual capacity.
Repeatability of %VV and Hscore.
Table 6 shows the CoV of %VV and Hscore over all six volunteers at each of the lung volumes imaged with 3He and over all three volunteers imaged with 129Xe. For 3He data, CoV was <1.5% for %VV and <5.5% for Hscore at all lung volumes. Concerning 129Xe data, CoV was <4% for %VV and <10% for Hscore at all lung volumes.
Table 6.
Coefficient of variation at each inflation level for metrics derived from hyperpolarized 3He and 129Xe
|
3He |
129Xe |
|||||||
|---|---|---|---|---|---|---|---|---|
| Acquisition | TCV | VV | %VV | Hscore | TCV | VV | %VV | Hscore |
| RV | 3.40 | 3.05 | 1.29 | 5.32 | 3.33 | 1.34 | 3.98 | 9.37 |
| RV + 1L | 4.13 | 4.64 | 0.63 | 4.62 | 2.19 | 2.26 | 1.16 | 7.60 |
| FRC | 4.63 | 4.64 | 0.87 | 3.99 | 5.88 | 4.80 | 1.49 | 2.86 |
| FRC + 1L | 3.42 | 3.42 | 0.38 | 2.74 | 6.88 | 6.00 | 3.18 | 3.74 |
| TLC | 1.19 | 1.00 | 0.54 | 5.46 | 1.97 | 1.91 | 0.62 | 4.62 |
RV, residual volume; RV + 1L, residual volume plus 1 liter of gas mixture; 3He, helium-3; V, volunteer; FRC, functional residual capacity; TLC, total lung capacity; TLV, total lung volume; VV, ventilated volume; Hscore, local heterogeneity score; %VV, percent lung ventilated volume.
Concerning the 3He data, strong intersession voxel-wise correlation was observed for all lung volumes (mean ± SD Spearman coefficients: 0.92 ± 0.03 for RV; 0.94 ± 0.03 for RV + 1L; 0.95 ± 0.02 for FRC; 0.95 ± 0.03 for FRC + 1L; and 0.93 ± 0.02 for TLC).
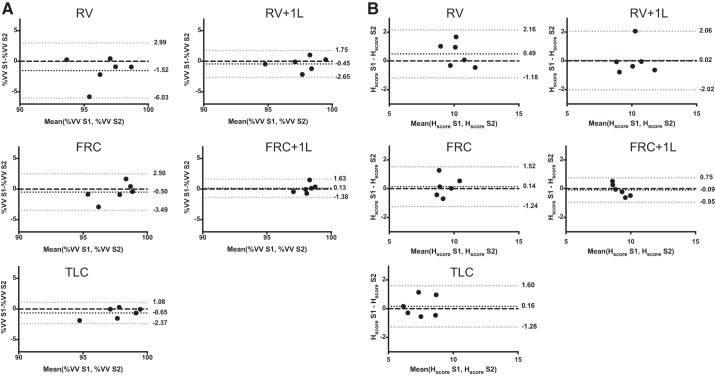
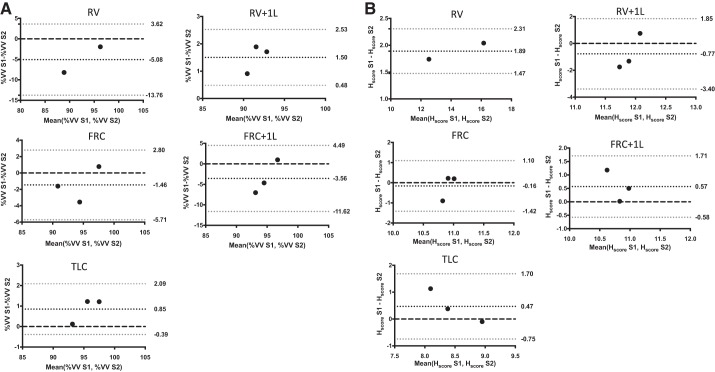
Bland-Altman bias ± limits of agreement are visualized in Fig. 7 (3He) and Fig. 8 (129Xe) for both %VV (Figs. 7A and 8A) and Hscore (Figs. 7B and 8B). For 3He data, the limits of agreement were <5% for %VV and <2.5% for Hscore. For 129Xe data, the limits of agreement were <10% for %VV and <4% for Hscore. For 3He MRI, the bias for %VV was <2% at all lung volumes and Hscore bias was <1% at all lung volumes, while for 129Xe MRI %VV bias was <6% at all lung volumes and Hscore bias was <2% at all lung volumes.
Fig. 7.
Bland-Altman plots of percent ventilated volume (%VV; A) and heterogeneity score (Hscore; B) generated from images acquired with hyperpolarized 3He at all acquisition volumes. Black dots indicate bias, gray dots are the 95% confidence intervals and the black dashed line is 0. RV, residual volume; RV + 1L, residual volume plus 1 liter of gas mixture; FRC, functional residual capacity; FRC + 1L, functional residual capacity volume plus 1 liter of gas mixture; TLC, total lung capacity.
Fig. 8.
Bland-Altman plots of ventilated volume (%VV; A) and heterogeneity score (Hscore; B)generated from images acquired with hyperpolarized 129Xe at all acquisition volumes. Black dots indicate bias, gray dots are the 95% confidence intervals, and the black dashed line is 0. RV, residual volume; RV + 1L, residual volume plus 1 liter of gas mixture; FRC, functional residual capacity; FRC + 1L, functional residual capacity volume plus 1 liter of gas mixture; TLC, total lung capacity.
Table 7 details the repeatability limit for %VV and Hscore from both HP 3He and 129Xe images. When considering 3He data %VV repeatability was <3% for all volumes except RV and <2% for all volumes when considering Hscore. When considering 129Xe data %VV repeatability was <10% for all volumes except RV and <3% for all volumes when considering Hscore.
Table 7.
Repeatability limit for %VV and median Hscore for images acquired using hyperpolarized 3He and 129Xe
| Acquisition | 3He %VV | 3He Hscore | 129Xe %VV | 129Xe Hscore |
|---|---|---|---|---|
| RV | 5.08 | 1.80 | 11.69 | 3.72 |
| RV + 1L | 2.19 | 1.86 | 3.06 | 2.62 |
| FRC | 2.90 | 1.29 | 4.50 | 1.07 |
| FRC + 1L | 1.39 | 0.80 | 9.59 | 1.45 |
| TLC | 2.02 | 1.35 | 1.95 | 1.36 |
RV, residual volume; RV + 1L, residual volume plus 1 liter of gas mixture; 3He, helium-3; V, volunteer; FRC, functional residual capacity; TLC, total lung capacity; VV, ventilated volume; Hscore, local heterogeneity score.
DISCUSSION
The work carried out here has demonstrated that lung volume has a significant bearing on quantitative measurements of lung ventilation derived from both 3He and 129Xe MRI. Additionally, from the effect of lung volume on the quantitative metrics of %VV and Hscore evident in healthy volunteers, it can be concluded that the lung volume during imaging must be well controlled to ensure that these metrics can be used reliably in longitudinal studies.
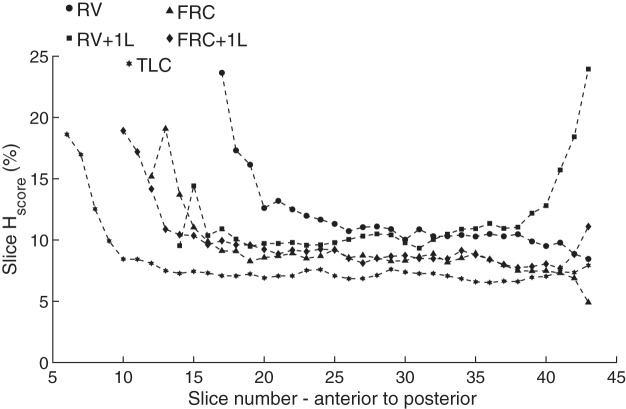
Imaging over all volunteers revealed increased ventilation heterogeneity at lower lung volumes, potentially indicating partial airway closure in certain regions of the lung. Increased heterogeneity was particularly observed in the posterior section of the lung at RV + 1L, exemplified by the median Hscore per slice plotted against slice number for volunteer 5 in Fig. 9. This increased heterogeneity is likely due to the breathing maneuver used to obtain the images at RV + 1L; that is the volunteers first exhaled to RV, which may have caused some airway closure. In contrast, the HP gas mixture was inhaled from FRC for all other lung volumes, and so the ventilation seen in the RV and FRC images was influenced by the gas distribution within the lungs at FRC + 1L. Note that although increased heterogeneity is seen in the anterior portion of the lung, the increased Hscore in those areas is due to the reduced SNR due to decreased gas reaching those areas within the lung.
Fig. 9.
Exemplary plot of Hscore from anterior to posterior for volunteer 5 (V5). RV, residual volume; RV + 1L, residual volume plus 1 liter of gas mixture; FRC, functional residual capacity; FRC + 1L, functional residual capacity volume plus 1 liter of gas mixture; TLC, total lung capacity; Hscore, heterogeneity score.
The increased ventilation heterogeneity at RV + 1L in volunteers suggests the same underpinning mechanisms as reported in the work by Muradyan et al. (23), where there were distinct focal areas of lung affected by airway closure after inhalation of small gas volumes from below residual volume in elite divers. We hypothesize that the areas of decreased ventilation signal at RV + 1L were caused by airways remaining closed following inhalation of the gas mixture. We believe that this same effect was not observed at RV in the current study since the maneuver to RV required first inhaling to FRC + 1L, such that gas would remain in the areas opened by this first inhalation maneuver even if the airways were to close later on. The areas of reduced ventilation in lungs of the elite divers following inhalation from sub-RV levels observed in the work by Muradyan et al. (23) were larger than those seen here in these volunteers, while they did not see the same heterogeneity seen here in their volunteers following inhalation from RV. One possible reason for this is the improvements in the image resolution for 129Xe when compared with their experiments that were carried out with two-dimensional projection imaging, thus providing us with better spatial sampling of regional heterogeneity.
Imaging after smaller inspirations from RV would be interesting to assess at which point the ventilation heterogeneity would return to a distribution closer to that seen at FRC or FRC + 1L. In this case, it would be expected that the smaller the volume inhaled from RV, the greater the ventilation heterogeneity would be although the feasibility of these experiments would be limited by the volume of HP gas required for sufficient image SNR if carrying the experiment out with 129Xe. Another factor that may contribute to increased Hscore at RV when compared with FRC + 1L and FRC is the increased ratio of blood vessel volume to lung volume at RV, resulting in increased Hscore.
The small CoV of %VV between sessions further confirms the growing body of evidence that %VV is a robust global metric of lung ventilation (5, 12, 17), and the high interscan repeatability makes %VV (or ventilation defect percentage) a good candidate metric for longitudinal assessment of lung function in patients (17). The proportionally larger CoV of the Hscore suggests that this measure of global ventilation image heterogeneity may be less repeatable.
The generally lower SNR of 129Xe images when compared with 3He images is a well-known phenomenon and follows previous publications (14, 28), with 129Xe acquisitions having a mean ± SD SNR of 30 ± 13 compared with the 42 ± 15 of the 3He acquisitions. Consequently, the higher Hscore seen in the 129Xe images when compared with images acquired with HP 3He is at least partially due to the lower SNR and thus increased heterogeneity of signal within ventilated regions. The lower %VV values measured from 129Xe images compared with 3He images may be due to the lower diffusivity of 129Xe compared with 3He and are consistent with %VV values reported previously in healthy volunteers, patients with chronic obstructive pulmonary disease, and patients with lung cancer who were imaged with both gases (18, 27). Furthermore, lower SNR in one of the 129Xe acquisitions (V6, RV, and session 1) caused an increase in Hscore showing that the maneuvers or gas doses need to be optimized for the 129Xe imaging acquisitions if this methodology is applied to patient cohorts. The need to register the anatomical images to the ventilation images for 129Xe %VV calculation will also contribute to the lower repeatability of 129Xe %VV when compared with 3He %VV (12), where anatomical images were acquired in the same breath-hold. Additionally, due to imaging constraints, HP 129Xe images were acquired with double the slice thickness (10 mm) of the HP 3He images (5 mm); thus differences would be expected due to different inherent physical properties and image acquisition considerations of the respective gas.
Imaging patients with HP gas at different lung volumes may provide a clearer picture of the nature of lung disease. For example, in patients with obstructive lung disease, following deep inhalation to TLC, the effect of increased positive pressure within the airways may result in a reduced Hscore and increased %VV due to opening of obstructed airways (20). Additionally, as patients with chronic respiratory disease may have increased closing volumes, imaging at expiration may identify areas of gas trapping similar to those observed by Holmes et al. (9–11).
An increased number of healthy volunteers with a larger age range and inclusion of female subjects would extend this preliminary work into the effect of lung volume on ventilation heterogeneity in healthy volunteers. Additionally, mitigating the signal dropout seen in TLC images with larger coil coverage is an important consideration for future studies. The smoking history of four of the six volunteers (2 former smokers and 2 occasional smokers) means that these data may not represent the ventilation patterns seen in a group of healthy never smokers. However, the number of pack years reported by the volunteers scanned was low (<0.7), and in a previous 3He MRI study of pulmonary ventilation (26), three of the smokers would have been classified as never smokers (<0.5 pack yr). However, the volunteers scanned were spirometrically defined as free from respiratory disease and not unrepresentative of the general population in terms of smoking history. The fact that increased ventilation heterogeneity at lower lung inflation levels was seen in the two never smokers as well as those with a smoking history suggests this effect is not due to smoking related obstructive airways disease.
Conclusions.
Increased ventilation heterogeneity was observed in HP gas images acquired at lower lung volumes in healthy volunteers. This work has shown that although total lung volume and VV may vary considerably between repeated scans there was little effect on %VV in these healthy volunteers. This indicates it may be important to image patients over a range of lung volumes with different breathing maneuvers to fully understand disease progression and accurately characterize ventilation defects and pulmonary mechanics. Finally, the variation in lung volume must be considered when monitoring patients longitudinally with hyperpolarized gas MRI particularly in the cases of disease with a reversible nature such as asthma.
GRANTS
We thank the University of Sheffield, Health Education England and National Institute for Health Research Grant RP-R3-12-027 and Integrated Clinical Academic-Clinical Doctoral Research Fellowship 2015-01-027, Sheffield Hospitals Charity Grant 161731, and Medical Research Council Grant MR/M008894/1 for funding this research.
DISCLOSURES
P. J. Hughes was partially funded by GlaxoSmithKline (STU100037614). None of the other authors has any conflicts of interest, financial or otherwise, to disclose.
AUTHOR CONTRIBUTIONS
P.J.C.H. and J.M.W. conceived and designed research; P.J.C.H., L.S., H.-F.C., G.N., and G.J.C. performed experiments; P.J.C.H. and B.A.T. analyzed data; P.J.C.H., L.S., H.M., and J.M.W. interpreted results of experiments; P.J.C.H. prepared figures; P.J.C.H. drafted manuscript; P.J.C.H., L.S., H.-F.C., B.A.T., G.N., G.J.C., A.M.B., H.M., and J.M.W. edited and revised manuscript; P.J.C.H., L.S., H.-F.C., B.A.T., G.N., G.J.C., A.M.B., H.M., and J.M.W. approved final version of manuscript.
ACKNOWLEDGMENTS
We thank Mr. Oliver Rodgers for aiding with the scanning of volunteers.
REFERENCES
- 1.Altes TA, Meyer CH, Mata JF, Froh DK, Paget-Brown A, Gerald Teague W, Fain SB, de Lange EE, Ruppert K, Botfield MC, Johnson MA, Mugler JP III. Hyperpolarized helium-3 magnetic resonance lung imaging of non-sedated infants and young children: a proof-of-concept study. Clin Imaging 45: 105–110, 2017. doi: 10.1016/j.clinimag.2017.04.004. [DOI] [PubMed] [Google Scholar]
- 2.Altman DG, Bland JM. Measurement in medicine: the analysis of method comparison studies. Statistician 32: 307–317, 1983. doi: 10.2307/2987937. [DOI] [Google Scholar]
- 3.Avants BB, Tustison NJ, Song G, Cook PA, Klein A, Gee JC. A reproducible evaluation of ANTs similarity metric performance in brain image registration. Neuroimage 54: 2033–2044, 2011. doi: 10.1016/j.neuroimage.2010.09.025. [DOI] [PMC free article] [PubMed] [Google Scholar]
- 4.Bannier E, Cieslar K, Mosbah K, Aubert F, Duboeuf F, Salhi Z, Gaillard S, Berthezène Y, Crémillieux Y, Reix P. Hyperpolarized 3He MR for sensitive imaging of ventilation function and treatment efficiency in young cystic fibrosis patients with normal lung function. Radiology 255: 225–232, 2010. doi: 10.1148/radiol.09090039. [DOI] [PubMed] [Google Scholar]
- 5.Fain SB, Korosec FR, Holmes JH, O’Halloran R, Sorkness RL, Grist TM. Functional lung imaging using hyperpolarized gas MRI. J Magn Reson Imaging 25: 910–923, 2007. doi: 10.1002/jmri.20876. [DOI] [PubMed] [Google Scholar]
- 6.Guo F, Yuan J, Rajchl M, Svenningsen S, Capaldi DP, Sheikh K, Fenster A, Parraga G. Globally optimal co-segmentation of three-dimensional pulmonary 1H and hyperpolarized 3He MRI with spatial consistence prior. Med Image Anal 23: 43–55, 2015. doi: 10.1016/j.media.2015.04.001. [DOI] [PubMed] [Google Scholar]
- 7.He M, Driehuys B, Que LG, Huang YT. Using hyperpolarized 129Xe MRI to quantify the pulmonary ventilation distribution. Acad Radiol 23: 1521–1531, 2016. doi: 10.1016/j.acra.2016.07.014. [DOI] [PMC free article] [PubMed] [Google Scholar]
- 8.Heydarian M, Kirby M, Wheatley A, Fenster A, Parraga G. Two and three-dimensional segmentation of hyperpolarized 3He magnetic resonance imaging of pulmonary gas distribution. In: Medical Imaging 2012: Biomedical Applications in Molecular, Structural, and Functional Imaging. Bellingham, WA: International Society for Optics and Photonics, 2012, p. 83171C. doi: 10.1117/12.910907. [DOI] [Google Scholar]
- 9.Holmes JH, Korosec FR, Du J, O’Halloran RL, Sorkness RL, Grist TM, Kuhlman JE, Fain SB. Imaging of lung ventilation and respiratory dynamics in a single ventilation cycle using hyperpolarized He-3 MRI. J Magn Reson Imaging 26: 630–636, 2007. doi: 10.1002/jmri.20965. [DOI] [PubMed] [Google Scholar]
- 10.Holmes JH, O’Halloran RL, Brodsky EK, Bley TA, Francois CJ, Velikina JV, Sorkness RL, Busse WW, Fain SB. Three-dimensional imaging of ventilation dynamics in asthmatics using multiecho projection acquisition with constrained reconstruction. Magn Reson Med 62: 1543–1556, 2009. doi: 10.1002/mrm.22150. [DOI] [PMC free article] [PubMed] [Google Scholar]
- 11.Holmes JH, O’Halloran RL, Brodsky EK, Jung Y, Block WF, Fain SB. 3D hyperpolarized He-3 MRI of ventilation using a multi-echo projection acquisition. Magn Reson Med 59: 1062–1071, 2008. doi: 10.1002/mrm.21437. [DOI] [PMC free article] [PubMed] [Google Scholar]
- 12.Horn FC, Tahir BA, Stewart NJ, Collier GJ, Norquay G, Leung G, Ireland RH, Parra-Robles J, Marshall H, Wild JM. Lung ventilation volumetry with same-breath acquisition of hyperpolarized gas and proton MRI. NMR Biomed 27: 1461–1467, 2014. doi: 10.1002/nbm.3187. [DOI] [PubMed] [Google Scholar]
- 13.Horn FC, Marshall H, Collier GJ, Kay R, Siddiqui S, Brightling CE, Parra-Robles J, Wild JM. Regional ventilation changes in the lung: treatment response mapping by using hyperpolarized gas MR imaging as a quantitative biomarker. Radiology 284: 854–861, 2017. doi: 10.1148/radiol.2017160532. [DOI] [PubMed] [Google Scholar]
- 14.Horn FC, Rao M, Stewart NJ, Wild JM. Multiple breath washout of hyperpolarized 129Xe and 3He in human lungs with three-dimensional balanced steady-state free-precession imaging. Magn Reson Med 77: 2288–2295, 2017. doi: 10.1002/mrm.26319. [DOI] [PMC free article] [PubMed] [Google Scholar]
- 15.Hughes PJC, Horn FC, Collier GJ, Biancardi A, Marshall H, Wild JM. Spatial fuzzy c-means thresholding for semiautomated calculation of percentage lung ventilated volume from hyperpolarized gas and 1 H MRI. J Magn Reson Imaging 47: 640–646, 2018. doi: 10.1002/jmri.25804. [DOI] [PubMed] [Google Scholar]
- 16.Kirby M, Heydarian M, Svenningsen S, Wheatley A, McCormack DG, Etemad-Rezai R, Parraga G. Hyperpolarized 3He magnetic resonance functional imaging semiautomated segmentation. Acad Radiol 19: 141–152, 2012. doi: 10.1016/j.acra.2011.10.007. [DOI] [PubMed] [Google Scholar]
- 17.Kirby M, Mathew L, Wheatley A, Santyr GE, McCormack DG, Parraga G. Chronic obstructive pulmonary disease: longitudinal hyperpolarized (3)He MR imaging. Radiology 256: 280–289, 2010. doi: 10.1148/radiol.10091937. [DOI] [PubMed] [Google Scholar]
- 18.Kirby M, Svenningsen S, Owrangi A, Wheatley A, Farag A, Ouriadov A, Santyr GE, Etemad-Rezai R, Coxson HO, McCormack DG, Parraga G. Hyperpolarized 3He and 129Xe MR imaging in healthy volunteers and patients with chronic obstructive pulmonary disease. Radiology 265: 600–610, 2012. doi: 10.1148/radiol.12120485. [DOI] [PubMed] [Google Scholar]
- 19.Marshall H, Horsley A, Taylor CJ, Smith L, Hughes D, Horn FC, Swift AJ, Parra-Robles J, Hughes PJ, Norquay G, Stewart NJ, Collier GJ, Teare D, Cunningham S, Aldag I, Wild JM. Detection of early subclinical lung disease in children with cystic fibrosis by lung ventilation imaging with hyperpolarised gas MRI. Thorax 72: 760–762, 2017. doi: 10.1136/thoraxjnl-2016-208948. [DOI] [PubMed] [Google Scholar]
- 20.Marshall H, Siddiqui S, Leung G, Parra-Robles J, Xu X, Brightling C, and Wild J. Imaging the effect of airway opening in asthma due to inflation state with 3HE MRI (Abstract) In: B109 Technologic Advances In Imaging For Phenotyping Lung Disease American Thoracic Society, 2013, p. A3744–A3744. [Google Scholar]
- 21.McAlinden C, Khadka J, Pesudovs K. Precision (repeatability and reproducibility) studies and sample-size calculation. J Cataract Refract Surg 41: 2598–2604, 2015. doi: 10.1016/j.jcrs.2015.06.029. [DOI] [PubMed] [Google Scholar]
- 22.Miller MR, Hankinson J, Brusasco V, Burgos F, Casaburi R, Coates A, Crapo R, Enright P, van der Grinten CP, Gustafsson P, Jensen R, Johnson DC, MacIntyre N, McKay R, Navajas D, Pedersen OF, Pellegrino R, Viegi G, Wanger J; ATS/ERS Task Force . Standardisation of spirometry. Eur Respir J 26: 319–338, 2005. doi: 10.1183/09031936.05.00034805. [DOI] [PubMed] [Google Scholar]
- 23.Muradyan I, Loring SH, Ferrigno M, Lindholm P, Topulos GP, Patz S, Butler JP. Inhalation heterogeneity from subresidual volumes in elite divers. J Appl Physiol (1985) 109: 1969–1973, 2010. doi: 10.1152/japplphysiol.00953.2009. [DOI] [PMC free article] [PubMed] [Google Scholar]
- 24.Norquay G, Collier G, Rao M, Stewart N, Wild J. 129Xe-Rb spin-exchange optical pumping with high photon efficiency. Phys Rev Lett 121: 153201, 2018. doi: 10.1103/PhysRevLett.121.153201. [DOI] [PubMed] [Google Scholar]
- 25.Reinstein DZ, Archer TJ, Silverman RH, Coleman DJ. Accuracy, repeatability, and reproducibility of Artemis very high-frequency digital ultrasound arc-scan lateral dimension measurements. J Cataract Refract Surg 32: 1799–1802, 2006. doi: 10.1016/j.jcrs.2006.07.017. [DOI] [PMC free article] [PubMed] [Google Scholar]
- 26.Sheikh K, Paulin GA, Svenningsen S, Kirby M, Paterson NA, McCormack DG, Parraga G. Pulmonary ventilation defects in older never-smokers. J Appl Physiol (1985) 117: 297–306, 2014. doi: 10.1152/japplphysiol.00046.2014. [DOI] [PubMed] [Google Scholar]
- 27.Stewart NJ, Chan H-F, Hughes PJC, Horn FC, Norquay G, Rao M, Yates DP, Ireland RH, Hatton MQ, Tahir BA, Ford P, Swift AJ, Lawson R, Marshall H, Collier GJ, Wild JM. Comparison of 3He and 129Xe MRI for evaluation of lung microstructure and ventilation at 1.5T. J Magn Reson Imaging 48: 632–642, 2018. doi: 10.1002/jmri.25992. [DOI] [PMC free article] [PubMed] [Google Scholar]
- 28.Stewart NJ, Norquay G, Griffiths PD, Wild JM. Feasibility of human lung ventilation imaging using highly polarized naturally abundant xenon and optimized three-dimensional steady-state free precession. Magn Reson Med 74: 346–352, 2015. doi: 10.1002/mrm.25732. [DOI] [PubMed] [Google Scholar]
- 29.Svenningsen S, Kirby M, Starr D, Leary D, Wheatley A, Maksym GN, McCormack DG, Parraga G. Hyperpolarized (3) He and (129) Xe MRI: differences in asthma before bronchodilation. J Magn Reson Imaging 38: 1521–1530, 2013. doi: 10.1002/jmri.24111. [DOI] [PubMed] [Google Scholar]
- 30.Tahir BA, Hughes PJC, Robinson SD, Marshall H, Stewart NJ, Norquay G, Biancardi A, Chan H-F, Collier GJ, Hart KA, Swinscoe JA, Hatton MQ, Wild JM, Ireland RH. Spatial comparison of CT-based surrogates of lung ventilation with hyperpolarized Helium-3 and Xenon-129 gas MRI in patients undergoing radiation therapy. Int J Radiat Oncol Biol Phys 102: 1276–1286, 2018. doi: 10.1016/j.ijrobp.2018.04.077. [DOI] [PubMed] [Google Scholar]
- 31.Tzeng YS, Lutchen K, Albert M. The difference in ventilation heterogeneity between asthmatic and healthy subjects quantified using hyperpolarized 3He MRI. J Appl Physiol (1985) 106: 813–822, 2009. doi: 10.1152/japplphysiol.01133.2007. [DOI] [PubMed] [Google Scholar]
- 32.Wanger J, Clausen JL, Coates A, Pedersen OF, Brusasco V, Burgos F, Casaburi R, Crapo R, Enright P, van der Grinten CP, Gustafsson P, Hankinson J, Jensen R, Johnson D, Macintyre N, McKay R, Miller MR, Navajas D, Pellegrino R, Viegi G. Standardisation of the measurement of lung volumes. Eur Respir J 26: 511–522, 2005. doi: 10.1183/09031936.05.00035005. [DOI] [PubMed] [Google Scholar]
- 33.Woodhouse N, Wild JM, Paley MN, Fichele S, Said Z, Swift AJ, van Beek EJ. Combined helium-3/proton magnetic resonance imaging measurement of ventilated lung volumes in smokers compared to never-smokers. J Magn Reson Imaging 21: 365–369, 2005. doi: 10.1002/jmri.20290. [DOI] [PubMed] [Google Scholar]
- 34.Zha W, Niles DJ, Kruger SJ, Dardzinski BJ, Cadman RV, Mummy DG, Nagle SK, Fain SB. Semiautomated ventilation defect quantification in exercise-induced bronchoconstriction using hyperpolarized helium-3 magnetic resonance imaging: a repeatability study. Acad Radiol 23: 1104–1114, 2016. doi: 10.1016/j.acra.2016.04.005. [DOI] [PMC free article] [PubMed] [Google Scholar]


