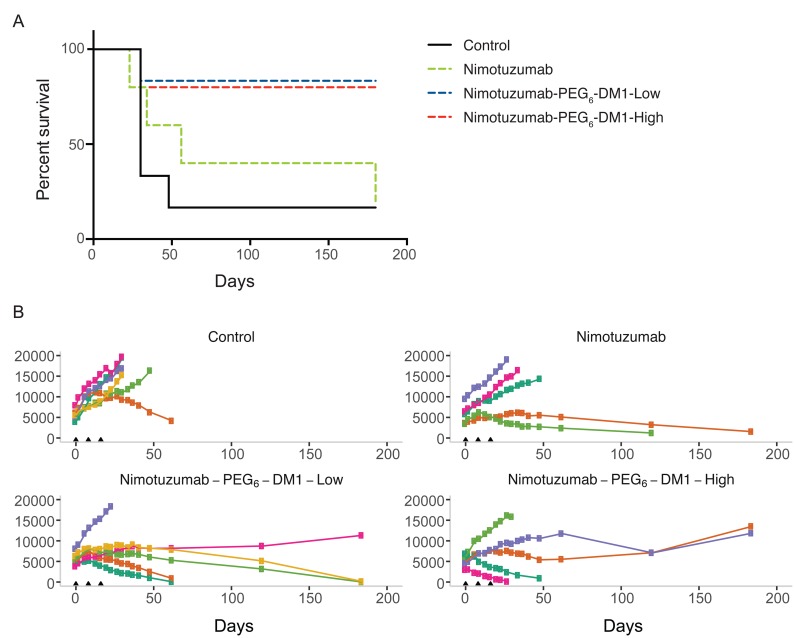
Figure 5.
(A–B) Enhanced efficacy of nimotuzumab ADCs in EGFR-positive murine xenograft model DLD-1-iRFP-702 (A) Kaplan–Meier curves for overall survival in CD-1 mice bearing DLD-1-iRFP-702 xenografts following treatment with normal PBS (black solid line), nimotuzumab (green dotted line), nimotuzumab-PEG6-DM1-Low (blue dotted line), and nimotuzumab-PEG6-DM1-High (red dotted line). When xenografts reached the appropriate size, mice were randomized into 5–6 mice per group and treated on day 0, 8 and 16. The endpoint was when xenograft volume reached 2000 mm3, or if the xenograft ulcerated (> 20% of tumor volume). Log-rank test analysis demonstrated that the survival of the PBS group was significantly different from that of nimotuzumab-PEG6-DM1-Low group and nimotuzumab-PEG6-DM1-High group (p < 0.05). While there was no statistically significant difference between normal saline group and nimotuzumab group survival curves (p > 0.05). (B) Tumor volumes of individual mice (represented by the different colors) as measured (see Supplementary Materials for details) by whole body near infrared imaging of (fluorescently labelled) DLD-1-iRFP-702 tumor bearing mice.

