

Abstract
Tropical peatland ecosystems are a significant component of the global carbon cycle and feature a range of distinct vegetation types, but the extent of links between contrasting plant species, peat biogeochemistry and greenhouse gas fluxes remains unclear. Here we assessed how vegetation affects small scale variation of tropical peatland carbon dynamics by quantifying in situ greenhouse gas emissions over 1 month using the closed chamber technique, and peat organic matter properties using Rock-Eval 6 pyrolysis within the rooting zones of canopy palms and broadleaved evergreen trees. Mean methane fluxes ranged from 0.56 to 1.2 mg m−2 h−1 and were significantly greater closer to plant stems. In addition, pH, ranging from 3.95 to 4.16, was significantly greater closer to stems. A three pool model of organic matter thermal stability (labile, intermediate and passive pools) indicated a large labile pool in surface peat (35–42%), with equivalent carbon stocks of 2236–3065 g m−2. Methane fluxes were driven by overall substrate availability rather than any specific carbon pool. No peat properties correlated with carbon dioxide fluxes, suggesting a significant role for root respiration, aerobic decomposition and/or methane oxidation. These results demonstrate how vegetation type and inputs, and peat organic matter properties are important determinants of small scale spatial variation of methane fluxes in tropical peatlands that are affected by climate and land use change.
Electronic supplementary material
The online version of this article (10.1007/s10533-018-0531-1) contains supplementary material, which is available to authorized users.
Keywords: Tropical peat, Carbon dioxide, Methane, Organic matter, Rock-Eval pyrolysis, Geochemistry
Introduction
Plant inputs of leaf and stem material and rhizodeposits are important in regulating greenhouse gas (GHG) emissions from tropical peat (Hoyos-Santillan et al. 2016b). Land use and climate change can significantly alter plant community composition, which may alter peat chemistry through changes in species-specific carbon inputs (Tonks et al. 2017; Girkin et al. 2018a, b). The consequences of this change are likely to be pronounced as peatlands contain an estimated 15–19% of the global peat carbon stock, and are a significant source of carbon dioxide (CO2) and methane (CH4) (Page et al. 2011; Dargie et al. 2017).
Tropical peats derived from different botanical origins have distinct organic matter chemistries which results in different decomposition rates and GHG production (Hoyos-Santillan et al. 2015), particularly in comparison to temperate and boreal peatlands where peat formation is predominantly driven by graminoid and moss inputs (Turetsky et al. 2014). Under water-logged anoxic conditions that typify peatlands, decomposition is associated with significant CH4 fluxes. CO2 is also produced through a combination of autotrophic root respiration, aerobic heterotrophic microbial respiration and the oxidation of CH4 (Sayer and Tanner 2010). Differences in vegetation can therefore affect the balance of these emissions through changes in substrate inputs, organic matter composition, microbial communities (Ayres et al. 2009; Keiser et al. 2014), root release of oxygen (Hoyos-Santillan et al. 2016a), and physical properties of the peat (Wright et al. 2013b), and through providing a significant pathway for GHG transport (Pangala et al. 2017).
The extent of plant influences can vary spatially, with rhizosphere soils subject to strong root influences featuring distinct physiochemical properties compared to bulk soils. For example, phosphorus (Hinsinger and Gilkes 1996) and nitrogen limitation (Landi et al. 2006) are known to drive the release of root exudates, which may in turn be associated with changes in soil properties such as pH (Youssef and Chino 1989), as well as changes in microbial activity and composition (Gomes et al. 2003; Shi et al. 2011). Combined with differences in biogeochemical properties and microtopography between plant species, peats can display significant small scale (cm to m) variation in chemical properties (Jauhiainen et al. 2005; Wright et al. 2013b). However, the extent to which this variation in peat chemistry under individual plants influences carbon cycling in tropical peatlands is unclear.
Rock-Eval pyrolysis has previously been used to characterise carbon cycling and organic matter transformation within mangrove (Marchand et al. 2008) and marine sediments (Hare et al. 2014), as well as soil organic matter (SOM) dynamics with profile depth (Disnar et al. 2003; Sebag et al. 2006, 2016), and the extent of decomposition and humification in northern peats (Delarue et al. 2013; Biester et al. 2014). Parameters from Rock-Eval of particular relevance to peat organic matter include the hydrogen index (HI), indicative of atomic H:C, and the oxygen index (OI), indicative of atomic O:C, in addition to TpkS2, the temperature associated with the highest yield of bound hydrocarbons, and S2, a measure of overall hydrocarbons released on the thermal cracking of organic matter for temperatures up to 650 °C. Higher values of HI in peat deposits have been interpreted as indicating the presence of hydrogen-rich labile carbon compounds predominantly found in fresh organic matter inputs (Outridge and Sanei 2010). HI has previously been reported to decrease with depth, indicating the conversion of aliphatic to aromatic carbon through decomposition (Barre et al. 2016; Upton et al. 2018). OI generally correlates with the presence of polysaccharides, consistent with the high presence of oxygen particularly in comparison to aromatic compounds. Changes in OI have therefore been proposed as a possible indicator of polysaccharide decomposition in peat (Delarue et al. 2013), although are subject to a higher degree of error than other parameters (Behar et al. 2001).
We used Rock-Eval pyrolysis to assess the heterogeneity of surface peat organic matter properties at two distances within the rooting zones of two plant species commonly found in tropical peatlands, Campnosperma panamensis (Standl.), a broadleaved evergreen tree, and Raphia taedigera (Mart.), a canopy palm. We then linked differences in organic matter properties at both distances to GHG fluxes measurements, averaged over 1 month to assess how peat chemical properties can regulate emissions. We hypothesised that: (i) carbon emissions differ with distance from the stems because of chemical and physical conditions; (ii) peat mineralization results in preferential decay of labile organic compounds; (iii) consequently the balance of production/degradation over time drives the differences in peat composition with the distance from stems; (iv) differences in organic matter inputs between plant species will result in distinct peat properties and carbon emissions.
Methods
Study sites
This study was conducted in a 80 km2 ombrotrophic peatland at Changuinola, part of the San San Pond Sak freshwater and marine wetland located in Bocas del Toro province, Panama. The peatland was initiated 4000–5000 years ago and is 8 m deep at the centre of the peat dome (Phillips et al. 1997). The peatland supports seven plant communities along a successional gradient from the coast to the central peat dome. The coastal side is dominated by Rhizophora mangle mangrove swamp, succeeded by R. taedigera dominated palm swamp, a mixed species forest swamp, C. panamensis forest swamp, a stunted forest swamp and a Myrica-Cyrilla bog-plain (Phillips et al. 1997). The peatland is characterised by a decline in nutrient availability towards the centre of the peat dome (Sjögersten et al. 2011).
Mean annual temperature was 26 °C in the 13 years prior to sampling, with a mean annual rainfall of 3207 mm. During the sampling period in February 2015, peat and mean air were 25 °C and rainfall was 280 mm, which are broadly representative of climatic conditions throughout the year (Wright et al. 2013b). The water table height varied during sampling but remained consistently just above the peat surface in hollows where sampling occurred, although hummocks were often raised above the water table.
Peat and pore water sampling
Peat samples were collected from a mixed species stand of C. panamensis and R. taedigera located 600 m from the coast (09°18′13.00″N, 82°21′13.80″W). Samples were collected from under six C. panamensis trees and six R. taedigera palms selected to maximise distance to the nearest neighbouring plant in an area measuring approximately 1 ha. Peat samples were collected at two distances from plant stems, 0.5 m and at 1.5 m, to assess variation in biogeochemical properties within the rooting zone of each individual plant, particularly the effects of reduced root biomass (Fig. 1). This assumed that fine root biomass decreased with increasing distance from plant stems (Taskinen et al. 2003; Bauhus and Bartsch 1996; Mulia and Dupraz 2006), which has previously been reported in oil palm plantations (Matysek et al. 2017). Samples were not collected at greater distances due to the increased likelihood of influences from other plants including understory vegetation although this was limited, particularly under R. taedigera (Wright et al. 2013b). Tropical forested peatlands have previously been characterised as featuring distinct hummocks raised above the water table which are generally raised above the water table throughout the year, and hollows which are periodically inundated depending on changes in the water table. Hummocks have previously been proposed as more significant CO2 sources than hollows, with hollows more important CH4 sources during inundation (Jauhiainen et al. 2005; Comeau et al. 2013) although this is not a consistent finding (Hergoualac’h et al. 2017). The microtopography under both R. taedigera and C. panamensis featured a mix of shallow water pools and raised areas primarily driven by increased the presence of pneumatophores and roots. Sampling of both peat and GHGs was conducted in hollows at both distances to ensure that sampling was conducted in areas continually inundated.
Fig. 1.
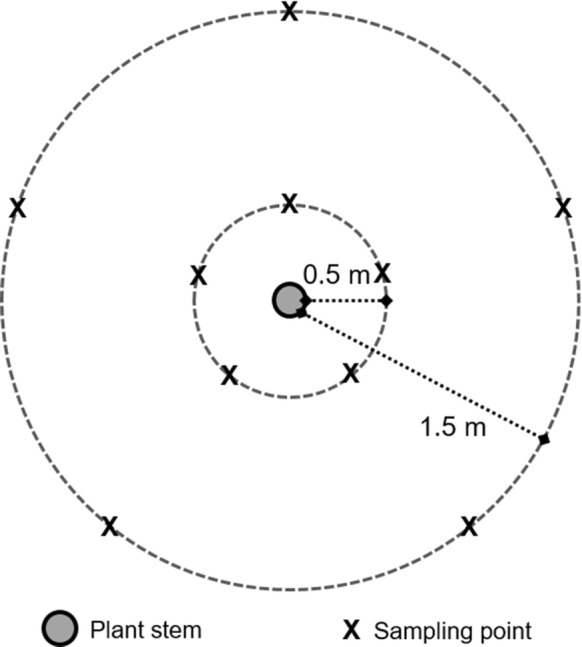
Peat sampling strategy at five points around each individual plant stem, replicated across six C. panamensis and six R. taedigera plants
Five samples were collected under each plant to a depth of 25 cm using a hand trowel, and combined to create a composite sample. Tree and palm height and diameter-at-breast-height (DBH) were measured for each selected plant, with DBH measured for R. taedigera at the highest point before the stem divided into individual palm fronds. A single peat core was collected at both distances under each plant and to a depth of 25 cm to measure fine root density. Cores were weighed and live, fine roots were (< 2 mm) separated by hand based on colour, washed and oven dried at 65 °C for 3 days. In the absence of any nearby vegetation, it was assumed that live roots were derived solely from the plant at the focal point of sampling. Dry root density was calculated using dry root weight divided by the volume of the core.
In situ gas flux measurements
In situ gas fluxes were measured adjacent to each peat sampling site on five occasions over 1 month from hollows at each site. CH4 fluxes across nearby sites have previously been shown to be fairly consistent throughout the year between January and June, although CO2 fluxes are more variable (Wright et al. 2013b). Chambers were placed in hollows, avoiding understory vegetation which may represent an additional organic matter source. Fluxes are therefore a measure of soil respiration rather than ecosystem respiration. Gases were collected from headspaces (0.19 dm3) fitted with a Suba seal® rubber septa (Fisherbrand, Loughborough, UK) between 10 a.m. and 4 p.m. on each sampling day, with samples collected 0, 4 and 8 min following chamber installation (Sjögersten et al. 2011). Headspace gases were mixed using a 20 ml syringe and needle and injected into pre-evacuated 12 ml glass exetainers sealed with a screw cap septum, resulting in a slight over-pressurisation (LABCO, UK). CO2 and CH4 concentrations were measured using a single injection system with a 1 ml sample loop using N2 as a carrier gas through a non-polar methyl silicone capillary column (GC-2014; Shimadzu, Milton Keynes, UK). A thermal conductivity detector and flame ionization detector were used to measure CO2 and CH4 respectively. Fluxes were calculated using the ideal gas law and assuming the linear accumulation of gases over time (Hogg et al. 1992). Samples that were under-pressurised at the time of analysis were discarded.
Peat and pore water characterization
Peat sub-samples were used to characterize physiochemical properties to 25 cm depth, at 0.5 and 1.5 m from plant stems. Gravimetric moisture content was determined from the mass lost from 10 g of wet peat, oven dried at 105 °C for 24 h. Peat organic matter content was determined as the mass lost after ignition for 7 h at 550 °C in a muffle furnace. Bulk density was measured by collecting intact 10 cm × 10 cm × 25 cm sections from the peat surface, oven drying at 105 °C for 24 h, and weighing. Total peat carbon (C) and total nitrogen (N) content were determined from 0.2 g of dry, homogenised peat combusted using a total element analyser (Flash EA 1112, CE Instruments, Wigan, UK).
Dehydrogenase activity, used as a general indicator of microbial activity, was determined by the reduction of 2,3,5-triphenyltetrazolium chloride (TPC) (Ohlinger 1995). Two replicate peat samples (1.5 g dry weight) were incubated with 5 ml of 3% TPC at 30 °C for 24 h, producing triphenyl formazan (TPF). TPF was extracted by shaking with 25 ml of methanol for 2 h in the dark. The solution was then filtered in a semi-dark room and the intensity of TPF was measured at 485 nm against a range of known standards. Dehydrogenase activity was expressed in µg TPF g−1 h−1.
Peat pore water samples were collected from 25 cm depth using 10 cm long Rhizon samplers made from hydrophilic porous polymer with a pore diameter of 0.1 µm to exclude peat particles (Rhizosphere Research Products, Wageningen, The Netherlands). Samples were frozen during storage and transport. Fulvic acid to humic acid ratios in pore water, indicative of the extent of peat humification and aromaticity, were assessed by spectrophotometric analysis (Grayson and Holden 2012). Pore water samples were passed through a cellulose filter (Whatman Grade 1, 11 μm) and analysed at 465 and 665 nm (U-2010, Hitachi UV–Vis Spectrophotometer) to calculate the E465:E665 index which reflects the ratio of humic to fulvic acids and thus broadly indicates the extent of humification (Uyguner and Bekbolet 2005). Dissolved organic carbon (DOC) and total dissolved nitrogen (TDN) were measured using a TOC-V/TN analyser (Shimadzu Corp, Kyoto, Japan).
Rock-Eval 6 pyrolysis
Peat sub-samples were analysed using a Rock-Eval 6 analyser. Freeze-dried powdered peat samples (60 mg) were heated at 300 °C for 3 min before an increase in temperature to 650 °C at a rate of 25 °C per minute in an inert N2 atmosphere. Residual carbon was subsequently oxidized from 300 to 850 °C at a rate of 20 °C per minute. The release of hydrocarbons during the two-stage pyrolysis process was detected by a flame ionisation detector, with an infrared cell detecting the release of CO and CO2 during the thermal cracking of the organic matter. Rock-Eval analysis generated a range of standard parameters including S1 (a measure of free hydrocarbons released on heating to 300 °C), S2 (hydrocarbons released on the thermal cracking of organic matter for temperatures up to 650 °C), S3CO and S3CO2 (the CO and CO2 yielded from the breakdown of kerogen), Tpk2 (the temperature associated with the highest yield of bound hydrocarbons) and total organic carbon (TOCRE). The Hydrogen Index (HI, mg HC g−1 TOCRE6), a measure of hydrocarbons released relative to TOC was calculated as S2 × 100/TOCRE. The Oxygen Index (OI, mg O2 g−1 TOCRE6), corresponding to the amount of oxygen released as CO2 relative to TOCRE was calculated as S3 × 100/TOCRE.
Additional parameters were derived from the deconvolution of S2 pyrograms using Fityk v0.9.7, a curve fitting and data analysis program. S2 pyrograms were deconvoluted into six Gaussian signals (F1–F6) based on maximising R2 coefficient values. F1–F6 values have previously been attributed to organic compounds of increasing thermal stability (Disnar et al. 2003; Sebag et al. 2006). F1 and F2 correspond to thermally labile fresh plant material including simple polysaccharides, and lignin and cellulose derived compounds, respectively. F3 and F4 relate to humic compounds. F5 and F6 correspond to highly mature and recalcitrant organic matter, or charcoal (Sebag et al. 2016). Saenger et al. (2013) proposed combining these signals into three pools representing different phases of carbon thermal stability, with Cl representing highly labile hydrocarbon compounds (F1 and F2), Ci corresponding to the more stabilised carbon pool (F3), and the highly recalcitrant pool, Cp (F4–F6). The amount of carbon in each pool was subsequently calculated for the upper 20 cm of the peat, expressed in g C m−2, using TOCRE6 and bulk density.
A second set of indices, I and R, describing the preservation of thermally labile and highly thermostable organic matter respectively, were calculated using the approach proposed by Sebag et al. (2016) using the integrated areas under the S2 curve between given temperature nodes. Areas were calculated as 200–340 °C (A1, labile biopolymers), 340–400 °C (A2, resistant biopolymers), 400–460 °C (A3, immature geopolymers), and > 460 °C (A4, mature geopolymers). The I-index was calculated as log((A1 + A2)/A3) and the R-index was calculated as (A3 + A4)/100 and represents the contribution of mature organic matter to the S2 signal (Sebag et al. 2016).
Statistical analysis
Statistical analyses were conducted in GenStat v17.1. Differences in CO2 and CH4 fluxes, peat properties, including Rock-Eval parameters and indices, were assessed using a linear mixed effects model fitted using residual maximum likelihood (REML) to account for variable dependence between sampling plots. CO2 and CH4 fluxes, dehydrogenase activity, and the proportional pools Cl, Ci and Cp were log10-transformed to meet assumptions of normality, tested using Shapiro–Wilk tests. Significance was assessed at p ≤ 0.05. Relationships between key environmental variables and mean GHG fluxes (averaged over the sampling period) were assessed using Principal Component Analysis (PCA), based on correlation matrices. Backwards stepwise elimination regression was then used to identify significant relationships between Rock-Eval parameters and indices, and logged CO2 and CH4 fluxes. The maximal model included Cl, Ci and Cp pool carbon stocks, HI, OI, S2, S3CO, S3CO2, and TpkS2. Full ANOVA tables are reported in supplementary materials.
Results
Vegetation, peat and pore water properties
Campnosperma panamensis trees had a mean height of 15.0 m, and DBH of 41.6 cm, with fine root density ranging from 8.2 to 10.6 mg cm−3 across the rooting zone (Table 1). Peats were characterised by low bulk density (0.08–0.14 g cm−3) and consistently high moisture (89.0%). Peats were acidic, and weakly reducing (306–311 mV), with low electrical conductivity (115–124 µS). Microbial activity in the peats was broadly comparable to previous measurements ex situ (3.1 µg TPF g−1 h−1) (Girkin et al. 2018a). Organic matter content and total carbon was high, but low nitrogen resulted in C:N ratios of 16.8–17.7. C. panamensis pore water had maximum DOC and TDN content at 0.5 m (166.8 and 22.1 mg l−1). E465:E665, indicative of the condensation of aromatic carbon, increased slightly at 1.5 m (9.9) compared to 0.5 m (8.5).
Table 1.
Tree characteristics, peat and pore water properties of C. panamensis and R. taedigera
| Species | C. panamensis | R. taedigera | ||
|---|---|---|---|---|
| Distance (m) | 0.5 | 1.5 | 0.5 | 1.5 |
| Height (m) | 15 ± 0.8 | – | 8.3 ± 3.4 | – |
| DBH (cm) | 41.6 ± 2.6 | – | 30.2 ± 3.7 | – |
| Fine root density (mg cm−3) | 10.6 ± 2.2 | 8.2 ± 1.2 | 8.1 ± 1.5 | 6.5 ± 1.5 |
| Bulk density (g cm−3) | 0.08 ± 0.01 | 0.14 ± 0.05 | 0.10 ± 0.01 | 0.08 ± 0.01 |
| Gravimetric moisture content (%) | 89.0 ± 1.0 | 89.0 ± 0.5 | 89.2 ± 0.9 | 90.5 ± 0.5 |
| pH | 3.95 ± 0.05 | 3.88 ± 0.14 | 4.16 ± 0.06 | 3.94 ± 0.10 |
| Conductivity (µS) | 112 ± 25 | 124 ± 29 | 70 ± 12 | 75 ± 10 |
| Redox potential (mV) | 311 ± 9 | 306 ± 5 | 304 ± 4 | 306 ± 5 |
| Dehydrogenase (µg TPF g−1 h−1) | 3.1 ± 0.2 | 3.1 ± 0.3 | 3.6 ± 0.3 | 2.9 ± 0.3 |
| Total carbon (%) | 46.0 ± 1.5 | 45.7 ± 3.4 | 43.6 ± 1.7 | 41.0 ± 4.0 |
| Total nitrogen (%) | 2.8 ± 0.1 | 2.6 ± 0.3 | 2.6 ± 0.2 | 2.5 ± 0.3 |
| C:N | 16.8 ± 0.7 | 17.7 ± 0.9 | 16.8 ± 0.4 | 16.2 ± 0.4 |
| Organic matter content (%) | 94.7 ± 0.6 | 96.3 ± 0.7 | 88.7 ± 2.6 | 92.6 ± 2.3 |
| DOC (mg l−1) | 166.8 ± 19.1 | 149.8 ± 17.2 | 184 ± 28.6 | 188.2 ± 31.2 |
| TDN (mg l−1) | 22.1 ± 3.1 | 21.1 ± 1.9 | 21 ± 3.3 | 22.1 ± 3.6 |
| E465:E665 | 8.5 ± 0.4 | 9.9 ± 0.7 | 8.7 ± 1.1 | 8.9 ± 0.7 |
Means ± 1 SEM (n = 6)
Raphia taedigera palms were smaller than C. panamensis trees with a mean height of 8.3 m and significantly lower DBH (F1,10 = 6.27, p = 0.03). Fine root density decreased with distance and was lower than C. panamensis, but these differences were not significant. R. taedigera peats were characterised by low bulk density (0.06–0.10 g cm-3) and high moisture content. Peats were acidic, with pH declining from 4.16 at 0.5 m to 3.94 at 1.5, and had low conductivity (70–75 µS) and a weakly reducing redox potential. At 0.5 m from the stem, mean dehydrogenase activity was higher than under C. panamensis peats (3.6 µg TPF g−1 h−1) but decreased to 2.9 µg TPF g−1 h−1 at 1.5 m. Organic matter content was lower at 0.5 m (88.7%) compared to 1.5 m (92.6%), matching the trend observed under C. panamensis but total carbon was broadly similar at both distances (43.6% and 41%). Total nitrogen and C:N both declined at 1.5 m. Pore water collected from under R. taedigera at both distances was characterised by high DOC but low TDN content, and consistent E465:E665 ratios which indicated humified organic matter.
Of these changes, pH declined significantly under both species at 1.5 m from plant stems (F1,10 = 5.16, p = 0.049). Additionally, organic matter content was significantly higher at 1.5 m compared to 0.5 m (F1,10 = 10.80, p = 0.01).
In situ CO2 and CH4 fluxes
Mean CO2 fluxes were consistently lower at 0.5 m under C. panamensis (84.50 mg CO2 m−2 h−1), increasing to 108.22 mg CO2 m−2 h−1 at 1.5 m (Fig. 2a). CO2 fluxes at 0.5 m were higher under R. taedigera (124.50 mg CO2 m−2 h−1), decreasing to 119.92 mg CO2 m−2 h−1 at 1.5 m, although these differences were not significant (F1,37.6 = 0.02, p = 0.88). CO2 fluxes varied significantly during the sampling period, ranging from 291.98 to 32.52 mg CO2 m−2 h−1 (F4,33.8 = 7.32, p < 0.001).
Fig. 2.

a CO2, and b CH4 fluxes at 0.5 m and 1.5 m from C. panamensis and R. taedigera plant stems. Means ± 1 SEM (n = 6)
In contrast, CH4 fluxes were significantly higher at 0.5 m compared to 1.5 m under both species (F1,35 = 6.03, p = 0.02). Mean fluxes under C. panamensis decreased from 1.25 to 0.56 mg CH4 m−2 h−1, and decreased under R. taedigera from 1.00 to 0.75 mg CH4 m−2 h−1 but the difference between species was not significant (F1,9.9 = 0.06, p = 0.82). CH4 fluxes also varied significantly over the course of the sampling period (F4,29.5 = 3.92, p = 0.01).
Bulk organic matter properties
S1, indicative of low weight organic compounds, was low but has previously been suggested as being of minimal importance in soils (Table 2) (Disnar et al. 2003). S2 under C. panamensis decreased slightly from 123 to 118 mg g–1 at 1.5 m, whereas S3CO and S3CO2 increased slightly. TpkS2, matched the trend in S2 values, decreasing at 1.5 m. The lower TpkS2 at 1.5 m (417 °C) is typical for the thermal breakdown of humic substances (Disnar et al. 2003). TOC was high (40–41%) but varied little within the rooting zone. HI decreased from 310 to 290 mg HC g−1 TOCRE6 at 1.5 m, with a concomitant increase in OI from 200 to 221 mg O2 g−1 TOCRE6, although these differences were not significant.
Table 2.
Selected Rock-Eval 6 parameters
| Species | C. panamensis | R. taedigera | ||
|---|---|---|---|---|
| Distance (m) | 0.5 | 1.5 | 0.5 | 1.5 |
| S1 (mg g−1) | 33 ± 3 | 31 ± 2 | 31 ± 2 | 35 ± 2 |
| S2 (mg g−1) | 123 ± 9 | 118 ± 6 | 113 ± 8 | 125 ± 2 |
| S3CO (mg g−1) | 19 ± 2 | 22 ± 1 | 18 ± 1 | 17 ± 1 |
| S3CO2 (mg g−1) | 78 ± 6 | 89 ± 2 | 701 ± 5 | 73 ± 5 |
| TpkS2 (°C) | 426 ± 2 | 417 ± 9 | 414 ± 9 | 422 ± 2 |
| TOCRE (%) | 39 ± 3 | 41 ± 1 | 37 ± 2 | 40 ± 2 |
| HI (mg HC g−1 TOCRE6) | 310 ± 5 | 290 ± 14 | 306 ± 13 | 316 ± 14 |
| OI (mg O2 g−1 TOCRE6) | 200 ± 9 | 221 ± 11 | 191 ± 5 | 185 ± 10 |
Means ± 1 SEM (n = 6)
R. taedigera peats showed significant differences in several Rock-Eval parameters compared to C. panamensis. In contrast to C. panamensis, S2 increased to 125 mg g−1 at 1.5 m from 113 mg g−1 at 0.5 m. There was a significant difference in S3CO (F1,10 = 4.97, p = 0.049) and S3CO2 (F1,10 = 5.16, p = 0.049) between species, with both higher under C. panamensis. Under R. taedigera, TpkS2 increased from 414 °C at 0.5 m to 422 °C at 1.5 m, showing the opposite trend to C. panamensis. TOCRE6 was also somewhat lower, ranging from 37 to 40% but this difference was not significant. In contrast to C. panamensis peats, HI increased from 306 mg HC g−1 TOCRE6 at 0.5 m to 316 mg HC g−1 TOCRE6 at 1.5 m, while OI decreased significantly from 191 mg O2 g−1 TOCRE6 at 0.5 m to 185 mg O2 g−1 TOCRE6 at 1.5 m (F1,10 = 6.37, p = 0.03).
Organic matter indices and carbon stocks
Under both C. panamensis and R. taedigera and at both distances, the peat labile carbon pool (Cl) was consistently the largest (Fig. 3), accounting for 36–42% of hydrocarbons released during pyrolysis (S2). Labile carbon stocks ranged from 2236 to 3065 g m−2 (Fig. 4). Moreover, the pool exhibited contrasting trends between species. For C. panamensis, Cl was greater a 1.5 m compared to 0.5 m, with the opposite trend observed for R. taedigera. The intermediate carbon pool (Ci) ranged from 20 to 34%, the equivalent of 1354–2549 g m−2 carbon stocks. These stocks were significantly higher at 0.5 m compared to 1.5 m (F1,10 = 1.18, p = 0.02). Carbon stocks associated with the passive pool (Cp) also varied significantly with distance from plant stems, increasing at 1.5 m compared to 0.5 m (F1,10 = 6.85, p = 0.03), accounting for 25–35%.
Fig. 3.
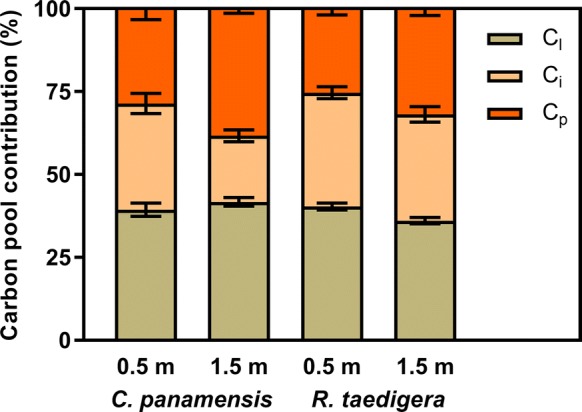
Proportions of peat labile (Cl), intermediate (Ci) and passive (Cp) carbon pools for C. panamensis and R. taedigera in peats 0.5 m and 1.5 m from plant stems. Means ± 1 SEM (n = 6)
Fig. 4.
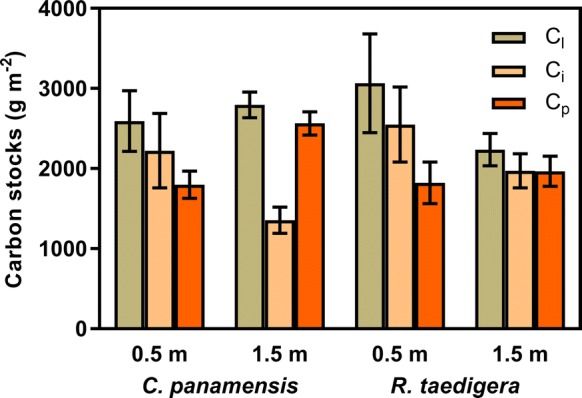
Carbon stocks associated with labile (Cl), intermediate (Ci) and passive (Cp) pools for C. panamensis and R. taedigera in peats 0.5 m and 1.5 m from plant stems. Means ± 1 SEM (n = 6)
The I-index, describing thermally labile organic matter, ranged from 0.017 to 0.057, and the R-index, describing highly thermostable organic matter, ranged from 0.058 to 0.060 (Fig. 5). C. panamensis peats at 0.5 m have low I and high R indices, as were R. taedigera peats at 1.5 m. In contrast, C. panamensis peats at 1.5 m are characterised by high I and low R indices. However, differences for both I and R indices between species, and with distance, were not found to be significant.
Fig. 5.
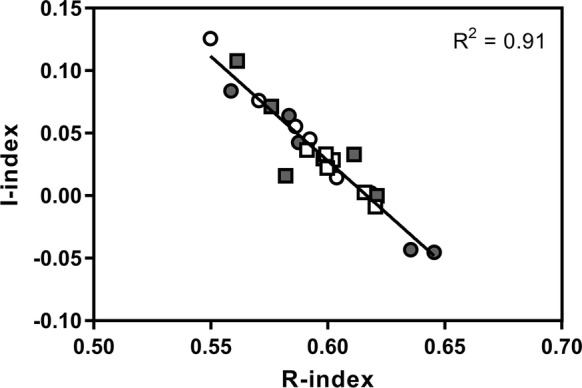
I and R indices for C. panamensis (white) and R. taedigera (grey) peats at 0.5 m (filled square) and 1.5 m (filled circle) from plant stems
Organic matter properties and CO2 and CH4 fluxes
The scores and loadings of the first and second principal components accounted for the majority of the variance (51%) (Fig. 6). Separation along the first principal component is mainly driven by pH, total nitrogen (N), moisture content (SM) and S2, and along the second component by Cl, and fine root biomass. Peats are predominantly clustered by distance from plant stems, with peats from 1.5 m having reduced variation compared to peat from 0.5 m. Linear regression identified a significant relationship between S2 and mean CH4 efflux (F1,22 = 9.25, p = 0.006, R2 = 26.4, Fig. 7), indicating that overall substrate availability, rather than any specific carbon pool, was important in driving fluxes. No significant variables were identified for driving CO2 efflux.
Fig. 6.

a Scores for C. panamensis (white) and R. taedigera (grey) peats at 0.5 m (filled square) and 1.5 m (filled circle) from plant stems. b Loadings from PCA for all species and peats. Combined PC1 and PC2 account for 51% of variance
Fig. 7.
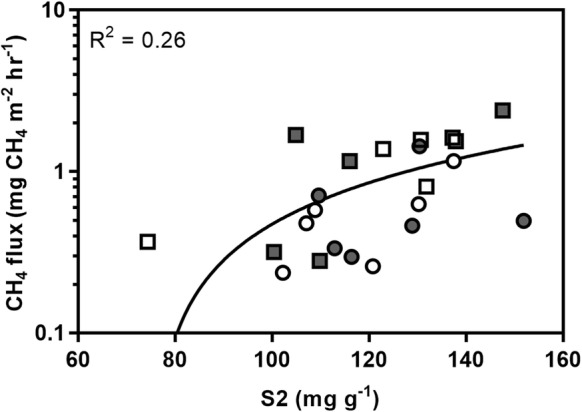
Linear regression of S2 and logged mean CH4 fluxes for C. panamensis (white) and R. taedigera (grey) peats at 0.5 m (filled square) and 1.5 m (filled circle) from plant stems
Discussion
Rooting zone trends in peat biogeochemistry and greenhouse gas fluxes
Changes in fine root biomass with increased distance from plant stems were relatively small and not significant. This may reflect sampling in hollows around plant stems which may feature reduced root biomass compared to hummocks which are formed from roots and fallen leaf litter (Jauhiainen et al. 2005).
pH and organic matter both declined with distance from plant stems under both species, although these differences were only significant for R. taedigera. In general, differences in peat properties between species were reduced compared to previous studies, with only pH differing significantly at 0.5 m. This lack of significant differences is most likely because this study was conducted in a mixed forest rather than monodominant stand which means that peat properties are likely to be influenced to a lesser extent by the previously reported gradient in nutrient availability and microbial communities (Sjögersten et al. 2011; Cheesman et al. 2012; Troxler et al. 2012). Additionally, although individual plants were selected to minimise the presence of nearby understory and canopy vegetation, their influence on peat properties is likely to be limited but cannot be fully discounted.
Aerobic decomposition of organic matter under low water table conditions may drive increases in pH through decarboxylation of organic anions, which involves protonation (Yan et al. 1996). Lower pH with increasing distance from the stems may therefore be associated with reduced decomposition rates, which is supported by increased organic matter content and Ci carbon stocks. Previous studies have indicated that carbon inputs within the rooting zone can substantially increase decomposition, with species specific effects (Kuzyakov and Cheng 2001; Cheng et al. 2003). Changes in pH have been identified as significant drivers of changes to soil microbial communities (Shi et al. 2011). The lack of significant difference in dehydrogenase activity, used as an overall measure of microbial activity, may be associated with the high organic matter content, as activity is unlikely to be carbon substrate limited.
CO2 fluxes did not decline with distance under either species, possibly due to limited differences in root density. Declines in root biomass might have been expected to be associated with lower root-derived CO2. Estimates of root respiration in tropical sites are variable, accounting for up to two-thirds of total CO2 flux from forested peatlands in Malaysia and Panama (Melling et al. 2013; Girkin et al. 2018c), but varying from 24 to 61% in Amazon forests (Silver et al. 2005; Metcalfe et al. 2007). CO2 emissions can also be driven by microbial utilisation of root exudates and peat organic matter, and the oxidation of CH4 (Wright et al. 2013a).
In contrast to CO2 fluxes, CH4 varied significantly within the rooting zone under both species, being significantly higher at 0.5 m compared to 1.5 m. Previous work in rice has suggested that labile root exudates are the most substrate for methanogenic Archaea (Lu and Conrad 2005) and inputs may be greater close to plant stems. Methanogen abundance has previously been found to be higher in organic matter rhizosphere in a wetland soil (Pajares et al. 2016) and, in conjunction with variation in OM properties, may account for the observed fluxes. The smaller differences in CH4 fluxes between R. taedigera may in part be driven by greater inputs of root oxygen which drive the oxidation of CH4 (Hoyos-Santillan et al. 2016a).
Organic matter properties and thermal stability
Deconvolution of the S2 pyrograms into F1–F6 fractions has previously been used to assess the thermal stability of organic matter through changes in the relative proportions of pools of organic polymers and carbon stocks (Saenger et al. 2013). However, there are significant drawbacks in assessing proportional changes in pool sizes due to a decrease in one pool increasing the size of one or both of the other pools. Previous comparisons of F1–F6 with FTIR (Delarue et al. 2013; Biester et al. 2014) and 13C NMR (Albrecht et al. 2015), indicate only a partial correlation with distinct functional groups as different biomolecules, such as lignin and cellulose, frequently pyrolyse at the same temperature (Disnar et al. 2003). Changes in Cl, Ci and Cp therefore indicate broad scale patterns in thermal stability driven by organic matter degradation rather than changes in any one specific functional group (Sebag et al. 2016). Surface peats at all distances showed large overall carbon stocks with a significant contribution to the overall pool size by labile biopolymers. The labile pool is highly sensitive to mineralisation and may therefore be particularly vulnerable to loss due to climate change. CH4 fluxes have been shown to be highly impacted by increased temperature at the site, which can deplete labile carbon, with the precise effect differing between peats derived from contrasting botanical origins (Sjögersten et al. 2018). These results also demonstrate that carbon stocks can be highly heterogenous on relatively short spatial scales, in addition to previously reported variation between different plant communities (Upton et al. 2018).
High rates of microbial activity may have been expected to rapidly deplete Cl, but it is possible that root exudates and recent root necromass represent a significant and regular carbon input under both species thereby maintaining a large overall pool. Ci and Cp combined indicate a large pool of humified compounds, most likely derived gradual decomposition of recent litter inputs (Disnar et al. 2003). Overall, deconvolution indicates that rooting zone peats are highly heterogeneous but generally feature a large labile carbon pool, likely derived from fresh litter inputs, in addition to quantities of thermostable biopolymers and humic substances derived from ongoing decomposition processes.
There was no consistent significant pattern in I and R indices with distance from plant stems or peat botanical origin. This may be because this approach for assessing organic matter dynamics is better suited to indicting broader temporal or spatial changes with depth (Sebag et al. 2016), with comparatively smaller changes occurring over short distances in a highly heterogeneous landscape. For example, these indices have previously been applied in demonstrating variation along a beech plantation chronosequence and changes during composting. The decrease in the contribution of biopolymers (A1 and A2) occurs simultaneously with increases in geopolymers (A3 and A4) resulting in a high correlation between the indices (R2 = 0.91), demonstrating the relationship between decreasing relative contributions from labile organic matter, and increases in recalcitrant pools (Sebag et al. 2016).
Previous studies have demonstrated that OI and HI are reliable indicators of soil organic matter maturation, although changes are partially relative (Disnar et al. 2003; Hetenyi et al. 2005; Saenger et al. 2013), with high HI values (over 300 mg HC g−1 TOC) driven by minimally degraded plant tissues rich in polysaccharides, and lower values associated with woody materials with high cellulose and lignin (Marchand et al. 2008). During humification, HI decreases due to increasing aromaticity and dehydrogenation, and OI increases through oxidation, although high values can also be associated with polysaccharides which are relatively rich in oxygen (Hetenyi et al. 2006; Carrie et al. 2012; Sebag et al. 2016). This has been found to be particularly apparent in subsurface peat layers where TpkS2 increases and HI decreases due to the reduced contribution of fresh litter inputs with high carbohydrate, protein and lipid contents (Disnar et al. 2003; Upton et al. 2018). Alternatively, reduced HI may be caused by an increased proportion of highly aromatic organic matter, which also has low HI values (Saenger et al. 2013).
Small scale variation in organic matter properties
Contrasts in peat organic matter properties with distance from stems between species are likely to reflect the interaction of a range of biotic and abiotic environmental variables. Leaf, stem and shoot litter from C. panamensis and R. taedigera litter have previously explained differences in litter decomposition rates within depth profiles (Hoyos-Santillan et al. 2016b). In surface peats R. taedigera litter decomposes faster than C. panamensis litter, possibly because of higher nitrogen content. However, in waterlogged soils the inhibition of aerobic ligninolytic microorganisms reduces decomposition of lignin rich R. taedigera litter (Zeikus 1981). Differences in plant morphology may also account for some variation in observed organic matter properties. C. panamensis has large buttress roots compared to large surface root mats and pneumatophores under R. taedigera. C. panamensis has small leaves which are likely to represent a more regular carbon input, compared to large palm fronds from R. taedigera which will represent a single larger carbon pulse in surface peats (Wright et al. 2013b). Differences in rooting structure can, in turn, strongly influence peat surface microtopography resulting in distinctive raised hummocks and slight depressions (hollows). While the former are often above the water table, hollows can undergo distinct phases of immersion and exposure depending on precipitation (Jauhiainen et al. 2005). Previously the water table at the site has been reported to change by up to 20 cm (Wright et al. 2013b). In part, the influence of microtopography on fluxes was controlled by sampling only in hollows which remained continually inundated during the sampling period with the water table remaining just above the peat surface. Differences in organic matter properties, for example relative changes in Cl, Ci and Cp, between peats derived from contrasting botanical origins may indeed be more pronounced between hummocks and hollows in part due to contrasts in litter decomposition under fluctuating aerobic vs anoxic conditions (Jauhiainen et al. 2005).
Vegetation is known to strongly determine microbial communities with both plant species and developmental stage and health known to be important biotic drivers (Berg and Smalla 2009). Work in temperate and boreal peatlands has indicated that differences in botanical composition are associated with differences in bacterial communities, with resultant effects on CH4 cycling (Borga et al. 1994; Robroek et al. 2015), while work in tropical forests has similarly indicated that microbial communities can vary along plant diversity gradients with C:N (Carney and Matson 2006) and phosphorous availability (Troxler et al. 2012) identified as a key driver of changes in community composition.
In this study the observed contrasting trends in peat organic matter properties with distance under each species are therefore likely to be driven by previously identified contrasts in litter properties, plant morphologies, microtopography, peat biogeochemical properties (particularly pH and C:N and the relative size of carbon pools), and microbial communities. The greater variability in peat properties at 0.5 m compared to 1.5 m likely reflects the role of changes in fine root biomass, which can mediate peat pH and other properties (including redox potential and conductivity) through species specific inputs of exudates (Girkin et al. 2018a, b) and oxygen (Hoyos-Santillan et al. 2016a).
Linking organic matter properties and greenhouse gas fluxes
CH4 fluxes were not linked to any individual carbon pool but rather the total size of the relatively labile pool as measured by S2. As methanogens are only able to utilise a limited number of substrates, of which acetate is the most important (Ferry 1992), other microbial groups are likely to be mediating the availability of substrates for methanogenesis. This result highlights the importance of differences in vegetation as a driver of net CH4 fluxes from peatlands, as changes in dominant vegetation type will alter root and litter inputs, changing substrate availability for methanogenesis.
In contrast to CH4 production, no significant relationships between CO2 fluxes and peat properties were identified. This may indicate that environmental variables not measured were most responsible for driving CO2 fluxes rather than substrate availability. In addition, CO2 fluxes may have been driven to a significant degree by either the oxidation of CH4 or root respiration (Kuzyakov and Larionova 2006; Girkin et al. 2018c). Generally, surface peat between 0–30 cm is the main source of CO2 and CH4 production but some is produced at significant depth and will therefore be associated with different trends in organic chemistry (Wright et al. 2011). Gaseous transport via plant aerenchyma may also reduce surface fluxes of both gases (Pangala et al. 2017). As a consequence, ex situ incubation experiments may represent a useful approach for fully elucidating the relationships between organic matter properties and the regulation of decomposition and GHG production.
Conclusion
Peats derived from C. panamensis and R. taedigera display significant heterogeneity of biogeochemical properties (pH, total carbon, and organic matter content) within the rooting zone. Changes in the three carbon pools derived from S2 pyrograms, combined with trends in HI and OI highlight how the different litter properties of C. panamensis and R. taedigera interact with the environment to drive decomposition. Surface peats feature a large stock of readily mineralisable labile carbon (up to 3065 g m−2, equivalent to 42% of surface carbon stocks) which may be particularly vulnerable to climate change. Net CH4 but not CO2 fluxes were closely associated to the overall size of the organic matter pool, rather than any one specific group of biomolecules. Collectively, these results demonstrate tropical peats derived from beneath contrasting vegetation types can exhibit significant small scale variation in soil organic matter properties which can influence GHG emissions. However, further assessments under controlled conditions are required to discount the heterogeneous contributions of plant roots and environmental conditions in situ and indicate additional relationships between GHG fluxes and peat organic matter properties. Our findings lead us to propose that changes in dominant vegetation caused by climate or land use change are likely to affect CH4 effluxes in tropical peatlands if associated with changes in organic carbon pool size.
Electronic supplementary material
Below is the link to the electronic supplementary material.
Acknowledgements
This work was supported by the Natural Environment Research Council [Grant Number NE/R010226/1], and a Smithsonian Tropical Research Institute short-term fellowship. We would also like to thank Eric Brown for his support in the field, the staff at the Smithsonian Tropical Research Institute in Panama City and Bocas Del Toro for their logistical support, and James Verran and Saul Vasquez Reina at the University of Nottingham. CHV publishes with the permission of the Executive Director of the British Geological Survey (NERC).
Footnotes
Publisher's Note Springer Nature remains neutral with regard to jurisdictional claims in published maps and institutional affiliations.
References
- Albrecht R, Sebag D, Verrecchia E. Organic matter decomposition: bridging the gap between Rock-Eval pyrolysis and chemical characterization (CPMAS C-13 NMR) Biogeochemistry. 2015;122:101–111. doi: 10.1007/s10533-014-0033-8. [DOI] [Google Scholar]
- Ayres E, Steltzer H, Simmons BL, Simpson RT, Steinweg JM, Wallenstein MD, Mellor N, Parton WJ, Moore JC, Wall DH. Home-field advantage accelerates leaf litter decomposition in forests. Soil Biol Biochem. 2009;41:606–610. doi: 10.1016/j.soilbio.2008.12.022. [DOI] [Google Scholar]
- Barre P, Plante AF, Cecillon L, Lutfalla S, Baudin F, Bernard S, Christensen BT, Eglin T, Fernandez JM, Houot S, Katterer T, Le Guillou C, Macdonald A, Van Oort F, Chenu C. The energetic and chemical signatures of persistent soil organic matter. Biogeochemistry. 2016;130:1–12. doi: 10.1007/s10533-016-0246-0. [DOI] [Google Scholar]
- Bauhus J, Bartsch N. Fine-root growth in beech (Fagus sylvatica) forest gaps. Can J For Res. 1996;26:2153–2159. doi: 10.1139/x26-244. [DOI] [Google Scholar]
- Behar F, Beaumont V, De B. Penteado HL. Rock-Eval 6 technology: performances and developments. Oil Gas Sci Technol. 2001;56:111–134. doi: 10.2516/ogst:2001013. [DOI] [Google Scholar]
- Berg G, Smalla K. Plant species and soil type cooperatively shape the structure and function of microbial communities in the rhizosphere. FEMS Microbiol Ecol. 2009;68:1–13. doi: 10.1111/j.1574-6941.2009.00654.x. [DOI] [PubMed] [Google Scholar]
- Biester H, Knorr KH, Schellekens J, Basler A, Hermanns YM. Comparison of different methods to determine the degree of peat decomposition in peat bogs. Biogeosciences. 2014;11:2691–2707. doi: 10.5194/bg-11-2691-2014. [DOI] [Google Scholar]
- Borga P, Nilsson M, Tunlid A. Bacterial communities in peat in relation to botanical composition as revealed by phospholipid fatty-acid analysis. Soil Biol Biochem. 1994;26:841–848. doi: 10.1016/0038-0717(94)90300-X. [DOI] [Google Scholar]
- Carney KM, Matson PA. The influence of tropical plant diversity and composition on soil microbial communities. Microb Ecol. 2006;52:226–238. doi: 10.1007/s00248-006-9115-z. [DOI] [PubMed] [Google Scholar]
- Carrie J, Sanei H, Stern G. Standardisation of Rock-Eval pyrolysis for the analysis of recent sediments and soils. Org Geochem. 2012;46:38–53. doi: 10.1016/j.orggeochem.2012.01.011. [DOI] [Google Scholar]
- Cheesman AW, Turner BL, Reddy KR. Soil phosphorus forms along a strong nutrient gradient in a tropical ombrotrophic wetland. Soil Sci Soc Am J. 2012;76:1496–1506. doi: 10.2136/sssaj2011.0365. [DOI] [Google Scholar]
- Cheng WX, Johnson DW, Fu SL. Rhizosphere effects on decomposition: controls of plant species, phenology, and fertilization. Soil Sci Soc Am J. 2003;67:1418–1427. doi: 10.2136/sssaj2003.1418. [DOI] [Google Scholar]
- Comeau L-P, Hergualc’h K, Smith JU, Verchot LV. Conversion of intact peat swamp forest to oil palm plantation: effects on soil CO2 fluxes in Jambi, Sumatra. Working paper 110. Bogor: CIFOR; 2013. [Google Scholar]
- Dargie GC, Lewis SL, Lawson IT, Mitchard ETA, Page SE, Bocko YE, Ifo SA. Age, extent and carbon storage of the central Congo Basin peatland complex. Nature. 2017;542:86–90. doi: 10.1038/nature21048. [DOI] [PubMed] [Google Scholar]
- Delarue F, Disnar JR, Copard Y, Gogo S, Jacob J, Laggoun-Defarge F. Can Rock-Eval pyrolysis assess the biogeochemical composition of organic matter during peatification? Org Geochem. 2013;61:66–72. doi: 10.1016/j.orggeochem.2013.06.004. [DOI] [Google Scholar]
- Disnar JR, Guillet B, Keravis D, Di-Giovanni C, Sebag D. Soil organic matter (SOM) characterization by Rock-Eval pyrolysis: scope and limitations. Org Geochem. 2003;34:327–343. doi: 10.1016/S0146-6380(02)00239-5. [DOI] [Google Scholar]
- Ferry JG. Methane from acetate. J Bacteriol. 1992;174:5489–5495. doi: 10.1128/jb.174.17.5489-5495.1992. [DOI] [PMC free article] [PubMed] [Google Scholar]
- Girkin NT, Turner BL, Ostle N, Craigon J, Sjögersten S. Root exudate analogues accelerate CO2 and CH4 production in tropical peat. Soil Biol Biochem. 2018;117:48–55. doi: 10.1016/j.soilbio.2017.11.008. [DOI] [Google Scholar]
- Girkin NT, Turner BL, Ostle N, Sjögersten S. Composition and concentration of root exudate analogues regulate greenhouse gas fluxes from tropical peat. Soil Biol Biochem. 2018;128:180–285. [Google Scholar]
- Girkin NT, Turner BL, Ostle N, Sjögersten S. Root exudate analogues accelerate CO2 and CH4 production in tropical peat. Wetl Ecol Manag. 2018;26:985–991. doi: 10.1007/s11273-018-9617-8. [DOI] [Google Scholar]
- Gomes NCM, Fagbola O, Costa R, Rumjanek NG, Buchner A, Mendona-Hagler L, Smalla K. Dynamics of fungal communities in bulk and maize rhizosphere soil in the tropics. Appl Environ Microbiol. 2003;69:3758–3766. doi: 10.1128/AEM.69.7.3758-3766.2003. [DOI] [PMC free article] [PubMed] [Google Scholar]
- Grayson R, Holden J. Continuous measurement of spectrophotometric absorbance in peatland streamwater in northern England: implications for understanding fluvial carbon fluxes. Hydrol Process. 2012;26:27–39. doi: 10.1002/hyp.8106. [DOI] [Google Scholar]
- Hare AA, Kuzyk ZZA, Macdonald RW, Sanei H, Barber D, Stern GA, Wang FY. Characterization of sedimentary organic matter in recent marine sediments from Hudson Bay, Canada, by Rock-Eval pyrolysis. Org Geochem. 2014;68:52–60. doi: 10.1016/j.orggeochem.2014.01.007. [DOI] [Google Scholar]
- Hergoualac’h K, Hendry DT, Murdiyarso D, Verchot LV. Total and heterotrophic soil respiration in a swamp forest and oil palm plantations on peat in Central Kalimantan, Indonesia. Biogeochemistry. 2017;13:203–220. doi: 10.1007/s10533-017-0363-4. [DOI] [Google Scholar]
- Hetenyi M, Nyilas T, Toth TM. Stepwise Rock-Eval pyrolysis as a tool for typing heterogeneous organic matter in soils. J Anal Appl Pyrol. 2005;74:45–54. doi: 10.1016/j.jaap.2004.11.012. [DOI] [Google Scholar]
- Hetenyi M, Nyilas T, Sajgo C, Brukner-Wein A. Heterogeneous organic matter from the surface horizon of a temperate zone marsh. Org Geochem. 2006;37:1931–1942. doi: 10.1016/j.orggeochem.2006.07.019. [DOI] [Google Scholar]
- Hinsinger P, Gilkes RJ. Mobilization of phosphate from phosphate rock and alumina-sorbed phosphate by the roots of ryegrass and clover as related to rhizosphere pH. Eur J Soil Sci. 1996;47:533–544. doi: 10.1111/j.1365-2389.1996.tb01853.x. [DOI] [Google Scholar]
- Hogg EH, Lieffers VJ, Wein RW. Potential carbon losses from peat profiles—effects of temperature, drought cycles, and fire. Ecol Appl. 1992;2:298–306. doi: 10.2307/1941863. [DOI] [PubMed] [Google Scholar]
- Hoyos-Santillan J, Lomax BH, Large D, Turner BL, Boom A, Lopez OR, Sjögersten S. Getting to the root of the problem: litter decomposition and peat formation in lowland neotropical peatlands. Biogeochemistry. 2015;126:115–129. doi: 10.1007/s10533-015-0147-7. [DOI] [Google Scholar]
- Hoyos-Santillan J, Craigon J, Lomax BH, Lopez OR, Turner BL, Sjögersten S. Root oxygen loss from Raphia taedigera palms mediates greenhouse gas emissions in lowland sneotropical peatlands. Plant Soil. 2016;404:47–60. doi: 10.1007/s11104-016-2824-2. [DOI] [Google Scholar]
- Hoyos-Santillan J, Lomax BH, Large D, Turner BL, Boom A, Lopez OR, Sjogersten S. Quality not quantity: organic matter composition controls of CO2 and CH4 fluxes in neotropical peat profiles. Soil Biol Biochem. 2016;103:86–96. doi: 10.1016/j.soilbio.2016.08.017. [DOI] [Google Scholar]
- Jauhiainen JTH, Heikkinen J, Martikainen P, Vasander H. Carbon fluxes from a tropical peat swamp forest floor. Glob Change Biol. 2005;11:1788–1797. doi: 10.1111/j.1365-2486.2005.001031.x. [DOI] [Google Scholar]
- Keiser AD, Keiser DA, Strickland MS, Bradford MA. Disentangling the mechanisms underlying functional differences among decomposer communities. J Ecol. 2014;102:603–609. doi: 10.1111/1365-2745.12220. [DOI] [Google Scholar]
- Kuzyakov Y, Cheng W. Photosynthesis controls of rhizosphere respiration and organic matter decomposition. Soil Biol Biochem. 2001;33:1915–1925. doi: 10.1016/S0038-0717(01)00117-1. [DOI] [Google Scholar]
- Kuzyakov YV, Larionova AA. Contribution of rhizomicrobial and root respiration to the CO2 emission from soil (a review) Eurasian Soil Sci. 2006;39:753–764. doi: 10.1134/S106422930607009X. [DOI] [Google Scholar]
- Landi L, Valori F, Ascher J, Renella G, Falchini L, Nannipieri P. Root exudate effects on the bacterial communities, CO2 evolution, nitrogen transformations and ATP content of rhizosphere and bulk soils. Soil Biol Biochem. 2006;38:509–516. doi: 10.1016/j.soilbio.2005.05.021. [DOI] [Google Scholar]
- Lu YH, Conrad R. In situ stable isotope probing of methanogenic archaea in the rice rhizosphere. Science. 2005;309:1088–1090. doi: 10.1126/science.1113435. [DOI] [PubMed] [Google Scholar]
- Marchand C, Lallier-Verges E, Disnar JR, Keravis D. Organic carbon sources and transformations in mangrove sediments: a Rock-Eval pyrolysis approach. Org Geochem. 2008;39:408–421. doi: 10.1016/j.orggeochem.2008.01.018. [DOI] [Google Scholar]
- Matysek M, Evers S, Samuel MK, Sjogersten S. High heterotrophic CO2 emissions from a Malaysian oil palm plantations during dry-season. Wetl Ecol Manag. 2017;26:415–424. doi: 10.1007/s11273-017-9583-6. [DOI] [Google Scholar]
- Melling L, Tan CSY, Goh KJ, Hatano R. Soil microbial and root respirations from three ecosystems in tropical peatland of Sarawak, Malaysia. J Oil Palm Res. 2013;25:44–57. [Google Scholar]
- Metcalfe DB, Meir P, Aragao LEOC, Malhi Y, Da Costa ACL, Braga A, Goncalves PHL, De Athaydes J, De Almeida SS, Williams M. Factors controlling spatio-temporal variation in carbon dioxide efflux from surface litter, roots, and soil organic matter at four rain forest sites in the eastern Amazon. J Geophys Res Biogeosci. 2007 [Google Scholar]
- Mulia R, Dupraz C. Unusual fine root distributions of two deciduous tree species in southern France: what consequences for modelling of tree root dynamics? Plant Soil. 2006;281:71–85. doi: 10.1007/s11104-005-3770-6. [DOI] [Google Scholar]
- Ohlinger R. Dehydrogenase activity with the substrate TTC. In: Schinner F, Ohlinger R, Kandeler E, Margesin R, editors. Methods in soil biology. Berlin: Springer; 1995. [Google Scholar]
- Outridge PM, Sanei H. Does organic matter degradation affect the reconstruction of pre-industrial atmospheric mercury deposition rates from peat cores? A test of the hypothesis using a permafrost peat deposit in northern Canada. Int J Coal Geol. 2010;83:78–81. doi: 10.1016/j.coal.2010.04.004. [DOI] [Google Scholar]
- Page SE, Rieley JO, Banks CJ. Global and regional importance of the tropical peatland carbon pool. Glob Change Biol. 2011;17:798–818. doi: 10.1111/j.1365-2486.2010.02279.x. [DOI] [Google Scholar]
- Pajares S, Bohannan BJM, Souza V. Editorial: The role of microbial communities in tropical ecosystems. Front Microbiol. 2016;7:1805. doi: 10.3389/fmicb.2016.01805. [DOI] [PMC free article] [PubMed] [Google Scholar]
- Pangala SR, Enrich-Prast A, Basso LS, Peixoto RB, Bastviken D, Hornibrook ERC, Gatti LV, Marotta H, Calazans LSB, Sakuragui CM, Bastos WR, Malm O, Gloor E, Miller JB, Gauci V. Large emissions from floodplain trees close the Amazon methane budget. Nature. 2017;552:230–234. doi: 10.1038/nature24639. [DOI] [PubMed] [Google Scholar]
- Phillips S, Rouse GE, Bustin RM. Vegetation zones and diagnostic pollen profiles of a coastal peat swamp, Bocas del Toro, Panama. Palaeogeogr Palaeoclimatol Palaeoecol. 1997;128:301–338. doi: 10.1016/S0031-0182(97)81129-7. [DOI] [Google Scholar]
- Robroek BJM, Jassey VEJ, Kox MAR, Berendsen RL, Mills RTE, Cecillon L, Puissant J, Meima-Franke M, Bakker PAHM, Bodelier PLE. Peatland vascular plant functional types affect methane dynamics by altering microbial community structure. J Ecol. 2015;103:925–934. doi: 10.1111/1365-2745.12413. [DOI] [Google Scholar]
- Saenger A, Cecillon L, Sebag D, Brun JJ. Soil organic carbon quantity, chemistry and thermal stability in a mountainous landscape: a Rock-Eval pyrolysis survey. Org Geochem. 2013;54:101–114. doi: 10.1016/j.orggeochem.2012.10.008. [DOI] [Google Scholar]
- Sayer EJ, Tanner EVJ. A new approach to trenching experiments for measuring root-rhizosphere respiration in a lowland tropical forest. Soil Biol Biochem. 2010;42:347–352. doi: 10.1016/j.soilbio.2009.11.014. [DOI] [Google Scholar]
- Sebag D, Disnar JR, Guillet B, Di Giovanni C, Verrecchia EP, Durand A. Monitoring organic matter dynamics in soil profiles by ‘Rock-Eval pyrolysis’: bulk characterization and quantification of degradation. Eur J Soil Sci. 2006;57:344–355. doi: 10.1111/j.1365-2389.2005.00745.x. [DOI] [Google Scholar]
- Sebag D, Verrecchia EP, Cecillon L, Adatte T, Albrecht R, Aubert M, Bureau F, Cailleau G, Copard Y, Decaens T, Disnar JR, Hetenyi M, Nyilas T, Trombino L. Dynamics of soil organic matter based on new Rock-Eval indices. Geoderma. 2016;284:185–203. doi: 10.1016/j.geoderma.2016.08.025. [DOI] [Google Scholar]
- Shi SJ, Richardson AE, O’Callaghan M, Deangelis KM, Jones EE, Stewart A, Firestone MK, Condron LM. Effects of selected root exudate components on soil bacterial communities. FEMS Microbiol Ecol. 2011;77:600–610. doi: 10.1111/j.1574-6941.2011.01150.x. [DOI] [PubMed] [Google Scholar]
- Silver WL, Thompson AW, McGroddy ME, Varner RK, Dias JD, Silva H, Crill PM, Keller M. Fine root dynamics and trace gas fluxes in two lowland tropical forest soils. Glob Change Biol. 2005;11:290–306. doi: 10.1111/j.1365-2486.2005.00903.x. [DOI] [Google Scholar]
- Sjögersten S, Cheesman AW, Lopez O, Turner BL. Biogeochemical processes along a nutrient gradient in a tropical ombrotrophic peatland. Biogeochemistry. 2011;104:147–163. doi: 10.1007/s10533-010-9493-7. [DOI] [Google Scholar]
- Sjögersten S, Aplin P, Gauci V, Peacock M, Siegenthaler A, Turner BL. Temperature response of ex situ greenhouse gas emissions from tropical peatlands: interactions between forest type and peat moisture conditions. Geoderma. 2018;324:47–55. doi: 10.1016/j.geoderma.2018.02.029. [DOI] [Google Scholar]
- Taskinen O, Ilvesniemi H, Kuuluvainen T, Leinonen K. Response of fine roots to an experimental gap in a boreal Picea abies forest. Plant Soil. 2003;255:503–512. doi: 10.1023/A:1026077830097. [DOI] [Google Scholar]
- Tonks AJ, Aplin P, Beriro DJ, Cooper H, Evers S, Vane CH, Sjogersten S. Impacts of conversion of tropical peat swamp forest to oil palm plantation on peat organic chemistry, physical properties and carbon stocks. Geoderma. 2017;289:36–45. doi: 10.1016/j.geoderma.2016.11.018. [DOI] [Google Scholar]
- Troxler TG, Ikenaga M, Scinto L, Boyer JN, Condit R, Perez R, Gann GD, Childers DL. Patterns of soil bacteria and canopy community structure related to tropical peatland development. Wetlands. 2012;32:769–782. doi: 10.1007/s13157-012-0310-z. [DOI] [Google Scholar]
- Turetsky MR, Kotowska A, Bubier J, Dise NB, Crill P, Hornibrook ERC, Minkkinen K, Moore TR, Myers-Smith IH, Nykanen H, Olefeldt J, Rinne J, Saarnio S, Shurpali N, Tuittila F, Waddington JM, White JR, Wickland KP, Wilmking M. A synthesis of methane emissions from 71 northern, temperate, and subtropical wetlands. Glob Change Biol. 2014;20:2183–2197. doi: 10.1111/gcb.12580. [DOI] [PubMed] [Google Scholar]
- Upton A, Vane CH, Girkin N, Turner BL, Sjögersten S. Does litter input determine carbon storage and peat organic chemistry in tropical peatlands? Geoderma. 2018;326:76–87. doi: 10.1016/j.geoderma.2018.03.030. [DOI] [Google Scholar]
- Uyguner CS, Bekbolet M. Implementation of spectroscopic parameters for practical monitoring of natural organic matter. Desalination. 2005;176:47–55. doi: 10.1016/j.desal.2004.10.027. [DOI] [Google Scholar]
- Wright EL, Black CR, Cheesman AW, Drage T, Large D, Turner BL, Sjögersten S. Contribution of subsurface peat to CO2 and CH4 fluxes in a neotropical peatland. Glob Change Biol. 2011;17:2867–2881. doi: 10.1111/j.1365-2486.2011.02448.x. [DOI] [Google Scholar]
- Wright EL, Black CR, Cheesman AW, Turner BL, Sjögersten S. Impact of simulated changes in water table depth on ex situ decomposition of leaf litter from a neotropical peatland. Wetlands. 2013;33:217–226. doi: 10.1007/s13157-012-0369-6. [DOI] [Google Scholar]
- Wright EL, Black CR, Turner BL, Sjögersten S. Environmental controls of temporal and spatial variability in CO2 and CH4 fluxes in a neotropical peatland. Glob Change Biol. 2013;19:3775–3789. doi: 10.1111/gcb.12330. [DOI] [PubMed] [Google Scholar]
- Yan F, Schubert S, Mengel K. Soil pH increase due to biological decarboxylation of organic anions. Soil Biol Biochem. 1996;28:617–624. doi: 10.1016/0038-0717(95)00180-8. [DOI] [Google Scholar]
- Youssef RA, Chino M. Root-induced changes in the rhizosphere of plants. 1. pH changes in relation to the bulk soil. Soil Sci Plant Nutr. 1989;35:461–468. doi: 10.1080/00380768.1989.10434779. [DOI] [Google Scholar]
- Zeikus JG. Lignin metabolism and the carbon-cycle—polymer biosynthesis, biodegradation, and environmental recalcitrance. Adv Microb Ecol. 1981;5:211–243. doi: 10.1007/978-1-4615-8306-6_5. [DOI] [Google Scholar]
Associated Data
This section collects any data citations, data availability statements, or supplementary materials included in this article.