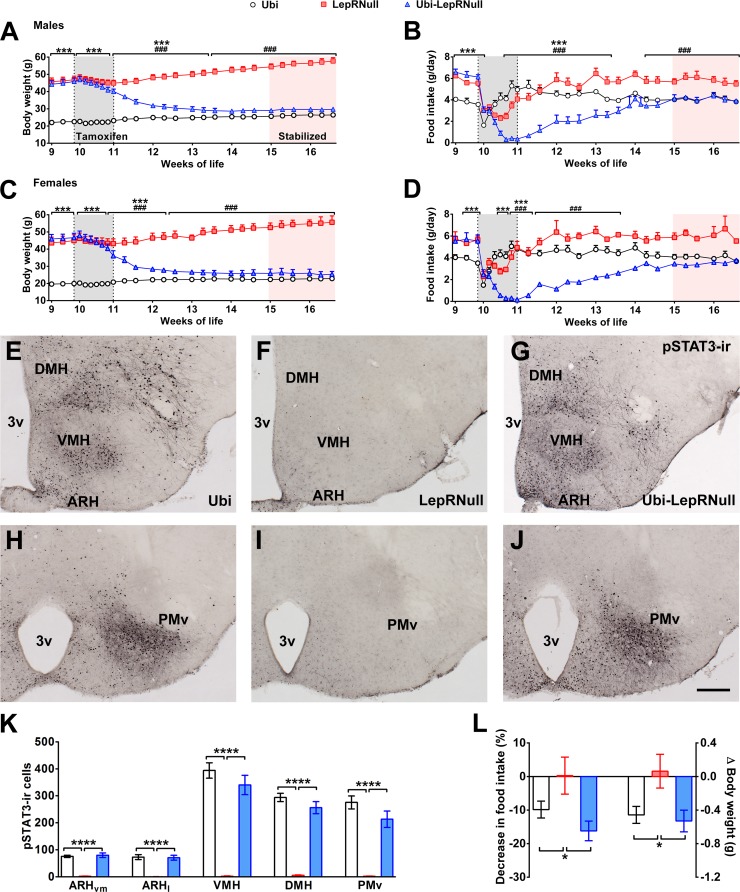
Figure 1. Validation of LepR reactivation in 10-week-old mice.
(A) Body weight of male mice (main effect of Genotype [F(2, 23)=153.7, p<0.0001], main effect of Time [F(24, 552)=22.37, p<0.0001] and interaction [F(48, 552)=105.5, p<0.0001]; n = 6–12) before, during and after tamoxifen treatment at 10 weeks of age. (B) Food intake of male mice (main effect of Genotype [F(2, 23)=14.13, p<0.0001], main effect of Time [F(23, 529)=29.30, p<0.0001] and interaction [F(46, 529)=18.58, p<0.0001]; n = 5–12). (C) Body weight of female mice (main effect of Genotype [F(2, 19)=154.1, p<0.0001], main effect of Time [F(24, 456)=23.75, p<0.0001] and interaction [F(48, 456)=114.5, p<0.0001]; n = 2–16). (D) Food intake of female mice (main effect of Genotype [F(2, 15)=3.779, p=0.0469], main effect of Time [F(23, 345)=8.386, p<0.0001] and interaction [F(46, 345)=5.435, p<0.0001]; n = 1–13). ### p<0.0001 Ubi-LepRNull vs LepRNull mice. ***p<0.0001 Ubi-LepRNull vs Ubi mice. (E–J) Brightfield photomicrographs of pSTAT3 immunoreactive neurons in Ubi (E, H), LepRNull (F, I) and Ubi-LepRNull mice (G, J) after an acute leptin injection (5 µg/g b.w.). 3 v, third ventricle. Scale Bar = 200 µm. (K) Number of pSTAT3 cells after an i.p. leptin injection (n = 5–6). ***p<0.001. (L) Acute changes in food intake (left panel) (F(2, 28)=5.927, *p=0.0071, n = 8–13) and body weight (right panel) (F(2, 33)=4.524, *p=0.0184, n = 8–18) after an i.p. leptin injection (2.5 µg/g b.w.) in comparison to PBS injection (Figure 1—source data 1).

