Abstract
High-throughput, targeted metabolomics was used to identify early time point small intestine and plasma metabolite markers of gastrointestinal acute radiation syndrome. The small intestine metabolite markers were cross-correlated to plasma metabolites in order to identify minimally invasive circulating markers. The radiation exposure covered lethal and sub-lethal gastrointestinal acute radiation syndrome. The small intestine and plasma metabolite profiles were generated at 1 and 3 days post-exposure following total-body irradiation. The small intestine and plasma metabolite profiles for mice receiving radiation at day 1 and 3 post-exposure were significantly different from sham-irradiated mice. There were 14 metabolite markers identified at day 1 and 18 metabolite markers at day 3 that were small intestine-specific plasma markers of gastrointestinal acute radiation syndrome. A number of the identified metabolites at day 1 were amino acids. Dysregulation of amino acid metabolism at 24-hours post total-body irradiation provides potential insight into the initial inflammatory response during gastrointestinal acute radiation syndrome.
Keywords: biological indicators, radiation damage, gastrointestinal tract, whole body irradiation
INTRODUCTION
The adverse health effects of exposure to high-dose irradiation are well-documented (Dainiak et al. 2003; Williams et al. 2010). The gastrointestinal (GI) system, specifically the rapidly proliferating cell populations of the small intestine, is acutely prone to injury following radiation exposure (Potten 1990). Injury to the small intestine from high-dose radiation exposure is evident within a few days with morbidity and mortality being dose- and time-dependent. The physiological effects from radiation-induced GI injury can be seen in weight loss and diarrhea with progression to dehydration and intestinal infection. The concomitant pathology viewed via histopathology details a dose- and time-dependent killing of crypt clonogenic cells, followed by diminished villi cellular output resulting in tissue damage to the mucosal layer of the small intestine (Booth and Potten 2002). Currently, there are no U.S. Food and Drug Administration (FDA) approved medical countermeasures (MCM) to treat the effects of GI injury from radiation exposure. To this end, the Medical Countermeasures Against Radiological Threats (MCART) consortium has established animal models adhering to the FDA’s Animal Rule in order to address critical knowledge gaps associated with radiation-induced GI injury and provide a means for testing MCM efficacy under the animal rule criteria (MacVittie 2012).
One such knowledge gap is identifying tissue-specific biological markers (i.e., biomarkers) that can inform on injury status (i.e., diagnostic potential), predict injury outcome (i.e., prognostic potential), and corroborate MCM efficacy (i.e., drug development tool) (Jones et al. 2014). In the case of radiation-induced GI injury, plasma citrulline has been identified as a tissue-specific diagnostic marker of acute GI injury (Jones et al. 2015a; Jones et al. 2015b). Plasma citrulline at days immediately following the radiation insult was significantly associated with crypt survival and reflective of GI injury as it relates to enterocyte function. Conversely, plasma citrulline was less informative for prolonged GI injury and not predictive of survival. It was concluded plasma citrulline as a single biomarker was limited in its ability to comprehensively inform on radiation-induced GI injuries and would find greater utility included in a panel of biomarkers/bioindicators where the radiation insult, subsequent injuries and outcomes, would be more comprehensively characterized.
One promising research avenue to pursue in order to identify a panel of biomarkers/bioindicators that can inform on radiation injury is via the use of mass spectrometry-based metabolomics (Tyburski et al. 2008; Coy et al. 2011; Jones et al. 2017a; Pannkuk et al. 2017). Metabolites are ideal biomarkers due to their relative ease of detection in biologically accessible fluids and their inherent link to phenotypic expression (Fiehn 2002). Metabolites are intermediates and end-products of preceding genomic and proteomic processes. Metabolite expression, both in terms of presence and abundance, provides a robust means for determining molecular signatures reflective of altered biochemical pathways (Sreekumar et al. 2009). Thus, identification of metabolites that are indicative of radiation exposure provides a means to gaining insight into radiation injury and potential for expediting medical countermeasure development.
With this in mind, we utilized high-throughput, targeted metabolomics to experimentally determine metabolites that were differentially expressed in jejunum tissue from mice exposed to lethal and sub-lethal GI acute radiation syndrome (ARS). We then investigated circulating (plasma) metabolites and identified those that were differentially expressed from mice exposed to the same radiation treatment regiments. Finally, we cross-correlated the differentially expressed metabolites from both the small intestine and plasma to formulate a panel of circulating metabolite markers that were organ-specific and radiation sensitive.
MATERIALS AND METHODS
Radiation Animal Model
All mouse procedures were certified according to the UK Animal (Scientific Procedures) Act 1986 and carried out at Epistem Laboratories Ltd (Manchester, United Kingdom). Mouse plasma and small intestinal tissue were transferred to the University of Maryland, School of Pharmacy for analytical analyses. Male C57BL/6 mice, aged 8 to 10 wk, were purchased from Harlan (Shardlow, United Kingdom) and allowed to acclimatize for 2 wk prior to irradiation. Animal welfare, husbandry, radiation, euthanasia, and sample collection were detailed previously (Booth et al. 2012). Irradiation was performed using an Xstrahl RS320 x-ray set, operated at 300 kV, 10 mA. The x-ray tube had additional filtration to give a radiation quality of 2.3 mm copper half-value layer (HVL). Mice were restrained in a compartmentalized plexiglass jig, positioned at a distance of 700 mm below the focus of the x-ray tube. Each rectangular box was divided into 12 ventilated restraints, each holding one animal. For this study, 10 mice were irradiated simultaneously. A dosimetry device (ion chamber) was placed within the mouse jig to record the dose received to the animals in each run. All radiation doses delivered were within 2.6% of the intended dose (mean 1.9%). Quality assurance and control procedures were performed prior to and during each irradiation to confirm dose and energy output remained within range. Animals received total-body irradiation (TBI) delivered at a dose rate of 81.2 cGy min−1. The terminal TBI dose the mice received equated to 8, 10, 12 or 14 Gy. The TBI doses of 8, 10, 12, and 14 Gy corresponded to LD30/8, LD50/7, LD50/6, and LD100/6, respectively (Booth et al. 2012). The TBI dose at 14 Gy resulted in full GI lethality. On days 1 and 3 post irradiation, mice were anesthetized with isoflurane and blood collected via cardiac puncture. Mouse plasma was prepared by collection of blood into 1.5-mL K3 EDTA-coated tubes, immediately placed on wet ice and centrifuged at 5,000 g for 5 min, at 4 °C. After centrifugation, the plasma was transferred by sterile pipette into pre-labeled vials and immediately frozen on dry ice. Preparation of mouse intestinal tissue included flushing out contents with PBS. The jejunum was isolated from the small intestine and snap frozen with liquid nitrogen and stored at −80 °C until analyzed for metabolomics.
High-Throughput, Targeted Metabolomics
Targeted, quantitative metabolomics was performed using Biocrates AbsoluteIDQ p180 kit (Biocrates, Life Science AG, Innsbruck, Austria). The AbsoluteIDQ p180 kit was prepared as described by the manufacturer. The kit is a combined flow injection (FIA) and liquid chromatography (LC) tandem mass spectrometry assay. The assay quantifies up to 188 metabolites from five metabolite classes: acylcarnitines, amino acids, biogenic amines, glycerophospholipids, sphingolipids, and hexose. Internal standards, analyte derivatization and metabolite extraction are integrated into a 96-well plate kit. Metabolite detection is done via pre-selected reaction monitoring (SRM) transitions.
Plasma and jejunum tissue samples were analyzed for targeted metabolomics using the same kit-based platform described above. The one distinction between the two sample matrices was sample preparation prior to placement onto kit. For the plasma samples, 10 uL of plasma was placed directly onto the 96 well kit plate. Jejunum tissue was homogenized in 85:15 (methanol:ethanol, v/v) with 5 mM PBS at a ratio of 5 mg mL-1. After centrifugation, 20 μL of tissue homogenate was loaded onto the 96 well kit plate. At this stage both plasma and tissue samples were handled followed the same procedure for the p180 kit preparation. Briefly, after plasma or tissue sample was placed onto the plate 10 uL of internal standard cocktail was added. This step was followed by drying with nitrogen. Next, a 5% solution of phenylisothiocyanate in ethanol:water:pyridine (1:1:1, v/v/v) was added for derivatization of biogenic amines and amino acids. Metabolite extraction was then achieved with 5 mM ammonium acetate in methanol. The FIA and LC tandem mass spectrometry platform consisted of a Shimadzu Prominence UFLC XR high-performance liquid chromatograph (HPLC) (Shimadzu, Columbia, MD) coupled to an AB Sciex QTRAP® 5500 hybrid tandem quadrupole/linear ion trap mass spectrometer (AB Sciex, Framingham, MA). The MetIQ software (Biocrates) controlled the assay workflow including sample registration, calculation of metabolite concentrations, and assay validation.
The jejunum tissue and plasma were obtained following TBI doses of 8, 10, 12, and 14 Gy at time points of 1 and 3 days post-irradiation. The jejunum tissue examined included 13 sham-irradiated controls (referred to as sham) and 5 biological samples per dose per time point with the exception of the 10 Gy, day 1 group which had 4 biological replicates. The cohort dedicated for plasma collection had 3 biological samples per dose per time point and 8 sham-irradiated controls (referred to as sham). The metabolite concentrations are reported as pmol mg−1 of tissue and ¼M for tissue and plasma samples, respectively.
Bioinformatics
Statistical analyses were performed using the MetaboAnalyst web-based statistical package (Xia et al. 2015; Xia and Wishart 2016) and GraphPad Prism (v 6.03, La Jolla, CA). The data generated from the AbsoluteIDQ p180 kit which included analyte name and calculated concentration was imported into MetaboAnalyst for multivariate analysis. The metabolite data were sum normalized, log transformed, and mean centered. Multivariate analysis included principal component analysis (PCA) and partial least square discriminant analysis (PLS-DA). The univariate analysis was performed in GraphPad Prism using an unpaired t test per comparison and a false discovery rate (FDR, Q value) of 5%.
RESULTS
Mouse small intestine metabolomics.
High-throughput, targeted metabolomics was carried out on jejunum tissue excised from mice exposed to total-body irradiation (TBI). Time points included 24 hours (day 1) and 72 hours (day 3) after TBI at 8, 10, 12, and 14 Gy. Refer to supporting information (SI) Table S1a for tabular representation of the radiological doses, time points, and number of mice. The jejunum metabolites with concentrations are listed in Table S2 (day 1) and Table S3 (day 3). A total of 215 individual components which included 173 metabolites and 42 metabolite combinations were used for data analysis. The jejunum tissue values are reported in pmol mg−1 of tissue.
The jejunum metabolomic profiles at day 1 and day 3 were assessed using multivariate and univariate statistical analyses. The principal component analysis (PCA; Fig. S1a) and partial least squares discriminant analysis (PLS-DA; Fig. 1a) plots for individual doses at day 1 did not distinguish individual TBI doses. This indicated that the measured metabolites at 24 hours lacked the sensitivity to discern the TBI doses under investigation. Alternatively, the PCA (Fig. S1b) and PLS-DA (Fig. 1b) plots comparing sham to TBI where TBI refers to the summation of all four doses revealed the sham and TBI metabolomic profiles were different. There were a total of 65 metabolites that reached significance (p<0.05) when comparing sham to TBI at day 1 as represented by the volcano plot (Fig. 1c) and heatmap (Fig. S2).
Figure 1.
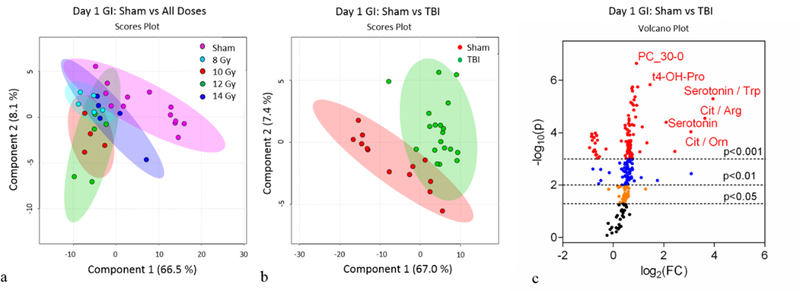
Day 1 jejunum metabolomics: (a) Partial Least Squares - Discriminant Analysis (PLS-DA) plot comparing sham and individual TBI doses; R2=0.91, Q2=0.54. (b) PLS-DA plot comparing sham and combined TBI doses; R2=0.96, Q2=0.79. For the PLS-DA plots, each point represents a data set from an individual animal. The 95% confidence intervals are indicated by elliptical patterns per group. Data were sum normalized, log transformed, and mean centered. (c) Volcano plot highlighting metabolites that were differentially expressed when comparing sham to TBI.
Similar to day 1, the day 3 PCA (Fig. S3a) and PLS-DA (Fig. 2a) plots for individual doses did not differentiate 8, 10, 12, and 14 Gy. Yet, the metabolomic profiles when comparing sham to cumulative TBI (8–14 Gy) were robustly different (PCA, Fig. S3b; PLS-DA, Fig. 2b). There were a total of 132 metabolites that reached significance (p<0.05) when comparing sham to TBI at day 3 as represented by the volcano plot (Fig. 2c) and heatmap (Fig. S4). Further analysis included separating out sham, low TBI dose (8 Gy, LD30/8), and high TBI doses (10–14 Gy, LD50/7 – LD100/6) in order to identify individual metabolites that were differentially expressed between the following comparisons: 1.) sham to low TBI dose, 2.) sham to high TBI doses, and 3.) low to high TBI doses. The multivariate analysis via the use of PLS-DA indicated the metabolomic profiles for sham, low, and high doses TBI were different (Fig. 3a). Univariate analysis identified individual metabolites that were differentially expressed between the group comparisons (Fig. 3b, c, d and Fig. S5). There were 106, 125, and 84 metabolites at day 3 that were significantly different when comparing sham to low, sham to high, and low to high, respectively.
Figure 2.
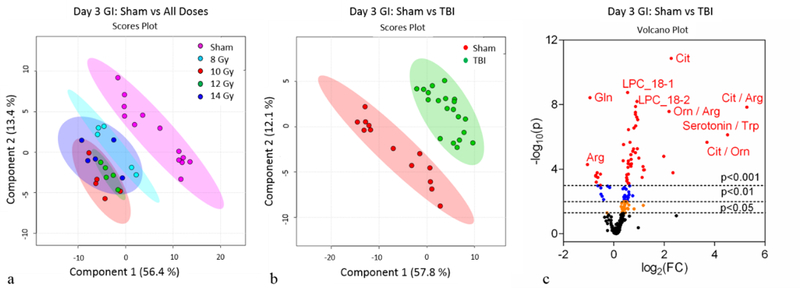
Day 3 jejunum metabolomics: (a) PLS-DA plot comparing sham and individual TBI doses; R2=0.96, Q2=0.81. (b) PLS-DA plot comparing sham and combined TBI doses; R2=0.95, Q2=0.86. For the PLS-DA plots, each point represents a data set from an individual animal. The 95% confidence intervals are indicated by elliptical patterns per group. Data were sum normalized, log transformed, and mean centered. (c) Volcano plot highlighting metabolites that were differentially expressed when comparing sham to TBI.
Figure 3.
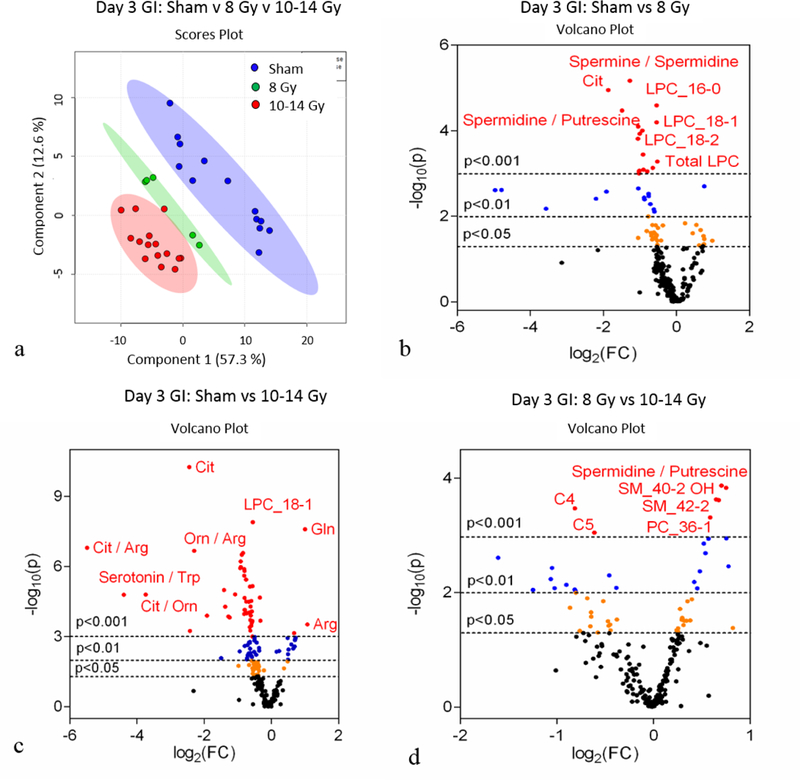
Day 3 jejunum metabolomics: (a) PLS-DA plot comparing sham, 8 Gy, and 10–14 Gy TBI doses; R2=0.94, Q2=0.91. Each point represents a data set from an individual animal. The 95% confidence intervals are indicated by elliptical patterns per group. Data were sum normalized, log transformed, and mean centered. (b) Volcano plot highlighting metabolites that were differentially expressed when comparing sham to 8 Gy. (c) Volcano plot highlighting metabolites that were differentially expressed when comparing sham to 10–14 Gy. (d) Volcano plot highlighting metabolites that were differentially expressed when comparing 8 Gy to 10–14 Gy.
Mouse plasma metabolomics.
Analogous to the small intestine analyses, high-throughput, targeted metabolomics was performed using plasma obtained from mice exposed to TBI. The TBI doses and time points were identical to the small intestine experiments. Refer to Table S1b for tabular representation of the radiological doses, time points, and number of mice. The plasma metabolites with concentrations are listed in Table S4 (day 1) and Table S5 (day 3). A total of 200 individual components which included 168 metabolites and 32 metabolite combinations were used for data analysis. The plasma values are reported in ¼M.
The plasma metabolomic profiles at day 1 and day 3 were assessed via the use of multivariate and univariate statistical analyses. The multivariate analysis plots (PCA, Fig. S6a; PLS-DA, Fig. 4a) for individual doses at day 1 did not differentiate the TBI doses. This indicated that the measured metabolites at 24 hours were not sensitive enough to discern the TBI doses covering 8 to 14 Gy. On the other hand, the PCA (Fig. S6b) and PLS-DA (Fig. 4b) plots comparing sham to TBI (summation of all 4 doses) revealed metabolomic profiles that were robustly distinct. There were a total of 79 metabolites that reached significance (p<0.05) when comparing sham to TBI at day 1 as represented by the volcano plot (Fig. 4c) and heatmap (Fig. S7).
Figure 4.
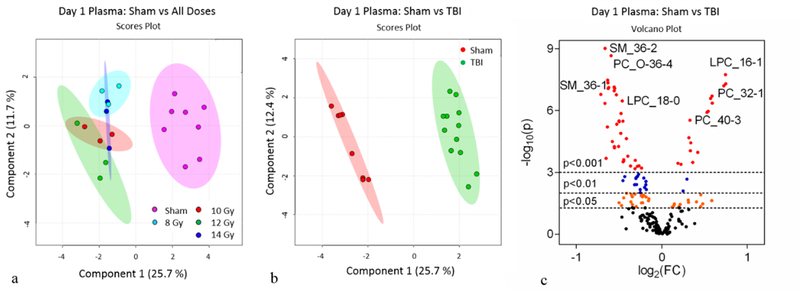
Day 1 plasma metabolomics: (a) PLS-DA plot comparing sham and individual TBI doses; R2=0.70, Q2=0.52. (b) PLS-DA plot comparing sham and combined TBI doses; R2=0.99, Q2=0.94. For PLS-DA plots, each point represents a data set from an individual animal. The 95% confidence intervals are indicated by elliptical patterns per group. Data were sum normalized, log transformed, and mean centered. (c) Volcano plot highlighting metabolites that were differentially expressed when comparing sham to TBI.
The day 3 PCA (Fig. S8a) and PLS-DA (Fig. 5a) plots for individual doses did not differentiate the high TBI doses (10, 12, and 14 Gy, LD50/7 – LD100/6) but did indicate the low dose cohort (8 Gy, LD30/8) had a distinct metabolomic profile from the higher doses. Although the 8 Gy and 10–14 Gy cohorts were differentiated in the multivariate plots, the 8 Gy cohort was more closely aligned to the higher TBI doses than sham. The metabolomic profiles when comparing sham to cumulative TBI (8–14 Gy) were decidedly different (PCA, Fig. S8b; PLS-DA, Fig. 5b). There were a total of 102 metabolites that reached significance (p<0.05) when comparing sham to TBI at day 3 as represented by the volcano plot (Fig. 5c) and heatmap (Fig. S9). Further analysis included separating out sham, low TBI dose (8 Gy, LD30/8), and high TBI doses (10–14 Gy, LD50/7 – LD100/6) in order to identify individual metabolites that were differentially expressed between sham, low TBI dose, and high TBI doses, respectively. The multivariate analysis via the use of PLS-DA indicated the metabolomic profiles from sham, low and high dose TBI animals were different (Fig. 6a). Univariate analysis identified individual metabolites that were differentially expressed between the group comparisons (Fig. 6b, c, d and Fig S10). There were 31, 109, and 44 metabolites at day 3 that were significantly different when comparing samples from sham to low, sham to high, and low to high, respectively.
Figure 5.
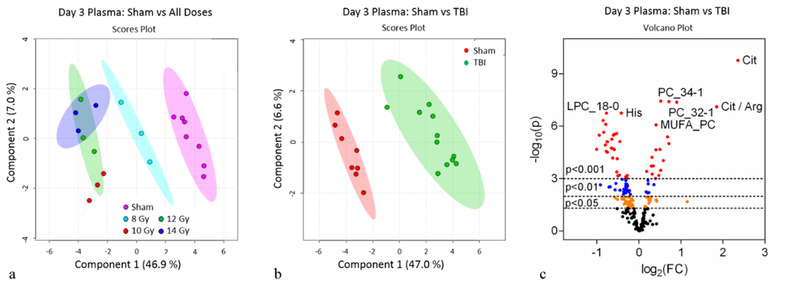
Day 3 plasma metabolomics: (a) PLS-DA plot comparing sham and individual TBI doses; R2=0.91, Q2=0.73. (b) PLS-DA plot comparing sham and combined TBI doses; R2=0.99, Q2=0.88. For PLS-DA plots, each point represents a data set from an individual animal. The 95% confidence intervals are indicated by elliptical patterns per group. Data were sum normalized, log transformed, and mean centered. (c) Volcano plot highlighting metabolites that were differentially expressed when comparing sham to TBI.
Figure 6.
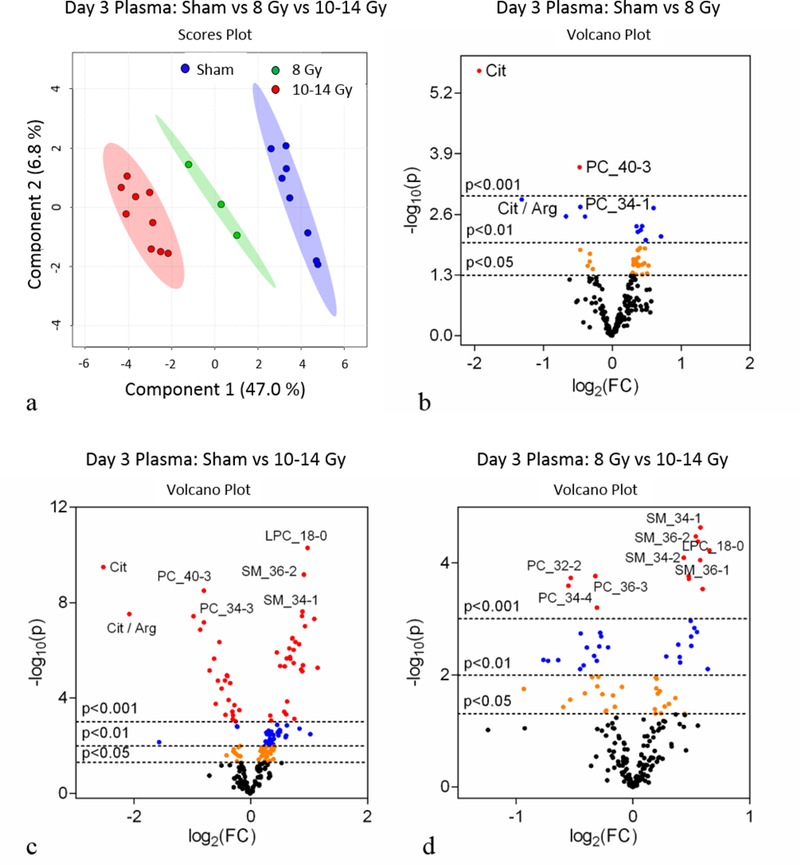
Day 3 plasma metabolomics: (a) PLS-DA plot comparing sham, 8 Gy, and 10–14 Gy TBI doses; R2=0.99, Q2=0.96. Each point represents a data set from an individual animal. The 95% confidence intervals are indicated by elliptical patterns per group. Data were sum normalized, log transformed, and mean centered. (b) Volcano plot highlighting metabolites that were differentially expressed when comparing sham to 8 Gy. (c) Volcano plot highlighting metabolites that were differentially expressed when comparing sham to 10–14 Gy. (d) Volcano plot highlighting metabolites that were differentially expressed when comparing 8 Gy to 10–14 Gy.
Mouse small intestine tissue to plasma metabolite correlation.
The metabolite correlation between the small intestine tissue and plasma was performed by assessing those metabolites that were differentially expressed when comparing sham to TBI in jejunum tissue to those that were differentially expressed in plasma. For day 1, there were 65 and 79 jejunum and plasma metabolites identified, respectively. The correlation analysis yielded 14 metabolites that were common between the two groups (Fig. 7a, Table 1). Of note, there were six amino acids, histidine (His), leucine (Leu), methionine (met), phenylalanine (Phe), serine (Ser), and threonine (Thr), significantly elevated in both jejunum and plasma at day 1 (Fig. 7b-c). The day 3 correlation yielded 18 metabolites that were both differentially expressed and common between the jejunum and plasma (Fig. 8a, Table 1). Four metabolites, lysophosphatidylcholine (LPC_18:0), diacyl glyercophosphatidylcholine (PC_36:0), sphingomyelin (SM_36–2), and kynurenine, are highlighted in Fig. 8b and 8c. In addition to the metabolites mentioned above, citrulline, previously identified as a marker of small intestine health with demonstrated correlation between small intestine and plasma, was evaluated as a benchmark tissue-specific plasma metabolite (Fig. S11). When assessing the TBI doses collectively, citrulline at day 1 in both jejunum and plasma did not reach significance yet was consistently lower in TBI than sham (Fig. S11a-b). Of note, the 10 and 14 Gy TBI day 1 cohorts had jejunum citrulline levels significantly lower than sham (Fig. S12a). Since levels at the 12 Gy TBI dose did not reach significance and all individual TBI doses for the plasma samples at day 1 were nonsignificant (Fig. S12b), the 10 and 14 Gy jenual citrulline levels at day 1 were considered statistically ambiguous and not pursued. By day 3, jejunum and plasma citrulline concentrations were significantly lower in the combined TBI insult (Fig. S11c-d) consistent with literature and individual TBI doses (Fig S12c-d).
Figure 7.
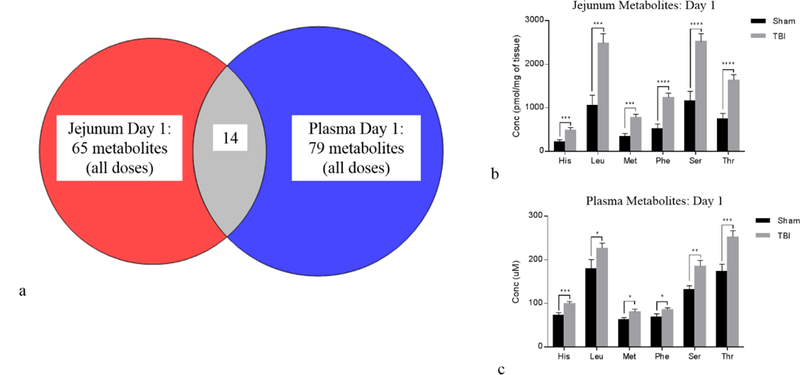
Day 1 jejunum tissue to plasma correlation: (a) Venn diagram showing cross-correlation of jejunum and plasma metabolites that were significantly different at day 1 when comparing sham to TBI (combined TBI doses). There were 14 metabolites common between jejunum and plasma. (b) Bar graph displaying amino acids from jejunum tissue that were differentially expressed between sham and TBI. (c) Bar graph displaying same amino acids that were differentially expressed in plasma. Bar graph data are mean ± SEM, *p<0.05, **p<0.01, ***p<0.005, ****p<0.0001.
Table 1.
Day 1 and Day 3 jejunum-specific, plasma metabolites that were differentially expressed when comparing sham to TBI (combined TBI doses).
| Day 1 |
Jejunum |
Plasma |
|||||
| Metabolite | Sham (mean) | TBI (mean) | P value | Sham (mean) | TBI (mean) | P value | Highest Mean |
| His | 224.12 | 495.73 | 0.0009 | 73.18 | 99.90 | 0.0015 | TBI |
| Leu | 1058.54 | 2485.90 | 0.0001 | 179.50 | 226.92 | 0.0458 | TBI |
| Met | 344.03 | 782.84 | 0.0001 | 62.84 | 80.65 | 0.0444 | TBI |
| Phe | 518.77 | 1242.32 | 0.0000 | 68.89 | 85.76 | 0.0399 | TBI |
| Ser | 1156.66 | 2521.26 | 0.0000 | 131.74 | 185.58 | 0.0065 | TBI |
| Thr | 751.85 | 1637.56 | 0.0000 | 174.13 | 252.75 | 0.0019 | TBI |
| LPC_17–0 | 3.41 | 4.61 | 0.0001 | 2.21 | 2.62 | 0.0192 | TBI |
| LPC_18–0 | 101.11 | 129.94 | 0.0003 | 74.33 | 97.46 | 0.0003 | TBI |
| PC_38–5 | 215.70 | 187.03 | 0.0279 | 68.43 | 51.13 | 0.0025 | Sham |
| PC_O-36–2 | 81.14 | 96.54 | 0.0325 | 14.14 | 16.37 | 0.0218 | TBI |
| PC_O-38–2 | 64.16 | 98.81 | 0.0004 | 8.84 | 12.15 | 0.0000 | TBI |
| PC_O-40–4 | 23.90 | 31.25 | 0.0047 | 3.54 | 4.23 | 0.0140 | TBI |
| Cit / Arg | 1.13 | 0.15 | 0.0004 | 0.61 | 0.41 | 0.0053 | Sham |
| CPT-I ratio | 0.02 | 0.01 | 0.0085 | 0.02 | 0.01 | 0.0147 | Sham |
| Day 3 |
Jejunum |
Plasma |
|||||
| Metabolite | Sham (mean) | TBI (mean) | P value | Sham (mean) | TBI (mean) | P value | Highest Mean |
| Cit | 165.18 | 51.86 | 0.0000 | 62.98 | 10.13 | 0.0000 | Sham |
| Gln | 826.48 | 2136.90 | 0.0000 | 698.50 | 1081.30 | 0.0314 | TBI |
| Kynurenine | 2.99 | 5.18 | 0.0005 | 1.03 | 1.69 | 0.0005 | TBI |
| LPC_17–0 | 3.41 | 4.90 | 0.0000 | 2.21 | 3.16 | 0.0009 | TBI |
| LPC_18–0 | 101.11 | 140.67 | 0.0000 | 74.33 | 110.80 | 0.0007 | TBI |
| LPC_18–2 | 56.32 | 44.22 | 0.0005 | 133.55 | 102.80 | 0.0175 | Sham |
| LPC_24–0 | 1.09 | 1.45 | 0.0038 | 1.16 | 1.47 | 0.0100 | TBI |
| PC_30–0 | 30.02 | 26.62 | 0.0313 | 1.16 | 0.91 | 0.0007 | Sham |
| PC_36–0 | 8.41 | 11.79 | 0.0002 | 2.09 | 2.61 | 0.0015 | TBI |
| PC_38–4 | 741.41 | 890.50 | 0.0037 | 171.13 | 193.69 | 0.0419 | TBI |
| SM_40–2 OH | 12.77 | 18.64 | 0.0013 | 2.60 | 3.33 | 0.0341 | TBI |
| SM_40–3 OH | 4.14 | 5.89 | 0.0005 | 1.88 | 2.35 | 0.0249 | TBI |
| SM_34–2 | 7.61 | 9.26 | 0.0009 | 5.04 | 6.00 | 0.0404 | TBI |
| SM_36–1 | 73.38 | 85.89 | 0.0284 | 2.07 | 3.32 | 0.0010 | TBI |
| SM_36–2 | 5.08 | 6.86 | 0.0003 | 0.96 | 1.37 | 0.0017 | TBI |
| SM_42–2 | 65.48 | 96.84 | 0.0001 | 20.32 | 26.43 | 0.0072 | TBI |
| Cit / Arg | 1.13 | 0.05 | 0.0001 | 0.61 | 0.14 | 0.0000 | Sham |
| MUFA_PC / SFA_PC | 2.25 | 2.14 | 0.0491 | 7.39 | 5.27 | 0.0000 | Sham |
Figure 8.
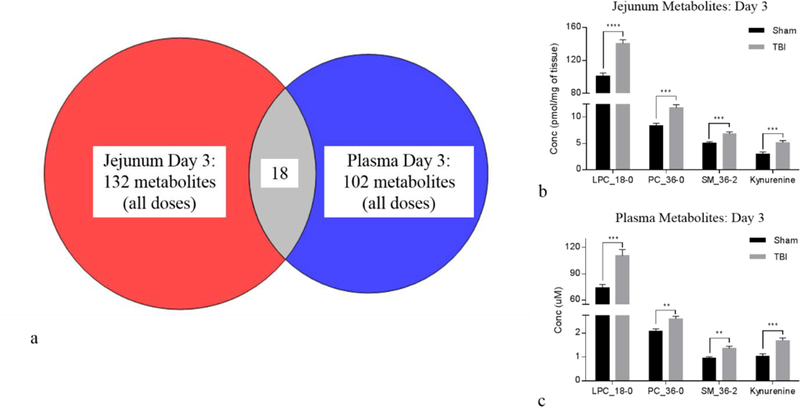
Day 3 jejunum tissue to plasma correlation: (a) Venn diagram showing cross-correlation of jejunum and plasma metabolites that were significantly different at day 3 when comparing sham to TBI (combined TBI doses). There were 18 metabolites common between jejunum and plasma. (b) Bar graph displaying metabolites from jejunum tissue that were differentially expressed between sham and TBI. (c) Bar graph displaying same metabolites that were differentially expressed in plasma. Bar graph data are mean ± SEM, *p<0.05, **p<0.01, ***p<0.005, ****p<0.0001.
DISCUSSION
The objectives of this study were to use a well-defined, murine radiation model (Booth et al. 2012) to: a.) identify early time-point, small intestine specific metabolite markers that were responsive to TBI doses covering sub-lethal to lethal GI-ARS, and b.) correlate these tissue-specific markers to a circulating biofluid (plasma). These objectives were accomplished with high-throughput, targeted metabolomics.
The use of metabolomics for biomarker identification in radiation animal models has predominantly been accomplished with mass spectrometry-based techniques (Tyburski et al. 2008; Jones et al. 2017a; Pannkuk et al. 2017). Several recent reports detail the use of untargeted, discovery-based mass spectrometry techniques to identify small intestine metabolite markers in TBI murine models (Ghosh et al. 2013; Golla et al. 2017). Ghosh et al. utilized a TBI mouse model where the mice received TBI doses of 4 and 8 Gy with small intestine tissue analyzed at days 1 and 4 post exposure. A number of metabolites including lipids, amino acids, and organic acids were detected and correlated to GI injury. The authors concluded GI-ARS impacted small intestine metabolism, which in part explained GI toxicity following radiation exposure. Golla et al. investigated mouse small intestine metabolomic profiles at 12 hours following 6 Gy TBI (Golla et al. 2017). In this report, the authors identified several amino-, bile- nucleic-, and organic acids that were differentially expressed in ileum after irradiation. The authors extended the tissue-specific metabolite response to both urine and serum.
Our approach, in contrast to the untargeted techniques describe above, involved the use of a targeted, kit-based mass spectrometry assay that had a predetermined list of metabolites. The targeted, kit-based assay although much narrower in scope, yielded metabolite quantification from a set panel of previously characterized metabolites. This particular targeted approach was advantageous for several reasons including built-in quality control for both intra- and inter- experimental consistency, streamlined sample preparation in a 96-well plate format, known identification of metabolites, and inclusion of internal standards for quantitative results (Jones et al. 2017b).
Previous studies detailed the analysis of plasma citrulline as a single marker of small intestine injury following lethal GI-ARS (Jones et al. 2015a; Jones et al. 2015b). Plasma citrulline at early time points was determined to be a surrogate marker for small intestine injury following GI-ARS via its correlation to enterocyte mass. The use of plasma citrulline as a single metabolite marker was limited in its ability to delineate TBI doses, reflect prolonged GI injury, and correlate to survival. With this in mind, we attempted to identify additional metabolite plasma markers at early time-points that were specific to small intestine tissue covering TBI doses ranging from sub-lethal to full lethality. Post-radiation exposure time points of days 1 and 3 were chosen based on previous plasma citrulline results from the exact same mouse TBI model where citrulline values were not significantly impacted at day 1 but were significantly lower at day 3. These results were reproduced in the current data-set further justifying the robustness of plasma citrulline as a metabolite marker.
The high-throughput, targeted metabolomic experiments at 24 hours post-TBI exposure for both jejunum tissue and plasma did not distinguish sub-lethal and lethal GI-ARS doses. This pattern continued through the day 3 experiments with the higher GI-ARS doses of 10–14 Gy. Of note, the day 3 metabolomic profiles for the lowest TBI dose of 8 Gy were statistically different than the higher TBI doses for both sample matrices. These results indicated the metabolites used herein were not sensitive enough at 24 hours and had only limited sensitivity at 72 hours for their use as early time point biodosimetry markers. The distinction between 8 Gy and 10–14 Gy TBI doses has potential biological significance. A 8 Gy TBI dose in the mouse model used in these experiments yielded a LD30 at day 8 where the higher TBI doses were 100% lethal at day 6 (14 Gy), LD50 at day 6 (12 Gy), or LD50 at day 7 (10 Gy) (Booth et al. 2012). A more detailed investigation of the biological significance of identifying tissue-correlated plasma metabolites that were able to delineate a LD30/8 TBI dose from ≥LD50/7 doses in a GI-ARS murine model is needed and currently being pursued. We have instead focused on the comprehensive effect of GI-ARS and identifying small intestine-specific plasma metabolites there were collectively GI-ARS sensitive.
The metabolomic experiments demonstrated that small intestine tissue at day 1 and day 3 post-TBI exposure had significantly different metabolic profiles than corresponding sham tissue. Similarly, plasma metabolites from the same time points yielded significant differences between plasma metabolomic profiles from mice exposed to TBI and corresponding sham samples. The cross-correlation analysis for determining small intestine specific plasma metabolites that were differentially expressed as a consequence of radiation exposure resulted in 14 and 18 metabolites at day 1 and day 3, respectively. The metabolites included amino acids, biogenic amines, lysophosphatidylcholine (LPC), glycerophosphatidylcholine (PC), and sphingomyelin (SM).
The identification of the several amino acids being significantly elevated at 24 hours post-radiation exposure was of great interest. Amino acids are not only the building blocks of proteins and polypeptides but they are dynamic regulators of key metabolic pathways (Wu 2009). Specifically, in the GI system, amino acids play a critical role in supporting gut, mucosal barrier integrity and function (Van Der Schoor et al. 2002; Wang et al. 2009). Dysregulation of amino acid metabolism within the small intestine as a result of radiation exposure likely has profound effects on GI-ARS. In particular, the identification of threonine being significantly elevated at day 1 post exposure is a novel finding in a GI-ARS animal model. Threonine is of critical importance to gut function and barrier integrity via its high occurrence in mucin synthesis (Schaart et al. 2005). Elevated levels of intestinal threonine have been associated with intestinal inflammation (Le Floc’h and Seve 2005; Remond et al. 2009) yet to date have not been associated with GI-ARS. The correlation of small intestine threonine to plasma threonine provides the groundwork for future use of threonine as an early marker of intestinal inflammation following radiation exposure.
The identification of metabolite markers at days 1 and 3 post TBI exposure in a well-characterized mouse TBI model is just one of many steps on the road to “truly” identifying radiation biomarkers. In fact, the potential of any identified metabolite marker(s) originating from a discrete, albeit well-characterized, animal model is ultimately dependent upon a combination of validating experiments including scrutiny with increased numbers of “N”, translation to orthogonal radiation schemes (e.g., partial-body irradiation), translation to additional animal model (e.g., nonhuman primates), and utility in medical countermeasure development. The identification of a panel of metabolite markers that were differentially expressed in both small intestine tissue and circulation is an initial step in biomarker development using MCART animal models.
CONCLUSION
High-throughput, targeted metabolomics was used to identify early time point plasma metabolite markers that were cross-correlated to small intestine tissue in a well-defined mouse total-body irradiation model. The metabolomics approach demonstrated significant and robust metabolomic signatures for both small intestine and plasma at day 1 and day 3 following radiation exposure over the lethal range for GI-ARS. There were 14 and 18 small intestine-specific plasma metabolite markers that were identified as being significantly changed at day 1 and day 3 post-TBI, respectively. The identified small intestine-specific plasma metabolites have the potential to be used as surrogate biomarkers for gastrointestinal injury following high-dose radiation exposure.
Supplementary Material
ACKNOWLEDGEMENTS
This project has been funded in whole or in part with Federal funds from the National Institute of Allergy and Infectious Diseases, National Institutes of Health, Department of Health and Human Services, under Contract No. HHSN272201000046C and HHSN272201500013I. Additional support was provided by the University of Maryland School of Pharmacy Mass Spectrometry Center (SOP1841-IQB2014). The authors would like to thank the members of the Medical Countermeasures Against Radiological Threats (MCART) consortium for their dedication, support, and guidance. Additionally, we acknowledge and thank the members of the Kane laboratory.
Funding Source:
This project has been funded in whole or in part with Federal funds from the National Institute of Allergy and Infectious Diseases, National Institutes of Health, Department of Health and Human Services, under Contract No. HHSN272201000046C and HHSN272201500013I. Additional support was provided by the University of Maryland School of Pharmacy Mass Spectrometry Center (SOP1841-IQB2014).
REFERENCES
- Booth C, Potten CS. The intestine as a model for studying stem-cell behavior Tumor Models in Cancer Research Springer; 2002; 337–357. [Google Scholar]
- Booth C, Tudor G, Tudor J, Katz BP, MacVittie TJ. Acute gastrointestinal syndrome in high-dose irradiated mice. Health physics 103: 383–99; 2012. [DOI] [PMC free article] [PubMed] [Google Scholar]
- Coy SL, Cheema AK, Tyburski JB, Laiakis EC, Collins SP, Fornace A Jr., Radiation metabolomics and its potential in biodosimetry. International journal of radiation biology 87: 802–23; 2011. [DOI] [PMC free article] [PubMed] [Google Scholar]
- Dainiak N, Waselenko JK, Armitage JO, MacVittie TJ, Farese AM. The hematologist and radiation casualties. Hematology American Society of Hematology Education Program: 473–96; 2003. [DOI] [PubMed] [Google Scholar]
- Fiehn O Metabolomics--the link between genotypes and phenotypes. Plant molecular biology 48: 155–71; 2002. [PubMed] [Google Scholar]
- Ghosh SP, Singh R, Chakraborty K, Kulkarni S, Uppal A, Luo Y, Kaur P, Pathak R, Kumar KS, Hauer-Jensen M, Cheema AK. Metabolomic Changes in Gastrointestinal Tissues after Whole Body Radiation in a Murine Model. Molecular bioSystems 9: 723–731; 2013. [DOI] [PMC free article] [PubMed] [Google Scholar]
- Golla S, Golla JP, Krausz KW, Manna SK, Simillion C, Beyoglu D, Idle JR, Gonzalez FJ. Metabolomic Analysis of Mice Exposed to Gamma Radiation Reveals a Systemic Understanding of Total-Body Exposure. Radiation research 187: 612–629; 2017. [DOI] [PMC free article] [PubMed] [Google Scholar]
- Jones JW, Bennett A, Carter CL, Tudor G, Hankey KG, Farese AM, Booth C, MacVittie TJ, Kane MA. Citrulline as a Biomarker in the Non-human Primate Total- and Partial-body Irradiation Models: Correlation of Circulating Citrulline to Acute and Prolonged Gastrointestinal Injury. Health physics 109: 440–51; 2015a. [DOI] [PMC free article] [PubMed] [Google Scholar]
- Jones JW, Carter CL, Li F, Yu J, Pierzchalski K, Jackson IL, Vujaskovic Z, Kane MA. Ultraperformance convergence chromatography-high resolution tandem mass spectrometry for lipid biomarker profiling and identification. Biomedical chromatography : BMC 31; 2017a. [DOI] [PMC free article] [PubMed] [Google Scholar]
- Jones JW, Jackson IL, Vujaskovic Z, Kaytor MD, Kane MA. Targeted Metabolomics Identifies Pharmacodynamic Biomarkers for BIO 300 Mitigation of Radiation-Induced Lung Injury. Pharmaceutical research 34: 2698–2709; 2017b. [DOI] [PMC free article] [PubMed] [Google Scholar]
- Jones JW, Scott AJ, Tudor G, Xu PT, Jackson IL, Vujaskovic Z, Booth C, MacVittie TJ, Ernst RK, Kane MA. Identification and quantitation of biomarkers for radiation-induced injury via mass spectrometry. Health physics 106: 106–19; 2014. [DOI] [PMC free article] [PubMed] [Google Scholar]
- Jones JW, Tudor G, Li F, Tong Y, Katz B, Farese AM, MacVittie TJ, Booth C, Kane MA. Citrulline as a Biomarker in the Murine Total-Body Irradiation Model: Correlation of Circulating and Tissue Citrulline to Small Intestine Epithelial Histopathology. Health physics 109: 452–65; 2015b. [DOI] [PMC free article] [PubMed] [Google Scholar]
- Le Floc’h N, Seve B. Catabolism through the threonine dehydrogenase pathway does not account for the high first-pass extraction rate of dietary threonine by the portal drained viscera in pigs. The British journal of nutrition 93: 447–56; 2005. [DOI] [PubMed] [Google Scholar]
- MacVittie TJ. The MCART Consortium animal models series. Health physics 103: 340–2; 2012. [DOI] [PubMed] [Google Scholar]
- Pannkuk EL, Fornace A Jr., Laiakis EC. Metabolomic applications in radiation biodosimetry: exploring radiation effects through small molecules. International journal of radiation biology 93: 1151–1176; 2017. [DOI] [PMC free article] [PubMed] [Google Scholar]
- Potten CS. A comprehensive study of the radiobiological response of the murine (BDF1) small intestine. International journal of radiation biology 58: 925–73; 1990. [DOI] [PubMed] [Google Scholar]
- Remond D, Buffiere C, Godin JP, Mirand PP, Obled C, Papet I, Dardevet D, Williamson G, Breuille D, Faure M. Intestinal inflammation increases gastrointestinal threonine uptake and mucin synthesis in enterally fed minipigs. The Journal of nutrition 139: 720–6; 2009. [DOI] [PubMed] [Google Scholar]
- Schaart MW, Schierbeek H, van der Schoor SR, Stoll B, Burrin DG, Reeds PJ, van Goudoever JB. Threonine utilization is high in the intestine of piglets. The Journal of nutrition 135: 765–70; 2005. [DOI] [PubMed] [Google Scholar]
- Sreekumar A, Poisson LM, Rajendiran TM, Khan AP, Cao Q, Yu J, Laxman B, Mehra R, Lonigro RJ, Li Y, Nyati MK, Ahsan A, Kalyana-Sundaram S, Han B, Cao X, Byun J, Omenn GS, Ghosh D, Pennathur S, Alexander DC, Berger A, Shuster JR, Wei JT, Varambally S, Beecher C, Chinnaiyan AM. Metabolomic profiles delineate potential role for sarcosine in prostate cancer progression. Nature 457: 910–4; 2009. [DOI] [PMC free article] [PubMed] [Google Scholar] [Research Misconduct Found]
- Tyburski JB, Patterson AD, Krausz KW, Slavik J, Fornace AJ, Jr., Gonzalez FJ, Idle JR. Radiation metabolomics. 1. Identification of minimally invasive urine biomarkers for gamma-radiation exposure in mice. Radiation research 170: 1–14; 2008. [DOI] [PMC free article] [PubMed] [Google Scholar]
- Van Der Schoor SR, Reeds PJ, Stoll B, Henry JF, Rosenberger JR, Burrin DG, Van Goudoever JB. The high metabolic cost of a functional gut. Gastroenterology 123: 1931–40; 2002. [DOI] [PubMed] [Google Scholar]
- Wang WW, Qiao SY, Li DF. Amino acids and gut function. Amino Acids 37: 105–110; 2009. [DOI] [PubMed] [Google Scholar]
- Williams JP, Brown SL, Georges GE, Hauer-Jensen M, Hill RP, Huser AK, Kirsch DG, Macvittie TJ, Mason KA, Medhora MM, Moulder JE, Okunieff P, Otterson MF, Robbins ME, Smathers JB, McBride WH. Animal models for medical countermeasures to radiation exposure. Radiation research 173: 557–78; 2010. [DOI] [PMC free article] [PubMed] [Google Scholar]
- Wu G Amino acids: metabolism, functions, and nutrition. Amino Acids 37: 1–17; 2009. [DOI] [PubMed] [Google Scholar]
- Xia J, Sinelnikov IV, Han B, Wishart DS. MetaboAnalyst 3.0--making metabolomics more meaningful. Nucleic acids research 43: W251–7; 2015. [DOI] [PMC free article] [PubMed] [Google Scholar]
- Xia J, Wishart DS. Using MetaboAnalyst 3.0 for Comprehensive Metabolomics Data Analysis . Current protocols in bioinformatics 55: 14.10.1–14.10.91; 2016. [DOI] [PubMed] [Google Scholar]
Associated Data
This section collects any data citations, data availability statements, or supplementary materials included in this article.


