Abstract
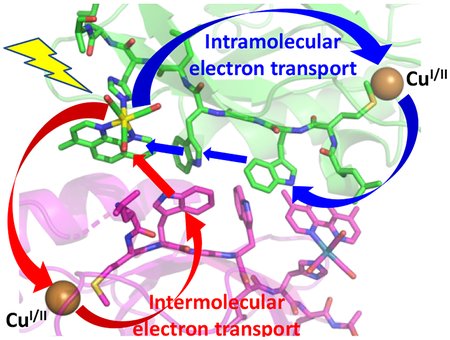
We have investigated photoinduced hole hopping in a Pseudomonas aeruginosa azurin mutant Re126WWCuI, where two adjacent tryptophan residues (W124 and W122) are inserted between the CuI center and a Re photosensitizer coordinated to a H126 imidazole (Re = ReI(H126)(CO)3(dmp)+, dmp = 4,7-dimethyl-1,10-phenanthroline). Optical excitation of this mutant in aqueous media (≤40 μM) triggers 70 ns electron transport over 23 Å, yielding a long-lived (120 μs) ReI(H126)(CO)3(dmp•−)WWCuII product. The Re126FWCuI mutant (F124, W122) is not redox-active under these conditions. Upon increasing the concentration to 0.2–2 mM, {Re126WWCuI}2 and {Re126FWCuI}2 are formed with the dmp ligand of the Re photooxidant of one molecule in close contact (3.8 Å) with the W122’ indole on the neighboring chain. In addition, {Re126WWCuI}2 contains an interfacial tryptophan quadruplex of four indoles (3.3–3.7 Å apart). In both mutants, dimerization opens an intermolecular W122’→//*Re ET channel (//denotes the protein interface, *Re is the optically excited sensitizer). Excited-state relaxation and ET occur together in two steps (time constants of ~600 ps and ~8 ns) that lead to a charge-separated state containing a Re(H126)(CO)3(dmp•−)//(W122•+)’ unit; then, (CuI)’ is oxidized intramolecularly (60–90 ns) by (W122•+)’, forming ReI(H126)(CO)3(dmp•−)WWCuI//(CuII)’. The photocycle is closed by ~1.6 μs ReI(H126)(CO)3(dmp•−)→//(CuII)’ back ET that occurs over 12 Å, in contrast to the 23 Å, 120 μs step in Re126WWCuI. Importantly, dimerization makes Re126FWCuI photoreactive and, as in the case of {Re126WWCuI}2, channels the photoproduced “hole” to the molecule that was not initially photoexcited, thereby shortening the lifetime of ReI(H126)(CO)3(dmp•−)//CuII. Whereas two adjacent W124 and W122 indoles dramatically enhance CuI→*Re intramolecular multistep ET, the tryptophan quadruplex in {Re126WWCuI}2 does not accelerate intermolecular electron transport; instead, it acts as a hole storage and crossover unit between inter- and intramolecular ET pathways. Irradiation of {Re126WWCuII}2 or {Re126FWCuII}2 also triggers intermolecular W122’→//*Re ET; and the Re(H126)(CO)3(dmp•−)//(W122•+)’ charge-separated state decays to the ground state by ~50 ns ReI(H126)(CO)3(dmp•−)+→//(W122•+)’ intermolecular charge recombination. Our findings shed light on the factors that control interfacial hole/electron hopping in protein complexes and on the role of aromatic amino acids in accelerating long-range electron transport.
Graphical Abstract
INTRODUCTION
Pseudomonas aeruginosa azurin, a blue copper protein, provides an excellent platform for investigations of electron transfer (ET) in natural systems. Kinetics studies of CuI oxidation by appended Ru- or Re-based photosensitizers and of CuII reduction by pulse-radiolytically generated cysteine radical anions established ET pathways and timetables,1,2,3,4,5,6,7,8,9,10 while complementary theoretical work provided insights into the nature of tunneling pathways and protein dynamics effects,11,12,13,14,15 and, more recently, conformational gating.16
Introducing one or more tryptophan residues into high-potential ET pathways dramatically accelerates ET and extends its range by changing the mechanism from single-step to multistep tunneling (hopping, EThop) involving tryptophan radical-cation intermediates.1,17,18,19 Rapid (50–70 ns) CuI photooxidation over 19.4 and 22.9 Å has been demonstrated in Re-labeled azurin mutants containing one20 and two21 intervening tryptophans. An analogous hopping mechanism was found to accelerate ET across an azurinazurin dimer interface where the Re sensitizer and the tryptophan are in two different molecules.22 In addition, ET in azurins also can be accelerated by hopping through nitrotyrosines in redox pathways.23 These observations support the hypothesis that long-range ET through tryptophan/tyrosine chains is operational in high-potential enzymatic catalysis, either in substrate transformations24,25 or offering protection from oxidative damage.17,24,26,27
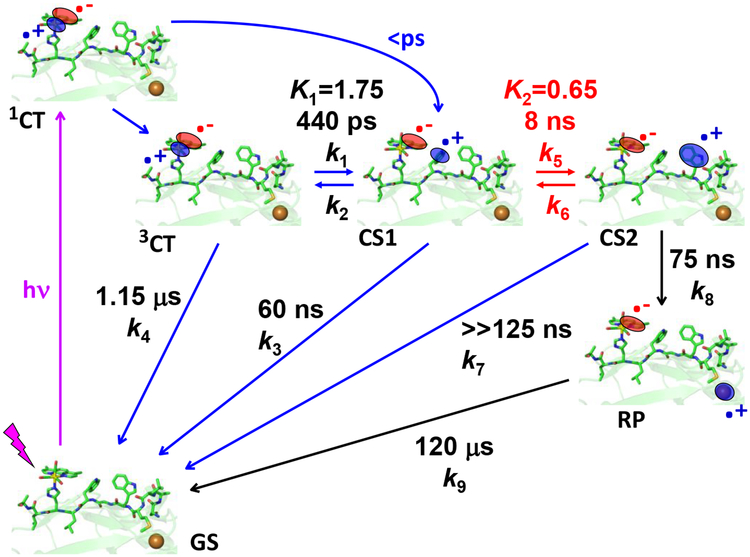
The double-tryptophan mutant21 Re126WWCuI is a case in point (Scheme I). The Re photooxidant ReI(CO)3(dmp)+ (dmp = 4,7-dimethyl-1,10-phenanthroline) was covalently appended through the imidazole side chain of histidine H126 in an azurin mutant containing two redox-active tryptophans (W124, W122) in the protein; and the naturally occurring W48 and all tyrosines had been replaced by phenylalanines. CuI photooxidation in Re126WWCuI is accelerated ~10,000-fold by hopping through the two intervening typtophans, achieving ~70 ns ET over 22.9 Å (Scheme 1).21 The photocycle is completed by ~120 μs ReI(H126)(CO)3(dmp•−)→CuII back electron transfer (BET), which is not accelerated by hopping, since CuII cannot oxidize tryptophan. The large difference between forward and back ET extends the lifetime of the CuII redox product (RP). Importantly, hopping though a tryptophan chain both accelerates and rectifies phototriggered electron flow. Comparison with analogous mutants Re126FWCuI and Re126WFCuI, where one of the tryptophans (the first and second letters specify the 124 and 122 residues) is replaced by phenylalanine, has shown21 that efficient hopping in this system requires the simultaneous presence of two tryptophans and their close contact with each other, as well as with the adjacent Re photooxidant. Photoinduced ET does not occur in Re126FWCuI, whose luminescence decays with the same lifetime (1.15 μs) as an isolated *Re chromophore. In Re126WFCuI, *Re emission is quenched by fast ET from neighboring W124, followed by fast charge recombination that regenerates the ground state, without oxidizing CuI.21
Scheme 1.
Intramolecular photoinduced ET cycle of Re126WWCuI as established in ref.21 The Re-Cu charge separation takes place via hopping through two Trp residues. 3CT is a mixed Re→dmp MLCT/dmp-intraligand excited state (*Re) that is populated upon optical excitation of the Re label after ultrafast intersystem crossing and several relaxation steps (not shown). It undergoes reversible *Re↔W124 ET producing a charge-separated state CS1: ReI(H126)(CO)3(dmp•−)(W124•+)W122CuI. The second ET equilibrium W124•+↔W122 produces the CS2 state ReI(H126)(CO)3(dmp•−)W124(W122•+)CuI. W122•+ then undergoes ~75 ns reduction by CuI over a ~11 Å distance, forming the redox product (RP) ReI(H126)(CO)3(dmp•−)W124W122CuII. The cycle is completed by ~120 μs Re(dmp•−)→CuII back electron transfer. The low K2 value limits the RP quantum yield. This scheme is also applicable to Re126WFCuI (k5 and all subsequent rate constants = 0) and Re126FWCuI (k1 and all subsequent rate constants = 0; (k4)−1 is the unquenched 3CT lifetime, 1.15 μs.)
The Re126WWCuI photocycle and kinetics shown in Scheme 1 were established at low concentrations (≤40 μM) in order to minimize dimerization (oligomerization) observed22,28 for several azurin mutants and their Re-labeled derivatives. The time constants reported in Scheme 1 are for intramolecular ET in azurin monomers,21 while our time-resolved spectroscopic studies revealed multiexponential kinetics with minor components becoming prominent as the protein concentration was increased. Strikingly, Re126FWCuI became photo-ET active and the contribution of the 120 μs recombination kinetics of Re126WWCuI diminished at higher concentrations. Considering the azurin tendency to dimerize,22,28 this behavior is attributable to intermolecular ET. Herein, we describe photocycles of CuI and CuII forms of Re126FWCu, Re126WWCu, and Re126WFCu at concentrations 200 μM and higher, aiming to shed light on the interplay between intra- and intermolecular electron/hole hopping.
RESULTS
Structures.
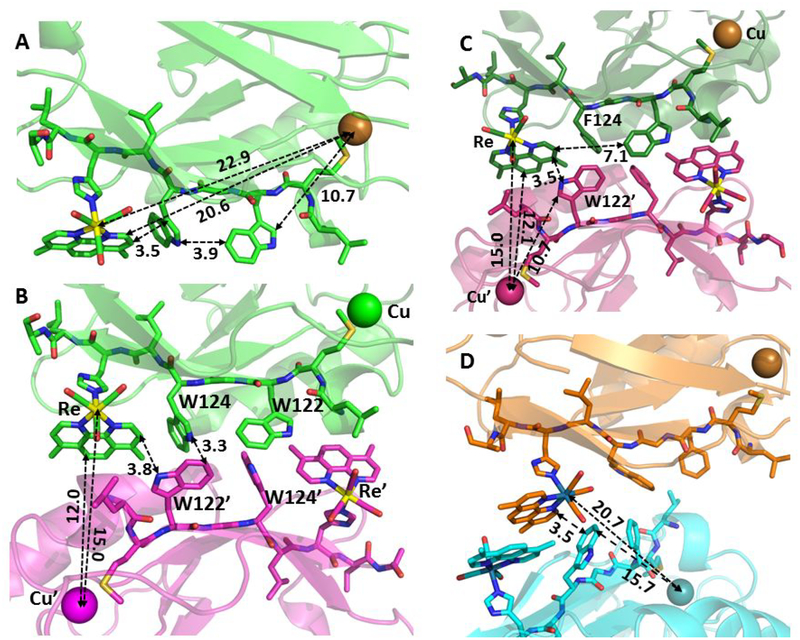
The X-ray crystal structure of Re126WWCuII (PDB: 6MJS; Figure 1A)21 shows multiple short (3.5 – 4.0 Å) intramolecular contacts between the mutually T-oriented aromatic groups of redox cofactors Re(H126)(CO)3(dmp)+, W124, and W122 along the 22.9 Å intramolecular Re---Cu ET pathway (see Table S1 for ET-relevant intramolecular distances).21 The W122 indole is separated from the Cu atom by ~11 Å; and the structure of the W122-Cu pathway is virtually the same as in Re126FWCuII,21 Re126T124W122CuII,22 and Re124W122CuII.20 Molecular structures of Re126WFCuII (6MJT), Re126FWCuII (6MJR), and Re126WWCuII are nearly superimposable.21 In Re126FWCuII, the Re chromophore is redox-isolated since the W122 residue is too far from the Re site.21
Figure 1.
A: Structure of Re126WWCuII (PDB: 6MJS, chain A) showing intramolecular distances between the redox cofactors. B: The interfacial region between chains A and D in the asymmetric unit of Re126WWCuII, showing distances relevant to intermolecular ET. The four interfacial tryptophans form a “cage” with indole groups separated by less than 4 Å. C: The interfacial region between chains A and C in the asymmetric unit of Re126FWCuII, showing distances relevant to intermolecular ET. D: The interfacial region of Re126WFCuII showing distances relevant to intermolecular ET. A Pymol-generated symmetry match to the molecules in the asymmetric unit is shown. (More structures, including Re126TWCuII and ReW122CuII, are shown in Figure S1.)
The asymmetric unit of Re126WWCuII consists of two pairs of protein molecules. In each pair, the ET-active regions of the two molecules face each other (Figures 1B, S1A; distances summarized in Table 1). The four mutually T-oriented tryptophan indoles (W124, W122, W124ʹ, and W122ʹ), which are closely spaced in the interfacial region, form a tight cage (a tryptophan quadruplex). W124 and W122’ indoles on different molecules make several short C-C contacts. In addition, the W124 N-H is in a close (2.3–2.6 Å) interaction with the benzene ring of the W122’ indole (and, similarly between W122 and W124’). Short indole-indole contacts also occur diagonally across the quadruplex (W124-W124’ and W122-W122’). Each Re(dmp) unit is in close contact with a nearly parallel W122’ indole on the neighbor molecule, as well as with W124 on the same molecule. The protein-protein interface is hydrophobic (each W122 and W122’ indole NH group is H-bonded (2.1–2.3 Å) to a water molecule lying in the indole plane). The intermolecular dmp-Cu distance is 8.6 Å shorter than the intramolecular one. Molecular packing in the Re126FWCuII asymmetric unit is very similar: the Re complex lies in a close proximity to the W122’ indole of the other molecule and F124 of one chain interacts with W122’ of the other (3.6 Å, T-oriented, Figure 1C). The molecular interface of Re126FWCuII is nearly superimposable with Re126WWCuII (Figure S1B) and similar to Re126TWCuII (Figure S1C).22 In the case of Re126WFCuII, the two molecules in the asymmetric unit have the regions containing redox cofactors oriented outwards, but facing complementary ET regions of the molecules in neighboring unit cells. Pymol-generated symmetry mates (Figure 1D) show a small-area interface with intermolecular π-stacking between dmp ligands and a short dmp-W124’ intermolecular contact. The interaction between the two Re complexes is similar to that in Re124W122CuII (2I7O, Figure S1D).
Table 1.
Shortest atom-atom intermolecular distances between redox cofactors of Re-azurin mutants. (Only aromatic C and N atoms, as well as Re and Cu are considered. Values were averaged over the molecules comprising the asymmetric unit.)
| Distance (Å) | Re126WWCuII | Re126FWCuII | Re126WFCuII a |
|---|---|---|---|
| Re-W122' | 7.0 | 6.6 | 4.6 |
| dmp–W122' | 3.8b | 3.5c | 3.5 |
| W124–W122' | 3.3 | - | - |
| W124-W124' | 3.5–4.8d | ||
| W122-W122' | 3.7e | ||
| Cu–dmp' | 12.0f | 12.1g | 18.7 |
| Cu–Re' | 15.0 | 15.0 | 20.7 |
| Angle (°) | |||
| dmp–W122' | 15.1 – 10.6 | 23.2 | |
| W124–W122' | 84.4 – 68.1d | - | |
| W124-W124' | 4.3 – 17.6h | - |
Distances measured to W124’. Two interfaces are present. The shorter distances are listed. Distances between the stacked Re complexes: 9.5 Å (Re-Re’), 3.4 Å (dmp-dmp’).
An additional close contact (3.6 Å) exists between the indole ring and C(CH3-dmp).
Shortest W122’ indole-C(CH3-dmp) distance = 3.9 Å.
3.5/4.8 Å and 84.4/68.1° correspond to B-C/A-D interfaces.
T-oriented.
Shortest distance between Cu and C(CH3-dmp) = 12.0 Å.
Shortest distance between Cu and C(CH3-dmp) = 11.9 Å.
4.3/17.6 correspond to B-C/A-D interfaces.
In solutions, azurins and their Re-labeled derivatives form dimers whose structures are assumed to be very close to those found crystallographically.22,28 This assumption was supported by DFT structure optimization of bare {Re(CO)3(dmp)H126L125W124G123W122}2 in water modeled as dielectric-continuum (Figure S2), as well as by QM/MM optimization of the {Re126WWCuI}2 dimer solvated with 2088 explicit water molecules (Figure S3). Both optimization procedures, which were performed without structural constraints, well reproduced the interfacial structure of the crystal, including the interactions and distances between cofactors (Table S2). It follows that the interface is predominantly stabilized by electronic interactions and dispersion between the cofactors.
Photoinduced Electron Transport
Photocycles of Re126FWCu, Re126WWCu, and Re126WFCu were investigated at concentrations in the 0.2–2 mM range by time-resolved luminescence that reports on the decay kinetics of *Re in the 3CT excited state, and by time-resolved IR spectroscopy (TRIR) that exhibits features29 specific for 3CT (*Re) and reduced ReI(H126)(CO)3(dmp•−) that occurs in CS and RP states. (The 3CT, CS, and RP notation is used similarly to Scheme 1.)
The Re126FWCu photocycle.
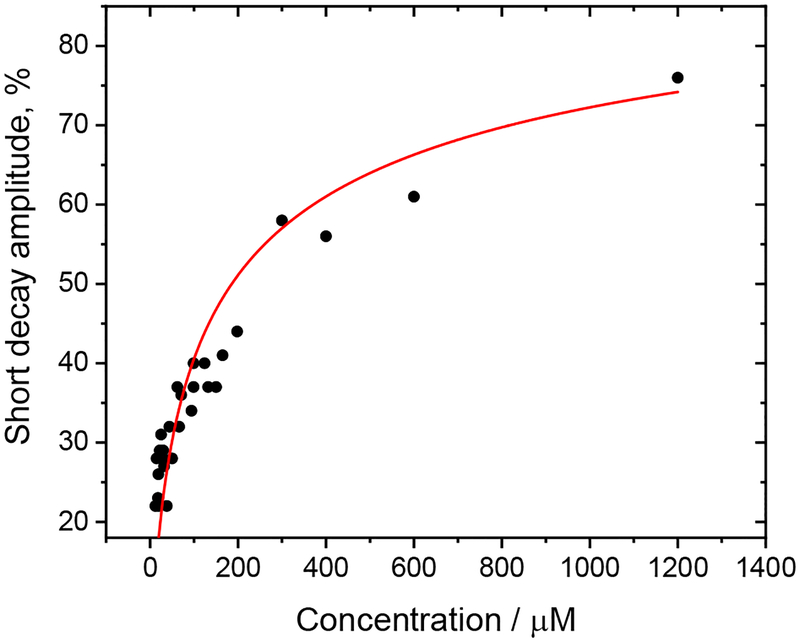
This azurin is largely unreactive upon 400 or 355 nm irradiation at low concentrations (≤ 40 μM) since the intramolecular distance between the Re(H126)(CO)3(dmp) and the W122 indole (7.1 Å) is too long to support excited-state ET, effectively decoupling the Re and Cu centers.21 Excitation of the Re label in Re126FWCuI at 400 or 355 nm populates the 3CT state (Scheme 1) whose photoluminescence decays multiexponentially with a principal lifetime of 1.15 μs21 that shortens to ~300 ns in the CuII derivative, presumably by energy transfer to lower-lying CuII-localized electronic states. The relative amplitude of the 300 ns decay component decreases with increasing Re126FWCuII concentration, while shorter-lived kinetics (5–8, ~50 ns) gain in prominence, their amplitudes asymptotically increasing (Figure 2, Table S3). In analogy with Re126TWCuII,22 we have attributed the short-lived decay kinetics to a photoreactive dimer {Re126FWCuII}2, where the *Re luminescence is quenched by intermolecular W122’→//*Re ET (//denotes the protein-protein interface). The concentration dependence of the relative amplitude of the short decay kinetics was analyzed22 assuming that a photoreactive dimer is in equilibrium with an unreactive monomer (~300 ns lifetime). The estimated dimerization constant of 1.6×10⁴ M−1 is ca. 2.6× higher than in the case of Re126TWCuII,22 likely due to the presence of a second aromatic residue (F124) at the interface.
Figure 2.
Concentration dependence of the amplitude of the short emission decay component(s) of Re126FWCuII in H2O, 20 mM NaPi, pH ≅ 7.2. The red curve shows the fit assuming an equilibrium between an unquenched monomer and a partly quenched dimer with a dimerization constant of 1.6×10⁴ M−1. Measured over a 12–1400 μM range. See section S2.1. for experimental details and ref.22 for the analysis procedure.
In the picosecond domain, 0.3–1.2 mM Re126FWCuII solution luminescence decays with a major ~50 ps component whose relative amplitude decreases with increasing luminescence wavelength and decreasing concentration (Tables S4, S5). This behavior, which is attributable to a dynamic Stokes shift, reflects relaxation of the *Re site and its environment.30,31 Minor 540 ns and 5–8 ns decay components are likely related to intermolecular ET between *Re and W122’ in {Re126FWCuII}2.
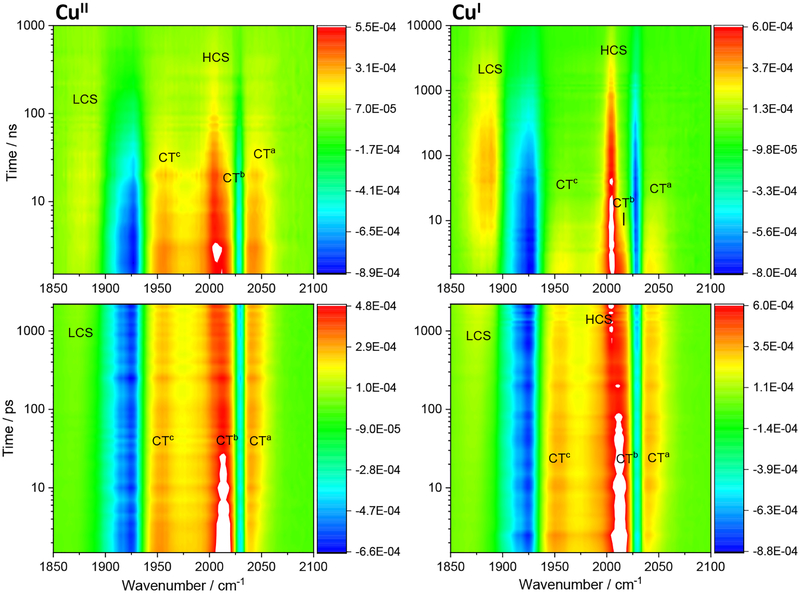
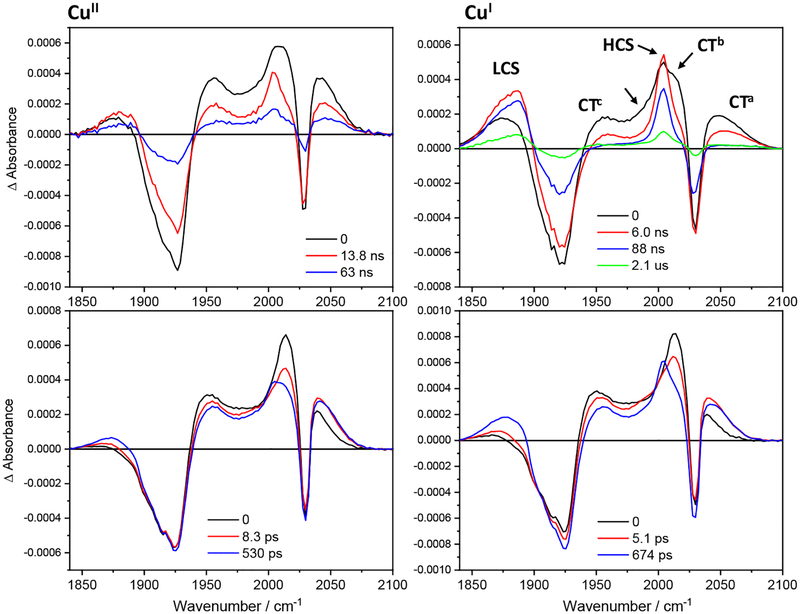
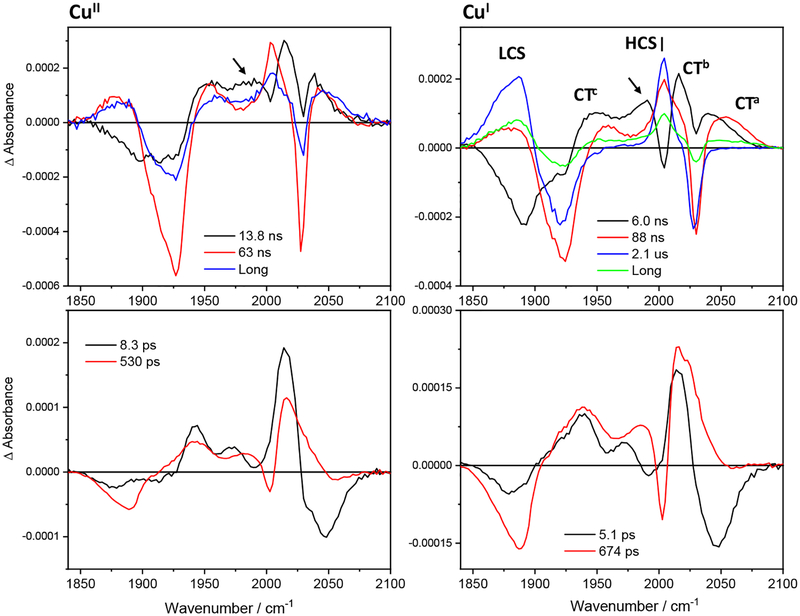
The ET origin of luminescence quenching in concentrated Re126FWCuII solutions was confirmed by TRIR spectra measured in the region of CO stretching vibrations at time delays ranging from 500 fs to tens of microseconds after 400 or 355 nm excitation of the Re label. Difference TRIR spectra of CuII and CuI Re126FWCu (Figure 3) show two negative features due to a bleached ground-state population: a sharp band at ~2028 cm−1 corresponding to the in-phase A’(1) vibration and a broad band around 1926 cm−1 originating from quasidegenerate A” and out-of-phase A’(2) vibrations.32 (Symmetry labelling assumes Cs local symmetry.) CT excitation shifts all ν(CO) bands to higher wavenumbers and lifts the A” / A’(2) quasidegeneracy,29,32,33,34 giving rise to three 3CT (*Re) excited-state bands marked CTa, CTb, and CTc. The bleach and the CT features emerge together with a weak LCS feature within the experiment time resolution of ca. 500 fs. (CS spectral features are due to reduced ReI(H126)(CO)3(dmp•−). They occur at 1885 and 2004 cm−1, abbreviated LCS (Low-CS) and HCS (High-CS), respectively.) The temporal evolution is visualized using evolution- and decay-associated spectra in Figures 4 and 5, obtained by TRIR global kinetics fitting (Table 2). A dynamic shift of the CTa band (and, less, of CTb, CTc) to higher wavenumbers (attributable30,35 to relaxation of the 3CT state) occurs in picosecond and early nanosecond time domains. LCS and HCS increase in intensity and upshift with ~6 and ~600 ps time constants, accompanied by upshift and a small decay of the CT features. Nanosecond spectra exhibit strong CS, CT, and bleach features formed within the laser pulse excitation. Early-time spectra also show a shoulder at ~1985 cm−1 on the left side of the 2004 cm−1 HCS band. Temporal evolution is dominated by concomitant CT decay and CS rise taking place with 14 (CuII) and 6–8 ns (CuI) time constants. The ~1985 cm−1 shoulder disappears and LCS shifts from ~1874 to ~1885 cm−1 concomitantly. For CuII, the CT, CS, and bleach features primarily decay with ~63 ns kinetics, closing the photocycle. In the CuI form, the related 70–90 ns kinetics involve predominantly the CT decay and bleach recovery, as well as minor CS decay. Principal CS decay is much slower, 1–2 μs. Also, the ReI(H126)(CO)3(dmp•−) yield (estimated from the ratio of the LCS and CT band maxima in the nanosecond spectra) is higher in the CuI form. Both the higher CS intensity and longer lifetime indicate that the reduced Re species is stored in long-lived RP. (In addition, a very weak signal persists for both CuII and CuI far into the microsecond range, indicating low-yield formation of a side product containing a reduced Re species, such as a monomer, protein with a deprotonated indole radical W122•, or a dissociated reduced Re complex.)
Figure 3.
Difference TRIR spectra of Re126FWCuII (left) and Re126FWCuI (right). Negative (blue) features correspond to depleted ground-state population; positive features correspond to photogenerated transients (yellow-orange-red-white in the order of increasing intensity). Picosecond spectra (bottom) were measured in 1.2 mM (CuII) and 1 mM (CuI) solutions in D2O, 20 mM KPi, pD ≅ 7.1 using 400 nm, ~50 fs excitation. Nanosecond spectra were measured in 1.3 mM (CuII) and 0.8 mM (CuI) solutions in H2O, 20 mM KPi, pH ≅ 7.1. Excited with 355 nm, ~0.7 ns pulses. CT features (1956, ~2012, 2042 cm−1) decay with a concomitant rise and later decay of both lower- and higher-lying CS bands (LCS, 1885 cm−1 and HCS, 2004 cm−1) and bleach recovery. (Note the 10-times longer time-range in the top-right than the top-left panel.) The LCS overlaps with the 1926 cm−1 bleach, hence the ~1885 cm−1 maximum at ≥10 ns is only apparent.
Figure 4.
Evolution associated spectra of Re126FWCuII (left) and Re126FWCuI (right) obtained by global fit of picosecond (bottom) and nanosecond (top) 3D TRIR data (kinetic/spectral) using a sequential multiexponential model. Black curves are spectra are extrapolated to time 0 and correspond to the species formed within the 355, ~0.7 ns laser pulse excitation. Red, blue and green curves correspond to spectra associated with the specified kinetics. The longest-lifetime spectra correspond to the residual species that remains after a process characterized by the specified time constant and decays on a timescale longer than the measurement. Band labelling in the top-right panel is valid for all spectra shown. The unlabeled arrow indicates the ~1985 cm−1 shoulder. Experimental conditions as in Figure 3, except the top-right spectrum (0.63 mM).
Figure 5.
Decay associated spectra of Re126FWCuII (left) and Re126FWCuI (right) obtained by by global fit of picosecond (bottom) and nanosecond (top) 3D TRIR data (kinetic/spectral) using a sequential multiexponential model. Negative and positive features correspond to signal rise and decay, respectively. Band labelling in the top-right panel is valid for all spectra shown. The unlabeled arrow indicates decay of the ~1985 cm−1 shoulder. Experimental conditions as in Figure 3, except for the top-right spectrum (0.63 mM).
Table 2.
Photochemical kinetics of Re126FWCu at ~1 mM concentration.a
| CuII | CuI | Underlying processes |
|---|---|---|
| 8 ps | 5 ps | CT relaxationb and small CS rise |
| 530 ps | 670 ps | CT relaxationb and decay; CS rise |
| 14 ns | 6–8 ns | CT relaxationb and decay; CS rise |
| 63 ns | CT and CS decay; bleach recovery | |
| 70–90 ns | CT and very small CS decay; bleach recovery | |
| 1.2–2.1ns | RP (CS)c decay and bleach recovery | |
| >1 μS | >10 μs | very weak residual CS decay and bleach recovery |
Time constants were obtained by global fitting of pico- and nanosecond TRIR spectra obtained in several independent experiments. Characters of underlying processes were inferred from the evolution- and decay associated spectra (Figures 4, 5).
Relaxation is manifested by dynamic shifts of the CT bands and a derivative-like shape of the corresponding DAS features.
RP spectral features cannot be distinguished from those of CS (LCS, HCS).
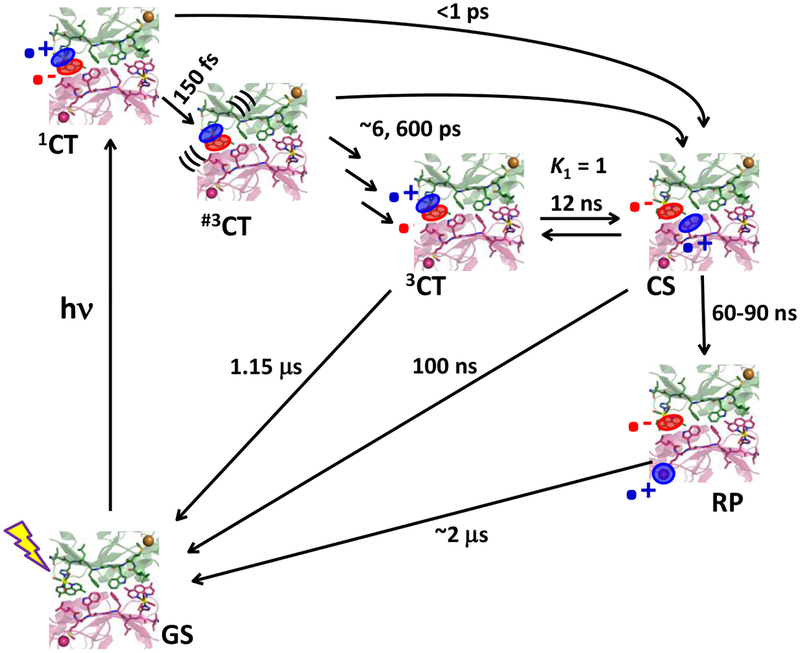
Re126FWCu photobehavior at high concentrations is attributable to a dimer, {Re126FWCu}2, as evidenced by concentration-dependent luminescence decay kinetics (Figure 2) and supported by analogy22 with {Re126TWCuI}2. The similar pico- and early-nanosecond TRIR spectra of CuII and CuI species confirm that *Re is reduced by the W122’ indole. A proposed reaction mechanism is shown in Scheme 2. An optically generated 1CT excited state undergoes ~150 fs intersystem crossing36 to a hot 3CT state and a parallel low-yield conversion to CS by sub-picosecond ET from the W122’ indole on the neighboring protein molecule. The CS presence in the first (0.5 ps) spectrum indicates that *Re and the W122’ indole are in closer contact than possible in monomers (3.5 Å in {Re126FWCuII}2, Table 1). CS formation then continues alongside 3CT relaxation with ca. 6 and 600 ps time constants. (The relaxation process at later stages likely involves changing protein solvation and/or conformations around the Re binding site.30) The (nearly) relaxed 3CT state is in equilibrium with the CS state; and a time constant of 14/8–9 ns (CuII/CuI) was estimated for W122’→//*Re forward ET. The CS state decays to the ground state by ReI(H126)(CO)3(dmp•−)→//W122’•+ ET (approximately 100/50 ns for CuI/CuII) that is kinetically coupled to 3CT decay through equilibrium K1. This reaction closes the CuII photocycle. In the CuI form, the EThop process proceeds further by ~50 ns (CuI)’→(W122•+)’ intramolecular ET, and the photocycle is completed by ~2 μs intermolecular back ET ReI(H126)(CO)3(dmp•−)→//CuII. Additionally, TRIR spectra indicate that there are two CS states: the predominant conformation (2004 cm−1) is formed by the kinetics described above, while the minor one (broadening of the low-wavenumber side of LCS and the ~1985 cm−1 shoulder) is formed at short picosecond times and within the nanosecond excitation pulse. It decays with early ns kinetics, probably by relaxing to the predominant CS state. (Alternatively, with respect to the mechanism described above, two variants of {Re126FWCu}2 could be present in the solution, one undergoing 10–12 ns W122’→*Re ET (as described above) and the other reacting faster, with a hundreds of picoseconds time constant, owing to tighter (shorter) interactions between the cofactors at the protein-protein interface.)
Scheme 2.
The {Re126FWCuI}2 photocycle. Oxidized and reduced sites are shown in blue and red, respectively. The time constants of 3CT→CS and CS→RP conversions and the K1 value were estimated by simulating the kinetics using the model previously applied to Re124W122CuI (formally equivalent to the present case).20 Simulations were performed as described in refs.20,21 The values shown provided 3CT decay lifetimes of 5.5 and 71 ns, approximately matching the TRIR experiment. The scheme is applicable also to CuII-azurin by deleting RP. Reasonable match with experimental CuII luminescence and TRIR data was obtained for K1 = 3, 10 ns 3CT→CS and 50 ns CS→GS conversions. (Unquenched 3CT lifetimes were fixed as 1.15 μs (CuI)21 and 260 ns (CuII, Table S3.)) The “hot” 3CT state is denoted by triple brackets.
The Re126WWCu photocycle.
At low concentrations (≤40 μM), the double-tryptophan mutant undergoes very fast ET (Scheme 1), whereby the *Re luminescence decays with lifetimes of about 270/290 ps (CuI/CuII), 4, and 80 ns (both oxidation states). Excitation of the CuI form results in ~68 ns rise of the CuII absorption at 633 nm, followed by ~120 μs decay.21
The Re126WWCuII luminescence decay in concentrated solutions (≥200 μM) exhibits ~100 and 300–450 ps kinetics whose amplitudes are virtually independent of concentration (Table S6). The 100 ps process likely combines *Re quenching with a dynamic Stokes shift31 (Table S7) due to *Re relaxation dynamics. The 300–450 ps lifetime is only a little longer than that measured in diluted solutions.21 It is related to *Re quenching by W124 and, presumably, also W122’ on the neighboring protein molecule. Nanosecond decay components (Table S8) represent only minor contributions to the overall kinetics. The 4–11 ns lifetime, which is close to that observed for {Re126FWCuII}2 (Table S3), likely results from intermolecular ET. The 66 ns decay has its counterpart in low-concentration experiments and its amplitude decreases with increasing concentration (Table S8). It is pertinent to the intramolecular CS1 decay (ReI(H126)(CO)3(dmp•−)→W124•+) and to its intermolecular counterpart CS1’ involving (W124•+)’ on the other (unexcited) molecule.
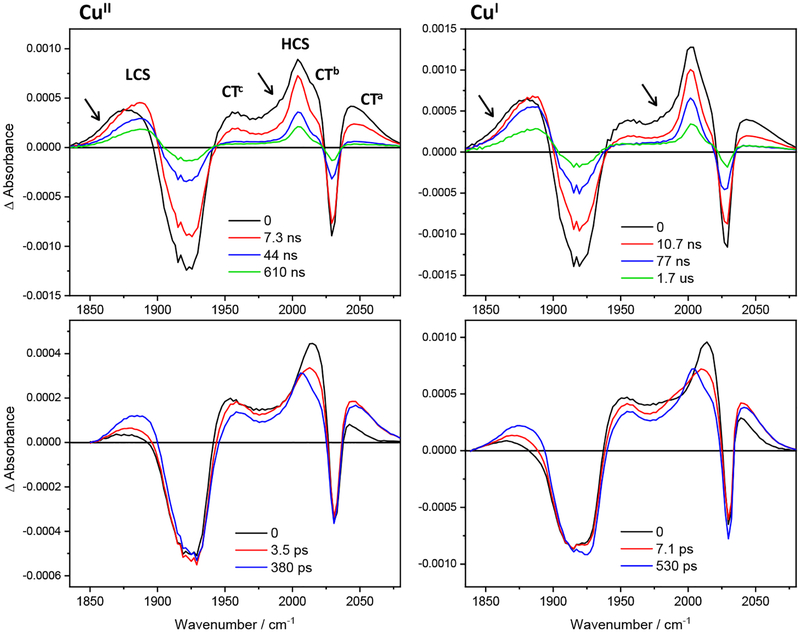
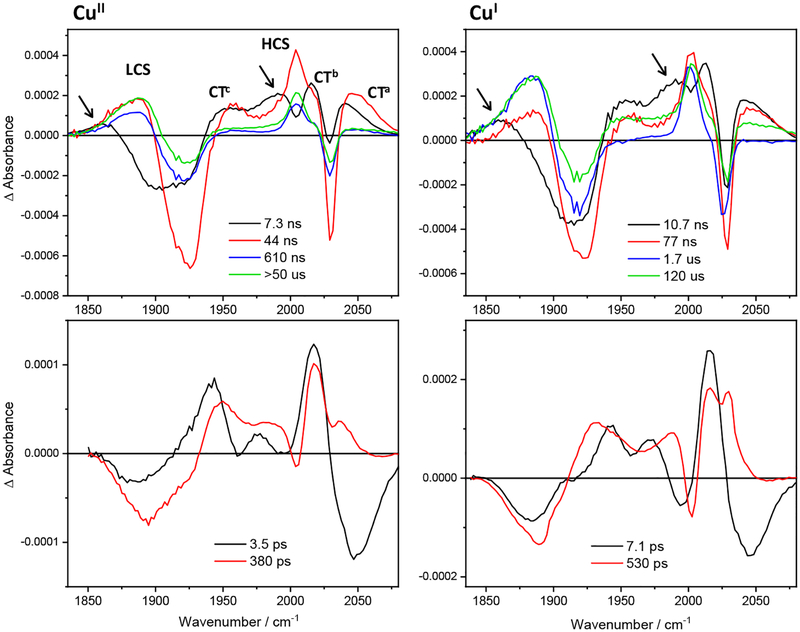
TRIR spectra of Re126WWCu measured at 0.6–2 mM concentrations (Figure S4) are qualitatively similar for CuI and CuII but the two states differ in recombination kinetics (Table 3). Their temporal development is demonstrated by evolution- and decay-associated spectra (Figures 6, 7) xxobtained by TRIR global kinetics fitting. The ground-state bleach, three CT features, and a weak red-shifted LCS band (at 1865 cm−1, accompanied by a ~1985 HCS shoulder) appear immediately after 50 fs excitation. In the picosecond time domain, all three CT features shift to higher wavenumbers and their intensity slightly decreases. The LCS band grows in intensity and shifts higher. The 1985 cm−1 shoulder diminishes and the 2004 cm−1 HCS band emerges and grows with the 380/530 ps kinetics (demonstrated by decay associated spectra, Figure 7-bottom). Nanosecond experiments show strong LCS and HCS, as well as CT features at the earliest time delays after 355 nm, 700 ps excitation. Both CS bands are broadened on their low-energy sides (~1865 cm−1 and a shoulder at ~1985 cm−1). These extra CS shoulders are formed within the 0.7 ns excitation pulse and decay with a 6.5/8.5 ns lifetime (CuII/CuI), together with rising CS (~1880, 2004 cm−1) and decaying CT features. The next 43/78 ns step comprises CS and CT decay. (See Figure S5 for separate 1, 10, and 100 ns spectra.) Longer-time evolution depends on the copper oxidation state. The CuII photocycle is essentially completed in the 43 ns step, leaving only a weak long-lived (600–700 ns, >50 μs) residual signal. On the other hand, CuI spectra exhibit a stronger CS signal that decays with major 1.6 and minor ~120 μs kinetics, accompanied by concomitant bleach recovery. In agreement with TRIR, the transient absorption decay at 633 nm (attributable to CuII in RP20,21) also includes a ~2 μs component (plus longer decays) when measured in 200 and 250 μM solutions, whereas only ~120 μs decay was found at ≤40 μM for combined 500 and 633 nm decay.21
Table 3.
Photochemical kinetics of Re126WWCu at ~1 mM concentration.a
| CuII | CuI | Underlying processes |
|---|---|---|
| 3.5 ps | 7.1 ps | CT upshift;b CS rise and upshift |
| 380 ps | 530 ps | CT decay and upshift;b CS rise and upshift |
| 6.5 ns | 8.5 ns | CT decay; CS upshift and rise; “CS shoulder”c decay |
| 43 ns | 80 ns | CT and CS decay; bleach recovery |
| 470–760 ns | minor CS decay | |
| 1.6 μs | principal RP (CS)d decay; bleach recovery | |
| >50 μs | 120 μse | decay of residual CS;f bleach recovery |
Time constants were obtained by global fitting of pico- and nanosecond TRIR spectra obtained in several independent experiments. Characters of underlying processes were inferred from the decay- and evolution associated spectra (Figures 6,7). 3CT relaxation is demonstrated by dynamic shifts of the CT band in TRIR and corresponding evolution associated spectra, and by a derivative-like shape of the decay associated spectra. Convolution of band shifts (relaxation dynamics) and intensity changes (population dynamics) affects the estimated time-constant values.
CT decay is hard to discern because of simultaneous band shifts and narrowing.
“CS shoulder” refers to ~1855 cm−1 broadening and the 1985 cm−1 shoulder.
RP spectral features cannot be distinguished from those of CS (LCS, HCS).
Value taken from low-concentration experiments21 and fixed in global fits.
Spectra also show a weak decaying background.
Figure 6.
IR evolution associated spectra (EAS) of Re126WWCuII and Re126WWCuI obtained by global fit of picosecond (bottom) and nanosecond (top) 3D TRIR data (kinetic/spectral) using a sequential multiexponential model. Black curves are spectra are extrapolated to time 0 and correspond to the species formed within the 50 fs (bottom) or 0.7 ns (top) laser pulse excitation. Red, blue and green curves correspond to spectra associated with the specified kinetics. The longest-lifetime spectra correspond to the residual species that remains after a process characterized by the specified time constant and decays on a timescale longer than the measurement (120 μs assumed21 for the top-right spectrum.) Band labelling in the top-left panel is valid for all spectra shown. Arrows indicate the LCS early-time broadening and the ~1985 cm−1 shoulder. Experimental conditions as in Figure S4.
Figure 7.
IR decay associated spectra of Re126WWCuII and Re126WWCuI obtained by global fit of picosecond (bottom) and nanosecond (top) 3D TRIR data (kinetic/spectral) using a sequential multiexponential model. Negative and positive features correspond to signal rise and decay, respectively. Band labelling in the top-left panel is valid for all spectra shown. Arrows indicate decay of the LCS early-time broadening and of the ~1985 cm−1 shoulder. Experimental conditions as in Figure S4.
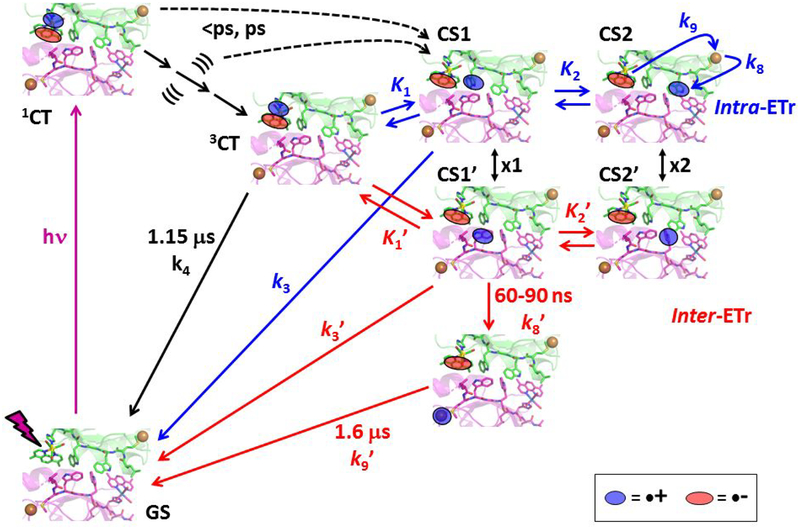
Spectroscopic and kinetics data obtained for CuII and CuI forms of Re126WWCu at high concentrations can be explained by a photocycle that assumes parallel intra- and intermolecular EThop processes in {Re126WWCu}2. The similarity of picosecond and early nanosecond kinetics measured at low and high concentrations and a very weak concentration dependence of Re126WWCuII luminescence decay kinetics suggest that the intra- and intermolecular ET steps occur with comparable rates. Acceleration of ground-state recovery from 120 to 1.6 μs is the main evidence for the occurrence of an intermolecular process. The proposed mechanism is outlined in Scheme 3 and Figure S6: Optical excitation of the Re center produces 1CT that undergoes ~150 fs36 intersystem crossing to a hot 3CT state; and low-yield ET from W124/W122’ populates the CS1 and/or CS1’ states within the first 0.5 ps. Hot 3CT evolves in two relaxation steps (3.5/7.1 ps and 380/530 ps for CuII/CuI) that are coupled with inter- and intramolecular ET from W124 and W122’, producing CS1 and CS1’, respectively. Notably, ET takes place during vibrational cooling, solvation changes, as well as Re binding site reorganization30 (dashed black arrows in Scheme 3). The measured time constants result from convolution of intra- and intermolecular ET with relaxation dynamics. The CS1 (CS1’) state is originally hot, characterized by a downshifted LCS feature and the 1985 cm−1 shoulder. The CS relaxation and formation from 3CT proceed with 380/530 ps and 6.5/8.5 ns lifetimes (CuII/CuI). The latter values also are influenced by CS1/CS1’↔CS2/CS2’ conversion kinetics. The next 43/80 ns combined 3CT+CS decay originates from ReI(H126)(CO)3(dmp•−)→W124•+/(W122•+)’ recombination in CS1/CS1’ states. Intra- and intermolecular charge-separation and recombination (k3, k3’) processes are kinetically coupled through redox equilibria K1 and K1’. In addition, the short intermolecular distance (3.3 Å) and the ~2.3 Å NH-benzene(indole) H-bond suggest the possibility of intermolecular hole hopping between W124 and W122’ residues. The CS1/CS1’ states represents a branching point from which the inter- and intramolecular mechanisms differ. In the intramolecular process, oxidation of W122 to produce CS2 is slightly uphill (K2 = 0.55–0.75; 7–9 ns time constant); it is followed by 60–90 ns CuI→W122•+ ET and 120 μs ReI(H126)(CO)3(dmp•−)→CuII back ET that closes the photocycle (indicated by blue curved arrows in Scheme 3 top-right).21 For the intermolecular mechanism, the CS1’ formation is followed by intramolecular (CuI)’→(W122•+)’ ET in the second molecule. A 60–90 ns time constant is assumed, since the ET pathway is virtually the same as in the monomer. On the other hand, ReI(H126)(CO)3(dmp•−)→//(CuII)’ back ET is much faster in the dimer (1.6 μs) than in the monomer, owing to shorter dmb-Cu distance (see below). Notably, the CS2 and CS2’ states play very different roles in intra- and intermolecular EThop. Whereas CS2 population involves W122 oxidation and hole transfer along the intramolecular EThop pathway toward CuI, W124’ oxidation in CS2’ is a side-reaction that is not involved in the EThop process. Still, the K2’ equilibrium could affect the kinetics by storing holes as (W124•+)’. Also, CS2/CS2’ states afford another possible crossover between inter- and intramolecular pathways through electron (hole) exchange between the two neighboring tryptophans (double arrow x2 in Scheme 3 and Figure S6).
Scheme 3.
Photoinduced electron transfer in {Re126WWCuI}2. Intermolecular ET steps are shown as red arrows, intramolecular ET in blue, common excited-state steps are in black. ((( ))) and the three accompanying black arrows denote hot 3CT state(s) and their relaxation, respectively. Intramolecular CS2 recombination (k7) is omitted for clarity while CuI oxidation (k8), and the ~120 μs BET (k9) are only indicated by curved blue arrows. (See Scheme 1 for the intramolecular mechanism.) Intermolecular CS2’ decay to the GS is neglected as well; it is assumed21 to occur in microseconds. The black double arrows x1 and x2 indicate possible crossovers between the intra- and intermolecular pathways. The red pathway is applicable also to the CuII species by setting k8’ = k9’ = 0. Figure S6 affords another depiction of the mechanism.
The Re126WFCu photocycle.
At low concentrations, the monomer undergoes fast intramolecular W124 photooxidation and a back reaction from CS1 to the ground state. The F122 residue interrupts the intramolecular ET pathway and CuI is not oxidized. Principal *Re luminescence decay lifetimes of ca. 160 ps, 1.6 ns, and 40–80 ns were observed for the CuI form.21 Luminescence from a concentrated (1.8 mM) Re126WFCuII solution decayed with time constants of 50 and 270 ps (convoluted dynamic Stokes shift and ET quenching), ~4 and 40 ns (Table S9). TRIR spectra (Figure S7; evolution- and decay associated spectra in Figures S8, S9) show that the photocycle is very fast for both Cu oxidation states. CS is weakly present in the first spectrum at 0.2 ps and grows with ca. 5, 280 ps (CuII) or 7, 450 ps (CuI) time constants. In nanosecond experiments, a majority of the CS signal emerges during the excitation pulse, including a weak ~1985 cm−1 shoulder that also was seen for the other two azurins. The initial nanosecond spectral evolution (11/8 ns for CuII/CuI) is attributable to interfacial EThop. It consists of an LCS shift to higher wavenumbers, LCS and HCS intensity growth, LCS narrowing, and decay of CT bands and the 1985 cm−1 shoulder. The photocycle is completed with simultaneous CT and CS decay and bleach recovery that occur with a 40–50 ns time constant for both Cu oxidation states. The similarity of high- and low-concentration21 luminescence decay kinetics, as well as the virtual independence of TRIR decay kinetics on Cu oxidation state, suggests that the photoreactivity at high concentrations also is mainly limited to the Re/W124/W122’ unit (Figure 1). (However, a weak long-lived (>> 50 μs) residual LCS/HCS signal was observed for CuI, which indicates a low-yield side reaction producing a species containing a reduced Re complex. Hence, partial CuI oxidation in some of the oligomers cannot be excluded.)
DISCUSSION
Azurin dimerization (oligomerization) at higher concentrations22,28 profoundly changes the photobehavior of the Re-labeled protein. Namely, it enables photoinduced electron transport in Re126FWCuI and decreases the RP (CuII) lifetime in the Re126WWCuI photocycle (from 120 to 1.6 μs). Dimer photoreactivity can be understood assuming that interfacial protein-protein contacts in solution are close to those determined in crystal structures of CuII azurins that was supported by QM/MM structure optimization (Figures 1, S1–S3 and Tables 1, S2). In {Re126FWCuII}2, the pico- and early nanosecond rates of the (W122)’→//*Re step are fully compatible with the short distance (3.5 Å) and near stacking (23°) between the dmp ligand of the Re label and the W122’ indole. Such cofactor arrangement is very similar to that in Re124W122CuII where an EThop mechanism is dominant.20 The hundreds-of-picoseconds and units-of-nanoseconds rates are attributable to ET to *Re in different stages of relaxation and/or to dimers with slightly different interfacial structures. (This behavior was observed for all three investigated azurins, as well as for22 {Re126TWCu}2.) The ~1.6 μs time constant of ReI(H126)(CO)3(dmp•−)→//CuII back ET in {Re126FWCuII}2 is compatible with the 12.1 Å dmp-Cu distance. An analogous 3.1 μs intramolecular step in Re124W122CuII occurs over 16 Å.20 Based only on distances, a time constant of 42 ns can be estimated for {Re126FWCuII}2. However, the intramolecular Cu-dmp ET pathway in {Re126FWCuII}2 involves a large space jump that would diminish electronic coupling, resulting in 1.6 μs back ET. Generally, the intermolecular EThop in {Re126FWCuII}2 is similar to that in {Re126TWCuII}2.22 The protein-protein interaction in the F124 mutant is stronger due to the presence of two aromatic residues in each molecule.
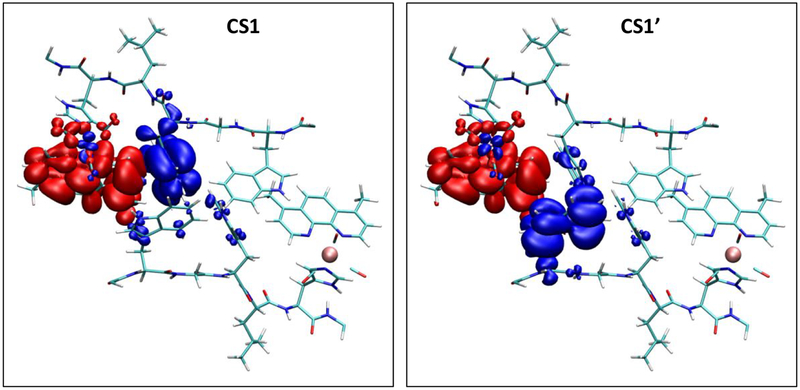
Both intra- and intermolecular EThop are operational in {Re126WWCuI}2; and the intermolecular process is similar to that in {Re126FWCuI}2. The forward and back ET steps follow essentially the same pathways in both azurins and their time constants are comparable within experimental accuracy. Intermolecular (ultra)fast *Re oxidation is enabled by the short (3.8 Å) and nearly stacked (11–15 °) arrangement of dmp and W122’ cofactors at the interface (Figure 1B, Table 1). The {Re126WWCuII}2 structure exhibits an interfacial tryptophan quadruplex where the indoles along individual chains and across the interface are separated by 3.9 and 3.3 Å, respectively, and an NH-aromatic interaction occurs between W124 and W122’, as well as W122 and W124’ (Figure 1B). Whereas ET between the two tryptophans (K2 in Schemes 1 and 3) is essential for long-range intramolecular hopping, we found no kinetics evidence for its role in intermolecular EThop. In fact, oxidation of W124’ of the neighboring molecule is a “dead end” that does not facilitate CuI oxidation but could temporarily trap oxidizing equivalents, prolonging the CS1 lifetime but diminishing its population. Moreover, the close proximity of W•+ and W of the two chains could enable ET between the two protein molecules and, hence, crossovers between intra- and intermolecular EThop pathways (marked x1 and x2 in Scheme 3). The viability of the tryptophan quadruplex functioning as a “hole storage” or as an ET crossover unit depends on the strength of electronic coupling along and between azurin molecules. The TDDFT-calculated electron-density difference between CS1 and the ground state of solvated {Re126WWCuI}2 (Figure 8) shows predominant hole localization on W124, with much less delocalization over W122’ of the neighboring molecule and W124’. The CS1’ state, which lies slightly higher in energy, has the hole predominantly on W122’, only little delocalized to W124 and W124’. Calculations thus support the occurrence of parallel W124→*Re and W122’→//*Re electron “hops” and the existence of spatially and energetically distinct CS1 and CS1’ states. Albeit limited, the hole delocalization indicates intermolecular (W122’ - W124), as well as intramolecular (W122’-W124’) electronic coupling. Of interest also is minor hole delocalization from W124•+ (CS1) and (W124•+)’ (CS1’) over the CH2 group to the peptide backbone.
Figure 8.
Electron density difference between the CS1 (left) and CS1’ (right) states and the ground state of solvated {Re126WWCuI}2. Red and blue denote regions of increased and depleted electron density, respectively. (TDDFT calculation on the QM/MM-optimized structure.)
For Re126WFCu, the crystal structure (Figure 1D) indicates pairing through Re complexes by dmp-dmp stacking. The W124’ indole of a neighboring molecule is in contact with the excited Re label, as is W124 on the same protein molecule. Both intra- and intermolecular EThop can be operational but without oxidizing either of the CuI atoms that remain too far and decoupled from the *Re126W124//W124’ site.
In addition to characterizing photogenerated intermediates and providing kinetics information,29 TRIR spectra also revealed that *Re and its binding site undergo cooling and structural relaxation30,35 on the same time scale as forward ET from neighboring W124 and/or W122’. Electron and structural dynamics thus seem to be (partly) coupled, which could influence both the driving force and reorganization energy.29 In addition, CS1 is, in the initial reaction phases, formed unequilibrated (hot) and its relaxation extends into the nanosecond domain (for {Re126WWCuII}2, the observed CS IR-spectral changes may also reflect redistribution of the “hole” within the tryptophan quadruplex).
CONCLUDING REMARKS
Investigations of tryptophan-containing azurin mutants keep revealing new aspects of long-range electron transport and design principles for functional protein-based systems. Tryptophan facilitates ET in azurins by two mechanisms: increasing electronic coupling along single-step tunneling pathways (ca. 3.5-fold)9 and by enabling long-range multistep tunneling (hopping) that results in 100- and 10,000-fold ET accelerations in Re124W122CuI and Re126WWCuI, respectively.20,21,37 In both systems, hopping accelerates forward electron transport from CuI to the electronically excited Re label, whereas back ET occurs as (much slower) single-step tunneling. This combination of mechanisms has a “rectification” effect on photoinduced electron transport, resulting in very fast formation of a long-lived CuII-containing redox product (RP, 120 μs in the case of Re126WWCuI, Scheme 1). On the other hand, the redox pathways in Re126FWCuI and Re126WFCuI are disconnected (one next to the Re sensitizer, the other next to the Cu site). Hence, photoinduced ET does not occur in the Re126FWCuI monomer and the Re126WFCuI ET photocycle is restricted to the Re126W124 unit.
The kinetics and mechanisms of EThop through tryptophan chains in azurin mutants change upon dimer formation, whereby the two protein molecules pair through redox-active regions. Notably, we have observed an onset of EThop reactivity when redox cofactors are in close proximity at the protein-protein interface in {Re126FWCuI}2. In the case of {Re126WWCuI}2, competition and crossover between inter- and intramolecular pathways, as well as transient hole trapping take place in an interfacial quadruplex of tightly spaced tryptophans, resembling charge splitting in guanine quadruplexes.38 The redox-product lifetime is ~80× diminished relative to the monomer since the interfacial recombination ET pathway is shorter than the intramolecular one.
Hole hopping through protein complexes is common in natural systems, including cytochrome c peroxidase,39,40,41 multicopper oxidases,2 and ribonucleotide reductase.42,43,44 Hopping between interfacial aromatic amino acids can protect enzymes from oxidative damage.17,24,26,27 Of interest is that reactions of a sensitizer-modified ribonucleotide reductase can be promoted by photoinduced proton-coupled hopping across a subunit interface.45,46 Our understanding of hole hopping through structurally characterized protein-protein interfaces could aid in designing artificial (photo)enzymes to drive substrate redox transformations, as well as molecules and materials for bioelectronic applications,47,48,49,50 where intermolecular electron hopping contacts could be engineered into protein films to facilitate solid-state electron transport.
MATERIALS AND METHODS
Materials.
Pseudomonas aeruginosa all-Phe azurin (H83Q/Y72F/Y108F/W48F) mutants K122W/T124W/T126H, K122F/T124W/T126H, and K122W/T124F/T126H were prepared, labeled with [Re(H2O)(CO)3(dmp)](OTf), and handled as described previously.21 Reduction to CuI was performed by slow stepwise addition of the smallest possible amount of concentrated (typically 6×10⁻² M) sodium dithionate solution. (Typically 8 μL of 1–2 mM azurin solution plus 1–2 μL dithionate.) For TRIR experiments, azurin solutions (~8 μL) were placed in a Hellma CaF2 microcell with 50 μm deep, 7 mm diameter depression with an optical-quality surface and covered with a CaF2 window. The cell was raster-scanned in two dimensions during the measurement to prevent photodecomposition. Hellma fluorescence microcells (optical path 1.5 × 1.5 mm) were used for TCSPC measurements.
Time-resolved infrared spectroscopy (TRIR) experiments were carried out at the Central Laser Facility, STFC Rutherford Appleton Laboratory (UK) on the ULTRA instrument that was described in detail elsewhere.22,51 In picosecond experiments, the samples were excited either with 400 or 355 nm, 50 fs (fwhm), ~1 μJ laser pulses at 10 kHz repetition rate and probed with ca. 400 cm−1 wide mid-IR pulses of ~50 fs duration The time intervals between pump and probe pulses were controlled by an optical delay line. The spectra were recorded on two 128-element HgCdTe detectors. Spectral resolution varies from 1.9 to 2.4 cm−1 across the measured range. experiments employed the same probe and detection system that were electronically synchronized with 355 nm, 0.7 ns, ~1 μJ fwhm pulses. TRIR spectra are shown in a difference mode whereby the positive and negative features correspond to photogenerated transients and bleached ground-state absorption, respectively. Global kinetics fitting of TRIR spectra was performed using the Glotaran software. Time constant values shown in figures of decay and evolution associated spectra are pertinent to the respective experiment shown. Values in kinetics tables are averaged over several independent experiments and reported with ±10–20% accuracy. Typical spectral and kinetics fits are shown in the SI, Section S4, Figures S10–17.
Luminescence decays of concentrated samples (≥200 μM) were measured using the time-correlated single photon counting technique (TCSPC) on an IBH 5000 U SPC instrument equipped with a cooled Hamamatsu R3809U-50 microchannel plate photomultiplier with ~40 ps time resolution. Samples were excited at 373 nm with an IBH NanoLED-11 diode laser (80 ps fwhm). The signal was kept below 2% of the light source repetition rate to avoid shortening of the recorded lifetime due to the pile-up effect. Decays were fitted using the iterative reconvolution procedure with IBH DAS6 software to a multiexponential function convoluted with the experimental instrument response function.
Computational details.
The {Re126WWCuI}2 structure was optimized at quantum mechanical/molecular mechanical (QM/MM) level in Terachem 1.952,53 – Amber 1454 framework. Parallel optimization of the QM part was performed by Terachem 11.9 or Gaussian 1655 (G16) program packages. The initial dimer structure was based on the experimental crystal structure. Calculations of the QM part utilized LAN2DZ quasirelativistic effective core pseudopotentials and a corresponding optimized set of basis functions for Re56 and 6–31g(d) polarized double-ζ basis sets57 for remaining atoms. DFT employed the PBE0 hybrid functional,58,59 together with an empirical dispersion correction D3.60
The QM region contained residues 122–126 (W-G-W-L-H) and the Re-complex; and the rest of the system was in the MM region (Figure S3). The QM region was terminated by linking-H-atoms, which were attached to the C alpha atom on the protein backbone. This system was solvated by 2088 SPC/E water molecules61, resulting in minimum 28 Å water shell around central Trp residues; 2 Na+ cations62 were added (in proximity of negatively charged residues ASP21, and ASP191) to compensate the charge of the protein chain. The solvent continuum within G16 was described by a polarizable continuum model (PCM).63. The lowest lying excitations were calculated by TDDFT approach at QM/MM and QM optimized structures.
Supplementary Material
ACKNOWLEDGMENTS
This work was supported by the National Institute of Diabetes and Digestive and Kidney Diseases of the National Institutes of Health under award number R01DK019038. The content is solely the responsibility of the authors and does not necessarily represent the official views of the National Institutes of Health. Further support was provided the Czech Science Foundation (GAČR) grant 17–011375, the Czech Ministry of Education (MŠMT) grant LTAUSA18026, “IT4Innovations National Supercomputing Center – LM2015070”, EPSRC grant (UK) EP/R029687/1, the STFC Rutherford Appleton Laboratory (UK), and the Arnold and Mabel Beckman Foundation. We thank Dr. Hana Kvapilová (JH Institute) for her help with measuring TRIR spectra. Yuling Shen (Caltech) is acknowledged for her help with protein preparation.
Footnotes
Supporting Information
The Supporting Information is available free of charge on the ACS Publications website at DOI…. Interfacial experimental and calculated azurin stuctures, intramolecular cofactor distances, concentration- and wavelength dependent luminescence decay kinetics, TRIR spectra, reaction scheme for Re126WWCuI.
The authors declare no competing financial interest
References
- 1.Winkler JR; Gray HB, Electron Flow through Metalloproteins. Chem. Rev 2014, 114, 3369–3380. [DOI] [PMC free article] [PubMed] [Google Scholar]
- 2.Farver O; Pecht I, Electron transfer in blue copper proteins. Coord. Chem. Rev 2011, 255, 757–773. [Google Scholar]
- 3.Winkler JR; Di Bilio AJ; Farrow NA; Richards JH; Gray HB, Electron tunneling in biological molecules. Pure Appl. Chem 1999, 71, 1753–1764. [Google Scholar]
- 4.Di Bilio AJ; Hill MG; Bonander N; Karlsson BG; Villahermosa RM; Malmström BG; Winkler JR; Gray HB, Reorganization Energy of Blue Copper: Effects of Temperature and Driving Force on the Rates of Electron Transfer in Ruthenium- and Osmium-Modified Azurins. J. Am. Chem. Soc 1997, 119, 9921–9922. [Google Scholar]
- 5.Skov LK; Pascher T; Winkler JR; Gray HB, Rates of Intramolecular Electron Transfer in Ru(bpy)2(im)(His83)-Modified Azurin Increase below 220 K. J. Am. Chem. Soc 1998, 120, 1102–1103. [Google Scholar]
- 6.Grădinaru C; Crane BR, Comparison of Intra- vs Intermolecular Long-Range Electron Transfer in Crystals of Ruthenium-Modified Azurin. J. Phys. Chem. B 2006, 110, 20073–20076. [DOI] [PubMed] [Google Scholar]
- 7.Farver O; Pecht I, Long Range Intramolecular Electron Transfer in Azurins. J. Am. Chem. Soc 1992, 114, 5764–5767. [DOI] [PMC free article] [PubMed] [Google Scholar]
- 8.Farver O; Marshall NM; Wherland S; Lu Y; Pecht I, Designed azurins show lower reorganization free energies for intraprotein electron transfer. Proc. Natl. Acad. Sci. U.S.A 2013, 110, 10536–10540. [DOI] [PMC free article] [PubMed] [Google Scholar]
- 9.Farver O; Skov LK; Young S; Bonander N; Karlsson BG; Vänngård T; Pecht I, Aromatic Residues May Enhance Intramolecular Electron Transfer in Azurin. J. Am. Chem. Soc 1997, 119, 5453–5454. [Google Scholar]
- 10.van de Kamp M; Floris R; Hali FC; Canters GW, Site-Directed Mutagenesis Reveals That the Hydrophobic Patch of Azurin Mediates Electron Transfer. J. Am. Chem. Soc 1990, 112, 907–908. [Google Scholar]
- 11.Beratan DN; Liu C; Migliore A; Polizzi NF; Skourtis SS; Zhang P; Zhang Y, Charge Transfer in Dynamical Biosystems, or The Treachery of (Static) Images. Acc. Chem. Res 2015, 48, 474–481. [DOI] [PMC free article] [PubMed] [Google Scholar]
- 12.Beratan DN; Spiros S Skourtis SS; Balabin IA; Balaeff A; Shahar Keinan S; Ravindra Venkatramani R; Dequan Xiao D, Steering Electrons on Moving Pathways. Acc. Chem. Res 2009, 42, 1669–1678. [DOI] [PMC free article] [PubMed] [Google Scholar]
- 13.Skourtis SS; Balabin IA; Kawatsu T; Beratan DN, Protein dynamics and electron transfer: Electronic decoherence and non-Condon effects. Proc. Natl. Acad. Sci. USA 2005, 102, 3552–3557. [DOI] [PMC free article] [PubMed] [Google Scholar]
- 14.Regan JJ; Onuchic JN, Electron Transfer Tubes. Adv. Chem. Phys 1999, 107, 497–554. [Google Scholar]
- 15.Narth C; Gillet N; Cailliez F; Lévy B; Aurélien de la Lande, A., Electron Transfer, Decoherence, and Protein Dynamics: Insights from Atomistic Simulations. Acc. Chem. Res 2015, 48, 1090–1097. [DOI] [PubMed] [Google Scholar]
- 16.Kretchmer JS; Boekelheide N; Warren JJ; Winkler JR; Gray HB; Miller III TF, Fluctuating hydrogen-bond networks govern anomalous electron transfer kinetics in a blue copper protein. Proc. Natl. Acad. Sci. U.S.A 2018, 115, 6129–6134. [DOI] [PMC free article] [PubMed] [Google Scholar]
- 17.Winkler JR; Gray HB, Long-Range Electron Tunneling. J. Am. Chem. Soc 2014, 136, 2930–2939. [DOI] [PMC free article] [PubMed] [Google Scholar]
- 18.Warren JJ; Winkler JR; Gray HB, Hopping maps for photosynthetic reaction centers. Coord. Chem. Rev 2013, 257, 165–170. [DOI] [PMC free article] [PubMed] [Google Scholar]
- 19.Gray HB; Winkler JR, Electron tunneling through proteins. Q. Rev. Biophys 2003, 36, 341–372. [DOI] [PubMed] [Google Scholar]
- 20.Shih C; Museth AK; Abrahamsson M; Blanco-Rodriguez AM; Di Bilio AJ; Sudhamsu J; Crane BR; Ronayne KL; Towrie M; Vlček A Jr.; Richards JH; Winkler JR; Gray HB, Tryptophan-Accelerated Electron Flow Through Proteins. Science 2008, 320, 1760–1762. [DOI] [PubMed] [Google Scholar]
- 21.Takematsu K; Williamson HR; Nikolovski P; Kaiser JT; Sheng Y; Pospíšil P; Towrie M; Heyda J; Hollas D; Záliš S; Gray HB; Vlček A; Winkler JR, Two tryptophans are better than one in accelerating electron flow through a protein. ACS Cent. Sci, DOI: 10.1021/acscentsci.8b00882 2019. [DOI] [PMC free article] [PubMed] [Google Scholar]
- 22.Takematsu K; Williamson H; Blanco-Rodríguez AM; Sokolová L; Nikolovski P; Kaiser JT; Towrie M; Clark IP; Vlček A Jr.; Winkler JR; Gray HB, Tryptophan-accelerated electron flow across a protein-protein interface. J. Am. Chem. Soc 2013, 135, 15515–15525. [DOI] [PMC free article] [PubMed] [Google Scholar]
- 23.Warren JJ; Herrera N; Hill MG; Winkler JR; Gray HB, Electron Flow through Nitrotyrosinate in Pseudomonas aeruginosa Azurin. J. Am. Chem. Soc 2013, 135, 11151–11158. [DOI] [PMC free article] [PubMed] [Google Scholar]
- 24.Gray HB; Winkler JR, The Rise of Radicals in Bioinorganic Chemistry. Isr. J. Chem 2016, 56, 640–648 [DOI] [PMC free article] [PubMed] [Google Scholar]
- 25.Gupta A; Nederlof I; Sottini S; Tepper AWJW; Groenen EJJ; Thomassen EAJ; Canters GW, Involvement of Tyr108 in the Enzyme Mechanism of the Small Laccase from Streptomyces coelicolor. J. Am. Chem. Soc 2012, 134, 18213–18216. [DOI] [PubMed] [Google Scholar]
- 26.Gray HB; Winkler JR, Hole hopping through tyrosine/tryptophan chains protects proteins from oxidative damage. Proc. Natl. Acad. Sci. U.S.A 2015, 112, 10920–10925. [DOI] [PMC free article] [PubMed] [Google Scholar]
- 27.Winkler JR; Gray HB, Electron flow through biological molecules: does hole hopping protect proteins from oxidative damage? QRB Discovery 2015, 48, 411–420. [DOI] [PMC free article] [PubMed] [Google Scholar]
- 28.Sokolová L; Williamson H; Sýkora J; Hof M; Gray HB; Brutschy B; Vlček A Jr., Mass Spectrometric Characterization of Oligomers in Pseudomonas aeruginosa Azurin Solutions. J. Phys. Chem. B 2011, 115, 4790–4800. [DOI] [PMC free article] [PubMed] [Google Scholar]
- 29.Vlček A; Kvapilová H; Towrie M; Záliš S, Electron-Transfer Acceleration Investigated by Time Resolved Infrared Spectroscopy. Acc. Chem. Res 2015, 48, 868–876. [DOI] [PubMed] [Google Scholar]
- 30.Blanco-Rodríguez AM; Busby M; Ronayne KL; Towrie M; Grădinaru C; Sudhamsu J; Sýkora J; Hof M; Záliš S; Di Bilio AJ; Crane BR; Gray HB; Vlček A Jr., Relaxation Dynamics of [ReI(CO)3(phen)(HisX)]+ (X = 83, 107, 109, 124, 126) Pseudomonas aeruginosa Azurins. J. Am. Chem. Soc 2009, 131, 11788–11800. [DOI] [PubMed] [Google Scholar]
- 31.Horng ML; Gardecki JA; Papazyan A; Maroncelli M, Subpicosecond Measurements of Polar Solvation Dynamics: Coumarin 153 Revisited. J. Phys. Chem 1995, 99, 17311–17337. [Google Scholar]
- 32.Vlček A Jr., Ultrafast Excited-State Processes in Re(I) Carbonyl-Diimine Complexes: From Excitation to Photochemistry. Top. Organomet. Chem 2010, 29, 73–114. [Google Scholar]
- 33.Dattelbaum DM; Omberg KM; Hay PJ; Gebhart NL; Martin RL; Schoonover JR; Meyer TJ, Defining Electronic Excited States Using Time-Resolved Infrared Spectroscopy and Density Functional Theory Calculations. J. Phys. Chem. A 2004, 108, 3527–3536. [Google Scholar]
- 34.Dattelbaum DM; Omberg KM; Schoonover JR; Martin RL; Meyer TJ, Application of Time-Resolved Infrared Spectroscopy to Electronic Structure in Metal-to-Ligand Charge-Transfer Excited States. Inorg. Chem 2002, 41, 6071–6079. [DOI] [PubMed] [Google Scholar]
- 35.Liard DJ; Busby M; Matousek P; Towrie M; Vlček A Jr., Picosecond Relaxation of 3MLCT Excited States of [Re(Etpy)(CO)3(dmb)]+ and [Re(Cl)(CO)3(bpy)] as Revealed by Time-Resolved Resonance Raman, IR and UV-Vis Absorption Spectroscopy. J. Phys. Chem. A 2004, 108, 2363–2369. [Google Scholar]
- 36.El Nahhas A; Consani C; Blanco-Rodríguez AM; Lancaster KM; Braem O; Cannizzo A; Towrie M; Clark IP; Záliš S; Chergui M; Vlček A Jr., Ultrafast Excited-State Dynamics of Rhenium(I) Photosensitizers [Re(Cl)(CO)3(N,N)] and [Re(imidazole)(CO)3(N,N)]+: Diimine Effects. Inorg. Chem 2011, 50, 2932–2943. [DOI] [PubMed] [Google Scholar]
- 37.Blanco-Rodríguez AM; Di Bilio AJ; Shih C; Museth AK; Clark IP; Towrie M; Cannizzo A; Sudhamsu J; Crane BR; Sýkora J; Winkler JR; Gray HB; Záliš S; Vlček A Jr., Phototriggering Electron Flow through ReI-modified Pseudomonas aeruginosa Azurins. Chem. Eur. J 2011, 17, 5350–5361. [DOI] [PMC free article] [PubMed] [Google Scholar]
- 38.Sha R; Xiang L; Liu C; Balaeff A; Zhang Y; Zhang P; Li Y; Beratan DN; Tao N; Seeman NCS, Charge splitters and charge transport junctions based on guanine quadruplexes. Nat. Nanotech 2018, 13, 316–321. [DOI] [PubMed] [Google Scholar]
- 39.Jiang N; Kuznetsov A; Nocek JM; Hoffman BM; Crane BR; Hu X; Beratan DN, Distance-Independent Charge Recombination Kinetics in Cytochrome c-Cytochrome c Peroxidase Complexes: Compensating Changes in the Electronic Coupling and Reorganization Energies. J. Phys. Chem. B 2013, 117, 9129–9141. [DOI] [PMC free article] [PubMed] [Google Scholar]
- 40.Hoffman BM; Celis LM; Cull DA; Patel AD; Seifert JL; Wheeler KE; Wang J; Yao J; Kurnikov IV; Nocek JM, Differential influence of dynamic processes on forward and reverse electron transfer across a protein–protein interface. Proc. Natl. Acad. Sci. USA 2005, 102, 3564–3569. [DOI] [PMC free article] [PubMed] [Google Scholar]
- 41.Seifert JL; Pfister TD; Nocek JM; Lu Y; Hoffman BM, Hopping in the Electron-Transfer Photocycle of the 1:1 Complex of Zn-Cytochrome c Peroxidase with Cytochrome c. J. Am. Chem. Soc 2005, 127, 5750–5751. [DOI] [PubMed] [Google Scholar]
- 42.Minnihan EC; Nocera DG; Stubbe J, Reversible, Long-Range Radical Transfer in E. coli Class Ia Ribonucleotide Reductase. Acc. Chem. Res 2013, 46, 2524–2535 [DOI] [PMC free article] [PubMed] [Google Scholar]
- 43.Sjöberg BM; Reichard P, Nature of the free radical in ribonucleotide reductase from Escherichia coli. J. Biol. Chem 1977, 252, 536‐541. [PubMed] [Google Scholar]
- 44.Ehrenberg A; Reichard P, Electron Spin Resonance of the Iron ‐ containing Protein B2 from Ribonucleotide Reductase. J. Biol. Chem 1972, 247, 3485‐3488. [PubMed] [Google Scholar]
- 45.Olshansky L; Stubbe J; Nocera DG, Charge-Transfer Dynamics at the α/β Subunit Interface of a Photochemical Ribonucleotide Reductase. J. Am. Chem. Soc 2016, 138, 1196–1205. [DOI] [PMC free article] [PubMed] [Google Scholar]
- 46.Olshansky L; Greene BL; Finkbeiner C; Stubbe J; Nocera DG, Photochemical Generation of a Tryptophan Radical within the Subunit Interface of Ribonucleotide Reductase. Biochemistry 2016, 55, 3234–3240. [DOI] [PMC free article] [PubMed] [Google Scholar]
- 47.Ron I; Pecht I; Sheves M; Cahen D, Proteins as Solid-State Electronic Conductors. Acc. Chem. Res 2010, 43, 945–953. [DOI] [PubMed] [Google Scholar]
- 48.Yu X; Lovrincic R; Sepunaru L; Li W; Vilan A; Pecht I; Sheves M; Cahen D, Insights into Solid-State Electron Transport through Proteins from Inelastic Tunneling Spectroscopy: The Case of Azurin. ACS Nano 2015, 10, 9955–9963. [DOI] [PubMed] [Google Scholar]
- 49.Sepunaru L; Pecht I; Sheves M; Cahen D, Solid-State Electron Transport across Azurin: From a Temperature-Independent to a Temperature-Activated Mechanism. J. Am. Chem. Soc 2011, 133, 2421–2423. [DOI] [PubMed] [Google Scholar]
- 50.Li W; Sepunaru L; Amdursky N; Cohen SR; Pecht I; Sheves M; Cahen D, Temperature and Force Dependence of Nanoscale Electron Transport via the Cu Protein Azurin. ACS Nano 2012, 6, 10816–10824. [DOI] [PubMed] [Google Scholar]
- 51.Greetham G; Burgos P; Cao Q; Clark IP; Codd P; Farrow R; George MW; Kogimtzis M; Matousek P; Parker AW; Pollard M; Robinson D; Xin Z-J; Towrie M, ULTRA - A Unique Instrument for Time-resolved Spectroscopy. Applied Spectroscopy 2010, 64, 1311–1319. [DOI] [PubMed] [Google Scholar]
- 52.Ufimtsev IS; Martínez TJ, Quantum Chemistry on Graphical Processing Units. 3. Analytical Energy Gradients and First Principles Molecular Dynamics. J. Chem. Theor. Comp 2009, 5, 2619–2628. [DOI] [PubMed] [Google Scholar]
- 53.Titov AV; Ufimtsev IS; Luehr N; Martínez TJ, Generating Efficient Quantum Chemistry Codes for Novel Architectures. J. Chem. Theor. Comp 2013, 9, 213–221. [DOI] [PubMed] [Google Scholar]
- 54.Case DA; Babin V; Berryman JT; Betz RM; Cai Q; Cerutti DS; T.E. Cheatham I; Darden TA; Duke RE; Gohlke H; Goetz AW; Gusarov S; Homeyer N; Janowski P; Kaus J; Kolossváry I; Kovalenko A; Lee TS; LeGrand S; Luchko T; Luo R; Madej B; Merz KM; Paesani F; Roe DR; Roitberg A; Sagui C; Salomon-Ferrer R; Seabra G; Simmerling CL; Smith W; Swails J; Walker RC; Wang J; Wolf RM; Wu X; Kollman PA AMBR 14, University of Caifornia, San Franciso, 2014. [Google Scholar]
- 55.Frisch MJ; Trucks GW; Schlegel HB; Scuseria GE; Robb MA; Cheeseman JR; Scalmani G; Barone V; Petersson GA; Nakatsuji H; Li X; Caricato M; Marenich AV; Bloino J; Janesko BG; Gomperts R; Mennucci B; Hratchian HP; Ortiz JV; Izmaylov AF; Sonnenberg JL; Williams-Young D; Ding F; Lipparini F; Egidi F; Goings J; Peng B; Petrone A; Henderson T; Ranasinghe D; Zakrzewski VG; Gao J; Rega N; Zheng G; Liang W; Hada M; Ehara M; Toyota K; Fukuda R; Hasegawa J; Ishida M; Nakajima T; Honda Y; Kitao O; Nakai H; Vreven T; Throssell K; J. A. Montgomery J; Peralta JE; Ogliaro F; Bearpark MJ; Heyd JJ; Brothers EN; Kudin KN; Staroverov VN; Keith TA; Kobayashi R; Normand J; Raghavachari K; Rendell AP; Burant JC; Iyengar SS; Tomasi J; Cossi M; Millam JM; Klene M; Adamo C; Cammi R; Ochterski JW; Martin RL; Morokuma K; Farkas O; Foresman JB; Fox DJ Gaussian16, Revision A.03, Gaussian, Inc.: Wallingford, CT, 2016. [Google Scholar]
- 56.Hay PJ; Wadt WR, Ab initio effective core potentials for molecular calculations – potentials for K to Au including the outermost core orbitals. J. Chem. Phys, 1985, 82, 299–310. [Google Scholar]
- 57.Hehre WJ; Ditchfield R; Pople JA, Self—Consistent Molecular Orbital Methods. XII. Further Extensions of Gaussian—Type Basis Sets for Use in Molecular Orbital Studies of Organic Molecules. J. Chem. Phys 1972, 56, 2257–2261. [Google Scholar]
- 58.Adamo C; Barone V, Toward reliable density functional methods without adjustable parameters: The PBE0 model. J. Chem. Phys 1999, 110, 6158–6170. [Google Scholar]
- 59.Adamo C; Scuseria GE; Barone V, Accurate excitation energies from time-dependent density functionl theory: Assessing the PBE0 model. J. Chem. Phys 1999, 111, 2889–2899. [Google Scholar]
- 60.Grimme S; Antony J; Ehrlich S; Krieg H, A consistent and accurate ab initio parametrization of density functional dispersion correction (DFT-D) for the 94 elements H-Pu. J. Chem. Phys 2010, 132, 154104. [DOI] [PubMed] [Google Scholar]
- 61.Berendsen HJC; Grigera JR; Straatsma TP, The Missing Term in Effective Pair Potentials. J. Phys. Chem 1987, 91, 6269–6271. [Google Scholar]
- 62.Heyda J; Pokorna J; Vrbka L; Vacha R; Jagoda-Cwiklik B; Konvalinka J; Jungwirth P; Vondrasek J, Ion Specific Effects of Sodium and Potassium on the Catalytic Activity of HIV-1 Protease. Phys. Chem. Chem. Phys 2009, 11, 7599–7604. [DOI] [PubMed] [Google Scholar]
- 63.Cossi M; Barone V; Cammi R; Tomasi J, Ab initio study of solvated molecules: A new implementation of the polarizable continuum model. Chem. Phys. Lett 1996, 255, 327–335. [Google Scholar]
Associated Data
This section collects any data citations, data availability statements, or supplementary materials included in this article.


