

Abstract
Common genetic factors may contribute to the high co-morbidity between tobacco smoking and alcohol use disorder. Here, we assessed behavioral and biological effects of nicotine in replicate mouse lines selectively-bred for high (HAP2/3) or low alcohol preference (LAP2/3). In Experiment 1, free-choice oral nicotine and quinine intake were assessed in HAP2/3 and LAP2/3 mice. Effects of nicotinic acetylcholine receptor blockade by mecamylamine on nicotine intake in HAP2 mice were also examined. In Experiment 2, HAP2/3 and LAP2/3 mice were tested for differences in sensitivity to nicotine-induced taste conditioning. In Experiment 3, the effects of a single nicotine injection on nucleus accumbens and dorsal striatum monoamine levels in HAP2/3 and LAP2/3 mice were tested. In Experiment 1, HAP2/3 mice showed greater nicotine intake and intake ratio than LAP2/3 mice. There were no line differences in quinine intake. Mecamylamine reduced nicotine intake and intake ratio in HAP2 mice. In Experiment 2, HAP2/3 mice showed weaker nicotine-induced conditioned taste aversion compared to LAP2/3 mice. In Experiment 3, nicotine treatment increased nucleus accumbens dopamine turnover across both HAP2/3 and LAP2/3 mouse lines. These results show that there is a positive genetic correlation between oral alcohol intake (high alcohol intake/preference selection phenotype) and oral nicotine intake and a negative genetic correlation between oral alcohol intake and sensitivity to nicotine-induced conditioned taste aversion.
Keywords: Alcohol, conditioned taste aversion, dorsal striatum, free-choice, oral intake, high performance liquid chromatography, neurochemistry, nicotine, nicotinic acetylcholine receptors, nucleus accumbens, selectively-bred mice
INTRODUCTION
Excessive alcohol intake and tobacco smoking are among the top risk factors for preventable deaths (Lim et al. 2012) and cause an estimated 10 million deaths globally (World Health Organization, 2017). It is estimated that 80–90% of alcoholics are tobacco smokers. Conversely, smokers are 10–14 times more likely to have an alcohol use disorder compared to non-smokers (Falk, Yi, & Hiller-Sturmhöfel, 2006; McKee & Weinberger, 2013; Miller & Gold, 1998). In humans, studies show that genetic factors predispose individuals to heavier alcohol and tobacco use (Swan et al. 1997).
Genetic animal models have significantly advanced the understanding of how genetic factors predispose humans toward drug use and addiction. Several studies using selectively-bred rodents to explore common genetic influences on behavior have demonstrated some overlap in genes that regulate behavioral sensitivity to both alcohol and nicotine. For example, mice selectively-bred for greater sensitivity to the hypnotic effects of alcohol [long-sleep (LS) mouse line] demonstrate greater locomotor suppression following nicotine challenge compared to the short-sleep (SS) mouse lines (De Fiebre et al. 1987). Similarly, rats selectively-bred for longer sleep time after alcohol [high alcohol sensitivity (HAS1 and HAS2) lines] show greater suppression of locomotor activity after nicotine compared to low alcohol sensitivity (LAS1 and LAS2) rat lines (de Fiebre et al. 2002).
Operant self-administration and free-choice oral (FC) intake procedures in rodents are frequently used to measure sensitivity to reinforcing effects of both alcohol and nicotine. In one study, selectively-bred alcohol preferring (P) rats self-administered more nicotine compared to alcohol non-preferring (NP) rats in an operant self-administration task (Lê et al. 2006). Results from another study using a mouse genetic model indicated alcohol and nicotine FC intake were positively correlated in F2 mice from a C57BL/6J x C3H/HeJ intercross (Li, Karadsheh, Jenkins, & Stitzel, 2005). These results suggest that common genes contribute to higher intake of both alcohol and nicotine. However, interpreting intake behaviors can be ambiguous because both positive (rewarding) and negative (aversive) motivational effects of drugs may influence intake behaviors.
The main goal of this study was to assess the genetic correlations between propensity toward oral alcohol intake/preference and nicotine-induced reinforcement-related behaviors assessed by FC intake and conditioned taste aversion (CTA). CTA is often used in combination with oral intake procedures to better understand how sensitivity to aversive effects of drugs is related to drug reinforcement behaviors (Cunningham et al. 2000). In the case of alcohol, results from multiple genetic animal models, including selectively bred mouse lines (Chester et al. 2003) and a panel of 15 inbred mouse strains (Broadbent et al. 2002; Cunningham 2014) indicate that higher FC alcohol intake is correlated with weaker alcohol-induced CTA. For nicotine, the genetic relationship between voluntary oral intake and CTA is less clear. Comparisons of higher nicotine-consuming C57BL/6J (B6) mice and lower nicotine-consuming DBA/2J (D2) mice (Robinson et al. 1996) showed that B6 mice are less sensitive to nicotine-induced CTA (Risinger & Brown 1996) than D2 mice. However, these studies compared only 2 inbred strains of mice and therefore provide limited evidence that the correlations are due to common genetic influence because random fixation of alleles can occur in inbred mouse strains. Comparisons between only 2 inbred strains does not provide enough statistical power to detect a true genetic correlation (Crabbe et al. 1990).
Replicate lines (2 and 3) of mice were selectively-bred for high (HAP2/3) or low alcohol preference (LAP2/3) using a continuous access FC 10% alcohol intake procedure from a HS/IBG background (Grahame et al. 1999; Oberlin et al. 2010). Assessing correlated phenotypes should be done using replicated selected lines to provide strong evidence that true genetic correlations exist between phenotypes that are not otherwise due to genetic drift (Crabbe et al. 1990). An inverse genetic relationship between the propensity for FC alcohol intake and alcohol-induced CTA has been demonstrated in these mouse lines (Chester et al. 2003). HAP and LAP lines have also been used to demonstrate genetic correlations between the propensity for FC alcohol intake and several other phenotypes (Barrenha & Chester 2007; Chester & Barrenha 2007; Oberlin & Grahame 2009).
Since nicotine solution is a bitter-tasting substance, we also assessed potential line differences in intake of another bitter-tasting substance, quinine. In addition, the effects of the nicotinic acetylcholine receptor (nAChR) antagonist, mecamylamine, was tested on nicotine intake in HAP2 mice to explore if this behavior is regulated by nAChRs. Finally, we measured the effects of nicotine challenge on nucleus accumbens (NAc) and dorsal striatum (STR) contents of norepinephrine (NE), dopamine (DA) and DA metabolites 3,4-dihydroxyphenylacetic acid (DOPAC) and homovanillic acid (HVA), serotonin (5-HT), and the 5-HT metabolite 5-hydroxyindoleacetic acid (5-HIAA) in HAP2/3 and LAP2/3 mice.
MATERIALS AND METHODS
Subjects
Experimentally-naïve HAP and LAP mice from both sexes and both replicate selection lines 2 and 3 were used in all experiments, unless noted otherwise. HAP2/LAP2 mice were from generations 47, 50 and 52 and HAP3/LAP3 mice were from generation 27. Mice were generated and tested at Purdue University (West Lafayette, IN) using breeders obtained from the Indianapolis Alcohol Research Center (Indianapolis, IN). All mice were weaned between postnatal days (PND) 21–23 and housed in polycarbonate cages (11.5 × 7.5 × 5 in) with littermates in groups of 2–4. In experiments that involved measurement of oral intake of fluids, mice were singly-housed before the start of the experiment (see below). Ages of mice (PND) at the start of experimental procedures are reported below. Number and sexes of mice are reported in the figure legends. All mice were housed in a standard 12:12 light-dark cycle (lights on at 7:00 AM, off at 7:00 PM), except in Experiment 1.3 (see below), and had free access to food and water unless noted otherwise. All procedures were approved by the Purdue University Institutional Animal Care and Use Committee.
Drugs
(-)-Nicotine base was purchased from Acros Organics (Geel, Belgium). Mecamylamine hydrochloride and quinine hydrochloride dihydrate were purchased from Sigma Aldrich (St. Louis, MO). All injections were given intraperitoneally at a volume of 10 mL/kg in saline and nicotine doses are reported as free base.
Experiment 1.1: FC Nicotine Intake in HAP2/3 and LAP2/3 Mice
Male and female mice were singly-housed at PND 82–123 for 7 days before the start of experimental procedures. At the start of the experiment, the regular water bottle in each cage was replaced by one bottle of water and one bottle of nicotine solution, which were available continuously throughout the experiment. These bottles were made from 25-mL graduated cylinders fitted with stainless steel sipper tubes, which provide a reading accuracy of 0.5 mL. Nicotine was diluted in water to desired concentrations. Nicotine concentration started at 10 µg/mL and was increased every 4 days: 10 µg/mL (days 1–4), 50 µg/mL (days 5–8), 100 µg/mL (days 9–12), 150 µg/mL (days 13–16), and 200 µg/mL (days 17–20). Nicotine and water volumes were recorded every 24 hours with bottles on the cage to avoid spillage. Mice were weighed, bottle positions were swapped, and fluids were replaced every 48 hours. Nicotine intake was expressed as milligrams of nicotine consumed per kilogram of body weight (mg/kg). Nicotine intake ratio was calculated as volume of nicotine intake/total fluid intake. Total fluid intake was the total volume of nicotine solution and water consumed (mL/kg). These procedures were adapted from those previously used to assess mouse strain differences in FC nicotine intake (Robinson et al. 1996).
Experiment 1.2: FC Quinine Intake in HAP2/3 and LAP2/3 Mice
The procedures for this experiment were similar to those in Experiment 1.1, except that quinine and water volumes were recorded every 48 hours instead of every 24 hours to match the procedure used previously to assess quinine intake in HAP1 and LAP1 mice (Grahame et al. 1999). Male and female mice were singly-housed at PND 156–204 for 7 days before the start of experimental procedures. Quinine was dissolved in water and administered in increasing concentrations: 0.010 % (days 1–4), 0.032 % (days 5–8), and 0.100 % (days 9–12). Quinine intake (mL/kg), intake ratio, water intake, and total fluid intake were analyzed.
Experiment 1.3: Effects of Mecamylamine on FC Nicotine Oral in HAP2 and LAP2 Mice
Please refer to Fig. 3A for a timeline schematic of this experiment. Male mice were singly-housed at PND 116–147 for 7 days before the start of experimental procedures. Only male mice were used in this experiment due to a lack of female mice in our animal colony at the time of the experiment. This experiment was conducted in reversed 12:12 light-dark cycle to facilitate hourly intake readings in the dark phase. After habituation, regular water bottles were replaced with one bottle of water and one bottle of 10 µg/mL nicotine solution using the 25-mL bottles described above. These nicotine and water bottles were available continuously throughout the experiment. After 4 days, nicotine concentration was increased from 10 to 50 µg/mL and maintained throughout the experiment. Six days later, 25-mL bottles were replaced with 10-mL bottles, and hourly readings of nicotine intake were performed in the dark phase of the light-dark cycle to characterize the nicotine intake pattern of HAP2 and LAP2 mice. Nicotine intake in the light phase was negligible. The 10-mL drinking bottles used in this study were made from 10-mL serological pipettes fitted with stainless steel sipper tubes and provide an accuracy of 0.1 mL.
Figure 3.
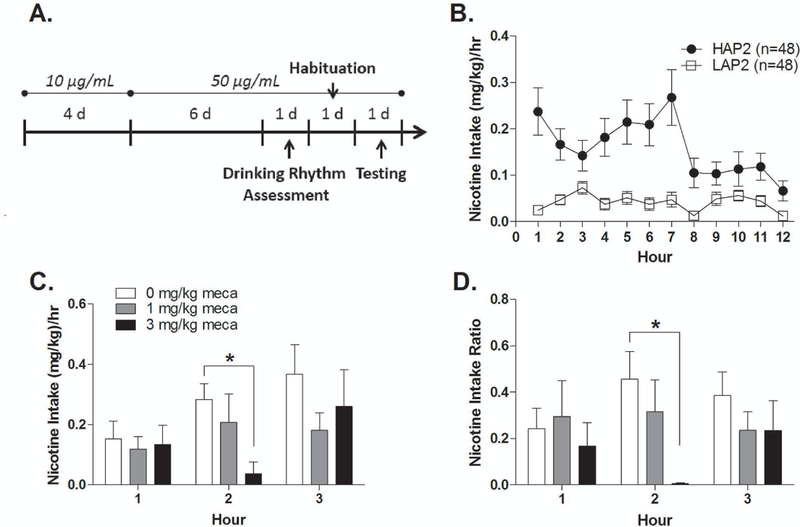
Effects of mecamylamine on nicotine intake. (A) Timeline schematic. (B) HAP2 and LAP2 hourly nicotine intake in the dark phase. (C) Nicotine intake and (D) intake ratio in HAP2 mice following mecamylamine or saline injections (n = 8–11 per group; all males). *p < 0.05.
On the day after nicotine intake pattern assessment, mice were given habituation (saline) injections at the selected time point for mecamylamine injections (4h into the dark cycle; see Results) and intake volumes were recorded at hours 1, 2, and 3 post-injection. Mice were counterbalanced into treatment groups (0.0, 1.0, or 3.0 mg/kg nicotine) based on their average nicotine intake over 3 hrs post-saline injection (Kasten et al. 2015). Mice that did not show any fluid intake (nicotine or water) over 3 hrs post-injection were considered “non-responders” and were removed from the experiment. This procedure was based on findings from a pilot study indicating “non-responder” status following habituation injections predicted little to no nicotine solution or water intake after injections (mecamylamine or saline) on testing day. After habituation, 17 out of 48 HAP2 and 44 out of 48 LAP2 mice were non-responders. Due to the overwhelming number of non-responding LAP2 mice, only HAP2 mice were tested in the subsequent phase of this experiment.
On the day after habituation injections, mice were given mecamylamine (0.0, 1.0 or 3.0 mg/kg) injections 4 hrs into the dark cycle and intake volumes were recorded at hours 1, 2, and 3 post-injection. Nicotine intake and intake ratio, water intake, and total fluid intake were analyzed as described above. The mecamylamine doses in this experiment were selected from doses that were previously shown to reduce nicotine intravenous self-administration in male rats (Watkins et al. 1999).
Experiment 2: Nicotine Taste Conditioning in HAP2/3 and LAP2/3 Mice
Male and female mice were singly-housed at PND 152–227 and adapted to a 2 hr/day water restriction schedule for 7 days before the start of the experiment. Mice had free-access to food pellets, but only received water for 2 hrs (hours 3–5 into the light phase) every day for 7 days. After this habituation period, mice were given access to 0.20 M sodium chloride (NaCl) for 1 hr (3–4 hrs into the light phase) every other day instead of water. Immediately after the first 5 NaCl sessions, mice were given injections of nicotine (0.5 or 2.0 mg/kg) or saline. Five hours after the end of NaCl access, mice were given access to water for 30 min to prevent dehydration. On the intervening, non-conditioning days, mice received their regular 2-hr access to water. NaCl intake in each session was converted to milliliters of NaCl consumed per kilogram of body weight (mL/kg). These procedures are similar to and these nicotine doses overlap with those used in a previous nicotine CTA study in mice (Risinger & Brown 1996).
Experiment 3: Effects of Nicotine on Striatal Monoamine Levels in HAP2/3 and LAP2/3 Mice
Male and female mice received habituation (saline) injections one day before nicotine injections. Nicotine (0.0, 0.5, and 1.0 mg/kg) was injected 10 min before mice were cervically-dislocated and decapitated. This sacrifice time point was selected based on previous mouse studies on nicotine pharmacokinetics and nicotine’s effects on striatum neurotransmitter levels (Mansner & Mattila 1977; Freeman et al. 1987; Besson et al. 2012). Nicotine doses were also selected based on these studies. In addition, these nicotine doses overlap with those used in our CTA (Experiment 2.1) and CPP (Experiment 2.2) studies. Brains were harvested immediately following cervical dislocation and chilled in ice-cold saline for 3m. Subsequently, brains were dissected on a cold stage and bilateral NAc and STR tissue samples were collected and flash-frozen in liquid nitrogen. Tissue samples were stored at −80°C until processing for neurochemical analysis. The methods for tissue processing and neurochemical analysis via high performance liquid chromatography with electrochemical detection were previously described (Wang et al., 2014). Levels of DA, the DA metabolites 3,4-dihydroxyphenylacetic acid (DOPAC) and homovanillic acid (HVA), 5-HT, the 5-HT metabolite 5-hydroxyindoleacetic acid (5-HIAA), and NE in NAc and STR tissue samples were quantified using a standard curve generated from high-purity standards and expressed as ng of analyte per mg of protein. DA turnover was calculated as (DOPAC + HVA contents)/DA content. 5-HT turnover was calculated as 5-HIAA content/5-HT content.
Statistical Analysis
All data were analyzed using factorial analysis of variance (ANOVA) in the Statistical Package for Social Sciences software (IBM Corporation, Armonk, NY). Between-subjects factors include line, sex, and treatment group, and within-subjects factors include nicotine concentration and day, where appropriate. Omnibus ANOVAs with significant interactions were followed-up by lower order ANOVAs and Tukey’s posthoc analyses. In some cases, only the highest order interactions were reported from the omnibus ANOVAs to simplify presentation of the results. The significance level was set at p < 0.05. All data are shown as mean ± SEM. Data containing both male and female subjects are presented collapsed by sex unless otherwise indicated
RESULTS
Experiment 1.1: Nicotine Free-Choice Oral Intake in HAP2/3 and LAP2/3 Mice
HAP2 and LAP2 mice.
ANOVA of line (2) x sex (2) x nicotine concentration (5) on nicotine intake yielded a significant main effect of line [F(1,44) = 34.5; p < 0.001], indicating that HAP2 mice consumed more nicotine solution than LAP2 mice across all nicotine concentrations (Fig. 1A). The same analysis for nicotine intake ratio yielded a significant main effect of line [F(1,44) = 13.2; p = 0.001] and a significant line x nicotine concentration interaction [F(4,176) = 3.7; p < 0.01], due to greater nicotine intake ratios in HAP2 than LAP2 mice at nicotine concentrations of 10 (p < 0.01), 50 (p < 0.005), and 200 µg/mL (p < 0.05) (Fig. 1B). HAP2 mice also showed significantly greater water and total fluid intake than LAP2 mice across all drinking days. Mean water intakes were 156.7 ± 7.1 (HAP2) and 117.9 ± 5.2 mL/kg/24 hrs (LAP2) [F(1,42) = 35.4, p < 0.001], and mean total fluid intakes were 206.3 ± 8.5 (HAP2) and 140.1 ± 5.9 mL/kg/24 hrs (LAP2) [F(1,42) = 80.3, p < 0.001].
Figure 1.
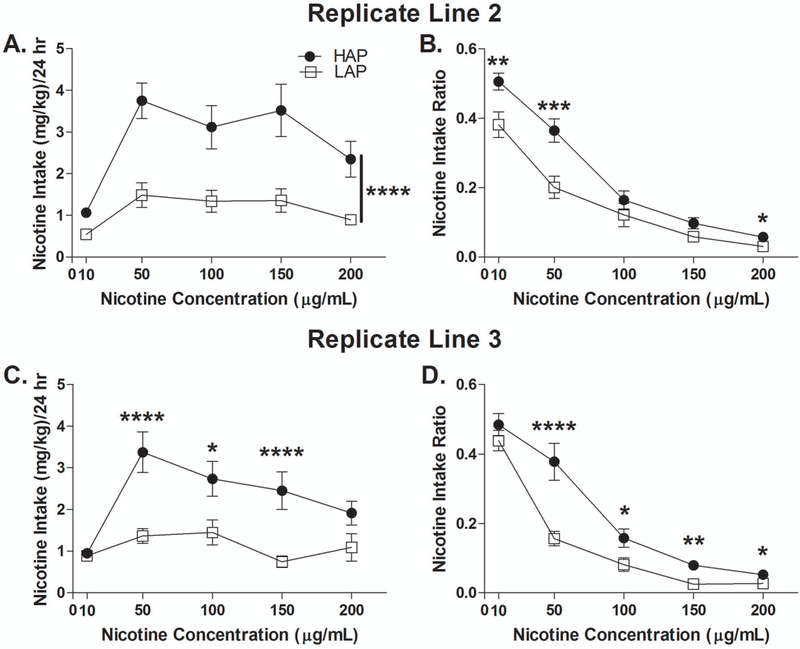
Nicotine oral intake in HAP2/3 and LAP2/3 mice. (A) Nicotine intake and (B) intake ratio in HAP2 and LAP2 mice. N = 23 (12 males, 11 females) per line. (C) Nicotine intake and (D) intake ratio in HAP3 and LAP3 mice. HAP3: n = 24 (12 males, 12 females). LAP3: n = 23 (11 males, 12 females). *p < 0.05; ** p < 0.01; ***p < 0.005; ****p < 0.001. Data shown collapsed by sex.
HAP3 and LAP3 mice.
ANOVAs of line (2) x sex (2) x nicotine concentration (5) on nicotine intake and intake ratio yielded significant main effects of line [F(1,45) = 18.2 and 13.0, respectively, p’s ≤ 0.001] and significant line x nicotine concentration interactions [F(4,180) = 3.9 and 6.2, p’s < 0.005 and 0.001, respectively]. Follow-up analyses indicated that HAP3 mice consumed more nicotine solution than LAP3 mice at 50 (p < 0.001), 100 (p < 0.05), and 150 µg/mL (p = 0.001) (Fig. 1C) and HAP3 mice showed significantly greater nicotine intake ratios than LAP3 mice at 50 (p < 0.001), 100 (p < 0.05), 150 (p = 0.01), and 200 µg/mL (p < 0.05; Fig. 1D). There were no significant differences in water or total fluid intake between HAP3 and LAP3 mice across all drinking days. Mean water intakes were 146.4 ± 5.2 (HAP3) and 157.3 ± 9.3 mL/kg/24 hrs (LAP3) and mean total fluid intakes were 189.4 ± 5.1 (HAP3) and 193.6 ± 7.5 mL/kg/24 hrs (LAP3).
Experiment 1.2: Quinine Intake in HAP2/3 and LAP2/3 Mice
HAP2 and LAP2 mice.
ANOVAs of line (2) x sex (2) x quinine concentration (3) on quinine intake and intake ratio did not yield any significant main or interactive effects (Fig. 2A, B). HAP2 showed significantly greater water and total fluid intake than LAP2 mice across all drinking days. Mean water intake were 272.2 ± 15.4 (HAP2) and 207.5 ± 13.8 mL/kg/48 hrs (LAP2) [F(1,20) = 32.4, p < 0.001], and mean total fluid intakes were 349.1 ± 15.8 (HAP2) and 274.6 ± 14.3 mL/kg/48 hrs (LAP2) [F(1,20) = 37.8, p < 0.001].
Figure 2.
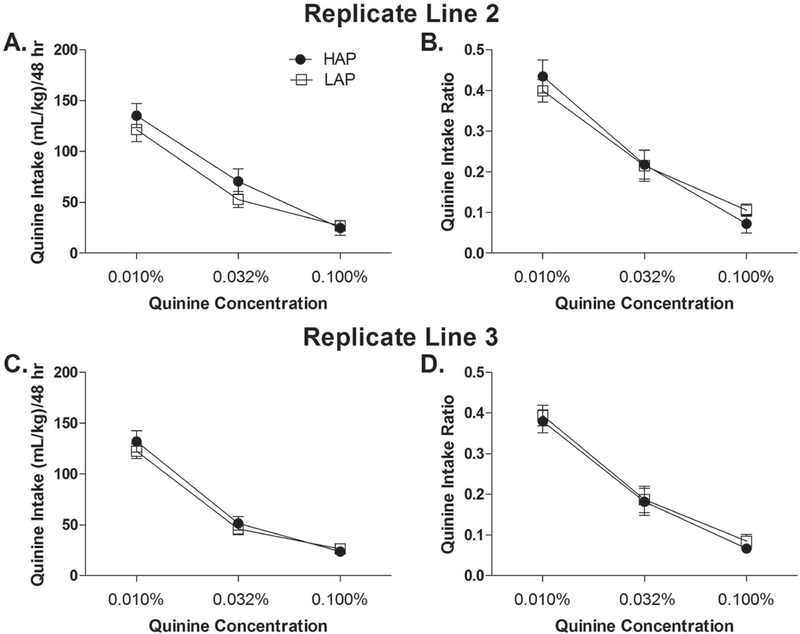
Quinine oral intake in HAP2/3 and LAP2/3 mice. (A) Quinine intake and (B) intake ratio in HAP2 and LAP2 mice. N = 12 (6 males, 6 females) per line. (C) Quinine intake and (D) intake ratio in HAP3 and LAP3 mice. HAP3: n = 11 (5 males, 6 females). LAP3: n = 12 (6 males, 6 females). Data shown collapsed by sex.
HAP3 and LAP3 mice.
ANOVAs of line (2) x sex (2) x quinine concentration (3) on quinine intake and intake ratio did not yield any significant main or interactive effects, indicating that there were no significant differences in quinine intake or intake ratio between HAP3 and LAP3 mice (Fig. 2C, D). There were also no significant differences in water or total fluid intake between HAP3 and LAP3 mice. Mean water intakes were 266.2 ± 15.7 (HAP3) and 241.0 ± 18.0 mL/kg/48 hrs (LAP3) and mean total fluid intakes were 335.4 ± 15.4 (HAP3) and 306.0 ± 17.4 mL/kg/48 hrs (LAP3).
Experiment 1.3: Effects of Mecamylamine on Nicotine Intake in HAP2 Mice
Nicotine intake pattern.
Twelve hourly fluid readings were conducted in the dark phase to assess the pattern of nicotine intake of HAP2 and LAP2 mice. An ANOVA of line (2) x hour (12) on nicotine intake yielded significant main effects of line [F(1,94) = 19.3, p < 0.001] and hour [F(11,1034) = 4.3, p < 0.001] and a significant line x hour interaction [F(11,1034) = 3.6, p < 0.001]. Within each line, there was a significant main effect of hour [HAP2: F(11,517) = 4.1, p < 0.001; LAP2: F(11,517) = 2.5, p = 0.005], indicating nicotine intake varied across the 12 hours in both HAP2 and LAP2 mice (Fig. 3B).
Testing.
Only HAP2 mice were tested in this phase of the experiment due to injection-induced suppression of fluid intake in LAP2 mice (see Methods). ANOVAs of treatment (3) x hour (3) on nicotine intake and intake ratio yielded a significant main effect of hour [F(2,52) = 5.7, p < 0.01] for nicotine intake and a significant treatment x hour interaction for both nicotine intake and intake ratio [F(4,52) = 2.6 and 3.5, respectively, p’s < 0.05]. Analysis of treatment within each hour yielded a significant main effect of treatment for both nicotine intake and intake ratio [F(2, 26) = 5.4 and 4.5, respectively, p’s < 0.05] in hour 2 only. Tukey’s posthoc analysis showed that HAP2 mice that received 3 mg/kg mecamylamine showed significantly lower nicotine intake and intake ratio compared to HAP2 mice that received saline treatment (ps < 0.05; Fig. 3C, D).
ANOVA of treatment (3) x hour (3) on water intake indicated a main effect of hour only [F(2,52) = 7.9, p = 0.001].
Experiment 2: Nicotine Taste Conditioning in HAP2/3 and LAP2/3 Mice
HAP2 and LAP2 mice.
For this study, we did not have LAP2 males. ANOVA [line (2) x treatment (3)] of day 1 NaCl intake (prior to the first injection of nicotine) yielded no main effects or interactions. However, because line differences in intake on day 1 were seen in replicate 3 mice (see next section) we analyzed NaCl intake as a percent reduction from baseline (trial 1 NaCl intake – mean of trial 2–6 NaCl intake)/trial 1 NaCl intake x 100%.
ANOVA of line (2) x treatment (3) on mean percent reduction of NaCl intake across trials 2–6 yielded a significant line x treatment interaction [F(2,47) = 5.2, p < 0.01]. Follow-up analyses of line within each treatment showed a line difference in the 0.5 mg/kg dose group [F(1,16) = 19.0, p < 0.001; LAP2 > HAP2] but not in the saline or 2.0 mg/kg nicotine group. (Fig. 4A-C).
Figure 4.
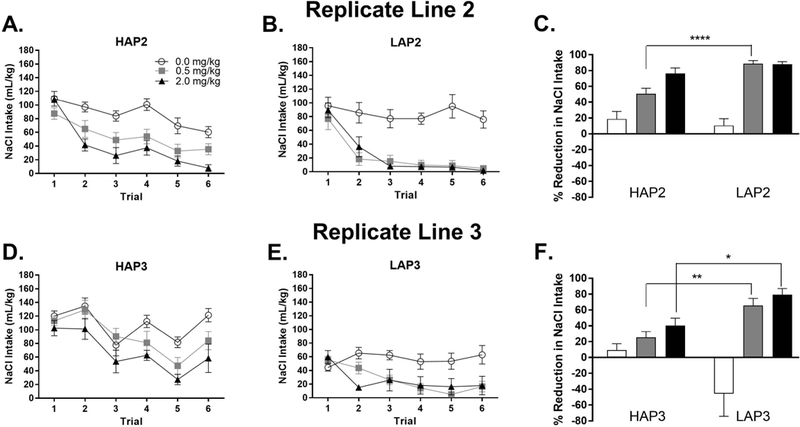
Nicotine taste conditioning in HAP2/3 and LAP2/3 mice. (A, B) NaCl intake by conditioning trial and (C) percent reduction in NaCl intake from trial 1 to trials 2–6 in HAP2 and LAP2 mice. HAP2: n = 9 (5 males, 4 females; 0.0 mg/kg nicotine) or 10 (5 males, 5 females; 0.5 and 2.0 mg/kg nicotine). LAP2: n = 8 females) per treatment group. (D, E) NaCl intake by conditioning trial and (F) percent reduction in NaCl intake from trial 1 to trials 2–6 (average intake) in HAP3 and LAP3 mice. HAP3: n = 8 (4 males, 4 females; 0.5 and 2.0 mg/kg nicotine) or 9 (4 males, 5 females; 0.0 mg/kg nicotine). LAP3: n = 9 (5 males, 4 females; 0.5 mg/kg nicotine) or 10 (5 males, 5 females; 0.0 and 2.0 mg/kg nicotine). In (C) and (F), note that an upward bar shows reduced, whereas a downward bar shows increased NaCl intake across trials 2–6 compared to trial 1. *p < 0.05; ** p < 0.01; ****p < 0.001. Data shown collapsed by sex.
HAP3 and LAP3 mice.
ANOVA (line x sex x treatment) of day 1 NaCl intake (prior to the first injection of nicotine) yielded line x treatment [F(2,43) = 4.1, p < 0.05] and sex x treatment [F(2,43) = 6.5, p < 0.01] interactions. Follow up of the line x treatment interaction showed greater NaCl intake in HAP3 than LAP3 mice in each treatment group (Fs > 8.5, ps < 0.01) but there were no treatment group effects within either line. The sex x treatment interaction was due to a sex effect in the 2.0 mg/kg group [F(1,17) = 12.2, p < 0.01; females > males].
ANOVA of line x sex x treatment on mean percent reduction of NaCl intake across trials 2–6 yielded a significant 3-way interaction [F(2,43) = 4.3, p < 0.05]. Follow-up analyses of line x sex within each treatment [F(2,43) = 4.3, p < 0.05] showed a line x sex interaction in the saline group [F(1,15) = 6.8, p < 0.05] due to an increase in NaCl intake across trials in female LAP3 compared to female HAP3 mice [F(1,5) = 7.8, p < 0.05]. The ANOVAs also showed main effects of line in the 0.5 mg/kg [F(1,13) = 10.5, p < 0.01] and 2.0 mg/kg [F(1,15) = 7.1, p < 0.05] groups (LAP3 > HAP3) (Fig. 4D-F).
Experiment 3: Effects of Nicotine on Striatal Neurotransmitter Levels in HAP2/3 and LAP2/3 Mice
HAP2 and LAP2 mice.
NAc.
ANOVAs of line (2) x sex (2) x treatment (3) on NAc DA, and the DA metabolites DOPAC and HVA showed that HAP2 mice had significantly higher HVA content than LAP2 mice across all treatment groups [significant main effect of line, F(1,11) = 6.1, p < 0.05]. DA and DOPAC contents were marginally higher in HAP2 than LAP2 mice (main effects of line, ps = 0.08 and 0.06, respectively). Nicotine treatment had a significant effect on HVA [F(2,11) = 5.4, p < 0.05], but not on DA and DOPAC content, in both lines. Tukey’s posthoc analysis on HVA content collapsed across lines showed that 1.0 mg/kg nicotine significantly increased NAc HVA content compared to saline controls (p < 0.05; Table 1). For DA turnover (see Methods), an ANOVA of line (2) x sex (2) x treatment (3) yielded a significant main effect of treatment [F(2,11) = 12.4, p < 0.005] and a significant sex x treatment interaction [F(2,11) = 4.8, p < 0.05]. A follow-up analysis of treatment within each sex showed that treatment had a significant effect in male mice only [F(2,11) = 21.9, p = 0.001]. Tukey’s posthoc showed that both 0.5 (0.22 ± 0.01; p < 0.005) and 1.0 mg/kg nicotine (0.25 ± 0.01; p = 0.001) significantly increased DA turnover compared to saline controls (0.16 ± 0.01) in male mice.
Table 1.
Neurotransmitter content in HAP2 and LAP2 mice.
| Brain Area |
Line | Treatment (mg/kg nicotine) |
DA | DOPAC | HVA | DA Turnover |
5-HT | 5-HIAA | 5-HT Turnover |
NE |
|---|---|---|---|---|---|---|---|---|---|---|
| NAc | ||||||||||
| HAP2 | 0.0 | 104.2 ± 18.4 | 9.6 ± 1.3 | 7.7 ± 0.7 | 0.17 ± 0.02 | 9.2 ± 0.7 | 1.3 ± 0.1 | 0.14 ± 0.01 | 3.8 ± 1.2 | |
| 0.5 | 95.4 ± 5.1 | 12.1 ± 0.8 | 9.2 ± 0.3 | 0.22 ± 0.01 | 8.4 ± 1.1 | 1.2 ± 0.1 | 0.15 ± 0.02 | 3.7 ± 0.7 | ||
| 1.0 | 90.0 ± 6.3 | 11.7 ± 1.1 | 10.5 ± 0.1* | 0.25 ± 0.01 | 7.2 ± 0.8 | 1.3 ± 0.2 | 0.18 ± 0.03 | 2.6 ± 0.8 | ||
| LAP2 | 0.0 | 75.2 ± 9.3 | 8.2 ± 0.3 | 7.0 ± 0.2 | 0.21 ± 0.02 | 6.6 ± 0.7 | 1.2 ± 0.1 | 0.18 ± 0.02 | 3.5 ± 0.9 | |
| 0.5 | 71.7 ± 4.6 | 9.5 ± 0.9 | 7.4 ± 0.4 | 0.24 ± 0.01 | 8.3 ± 1.1 | 1.3 ± 0.1 | 0.16 ± 0.01 | 3.7 ± 0.4 | ||
| 1.0 | 72.6 ± 5.5 | 9.4 ± 1.3 | 8.2 ± 0.8* | 0.24 ± 0.02 | 6.6 ± 0.2 | 1.2 ± 0.1 | 0.17 ± 0.02 | 3.1 ± 0.4 | ||
| STR | ||||||||||
| HAP2 | 0.0 | 109.7 ± 9.7 | 6.9 ± 0.6 | 8.1 ± 0.5 | 0.14 ± 0.01 | 4.7 ± 0.3 | 0.8 ± 0.1 | 0.17 ± 0.01 | 2.4 ± 0.5 | |
| 0.5 | 140.2 ± 8.1 | 9.3 ± 0.5 | 10.5 ± 0.5 | 0.14 ± 0.01 | 4.4 ± 0.4 | 0.9 ± 0.1 | 0.21 ± 0.01 | 2.2 ± 0.2 | ||
| 1.0 | 118.5 ± 32.4 | 8.1 ± 1.4 | 10.6 ± 2.2 | 0.17 ± 0.02 | 3.9 ± 0.4 | 0.9 ± 0.1 | 0.23 ± 0.02 | 1.9 ± 0.5 | ||
| LAP2 | 0.0 | 90.3 ± 6.3 | 6.0 ± 0.2 | 7.9 ± 0.5 | 0.16 ± 0.01 | 4.0 ± 0.4 | 0.9 ± 0.1 | 0.22 ± 0.01 | 2.6 ± 0.3 | |
| 0.5 | 82.2 ± 9.9 | 5.9 ± 0.8 | 7.2 ± 0.7 | 0.16 ± 0.01 | 3.5 ± 0.4 | 0.8 ± 0.1 | 0.22 ± 0.02 | 1.7 ± 0.1 | ||
| 1.0 | 96.3 ± 11.0 | 7.1 ± 1.3 | 9.0 ± 1.1 | 0.17 ± 0.01 | 3.5 ± 0.2 | 0.8 ± 0.1 | 0.23 ± 0.01 | 2.2 ± 0.1 |
p < 0.05 when data are collapsed across HAP2 and LAP2 lines.
An ANOVA of line (2) x sex (2) x treatment (3) on NAc 5-HT content yielded a significant line x sex interaction [F(1,11) = 6.7, p < 0.05]. Collapsed across treatment groups, analyses of line within each sex showed that, in male mice, NAc 5-HT content was significantly higher in HAP2 (9.16 ± 0.47 ng/mg) than in LAP2 mice (6.90 ± 0.67 ng/mg) [F(1,11) = 6.7, p < 0.05]. Analyses of sex within each line showed that, in the HAP2 line, male mice had higher NAc 5-HT content (9.16 ± 0.47 ng/mg) than female mice (6.29 ± 0.53 ng/mg) [F(1,11) = 11.6, p < 0.01]. ANOVAs of line (2) x sex (2) x treatment (3) on NAc 5-HIAA, 5-HT turnover, and NE yielded a significant main effect of sex on 5-HT turnover: female mice (0.18 ± 0.01) showed higher NAc 5-HT turnover than male mice (0.15 ± 0.01) [F(1,11) = 8.6, p < 0.05].
STR.
ANOVAs of line (2) x sex (2) x treatment (3) on STR DA, DOPAC, and HVA showed that HAP2 mice had marginally higher STR DA content than LAP2 mice [F(1,11) = 4.4, p = 0.06; Table 1]. The same analysis on STR DA turnover yielded a significant main effect of treatment [F(2,11) = 4.0, p < 0.05]. Tukey’s posthoc did not detect significant treatment group differences. However, the main effect of treatment appears to be driven by an increase in DA turnover in the 1.0 mg/kg nicotine group across both mouse lines (p = 0.1; Table 1). ANOVAs of line (2) x sex (2) x treatment (3) on STR 5-HT, 5-HIAA, 5-HT turnover, and NE did not yield any significant main effect or interaction (Table 1).
HAP3 and LAP3 mice.
NAc.
ANOVAs of line (2) x sex (2) x treatment (3) on NAc DA, DOPAC, and HVA yielded significant main effects of line on DA [F(1,18) = 10.8, p < 0.005] and DOPAC [F(1,18) = 5.3, p < 0.05] contents (LAP3 > HAP3;Table 2). Nicotine treatment had a significant effect on NAc DOPAC [F(2,18) = 8.6, p < 0.005] and HVA contents [F(2,18) = 9.1, p < 0.005]. Tukey’s posthoc showed that both 0.5 and 1.0 mg/kg nicotine doses increased DOPAC levels compared to saline controls in both lines (ps < 0.05). The increased HVA levels in 0.5 and 1.0 mg/kg nicotine groups compared to saline controls were close to significant (ps = 0.06; Table 2). An ANOVA of line (2) x sex (2) x treatment (3) on NAc DA turnover showed that HAP3 mice had higher DA turnover than LAP3 mice across treatment groups [F(1,18) = 5.0, p < 0.05]. Nicotine treatment also had a significant effect on DA turnover [F(2,18) = 6.1, p = 0.01]. Tukey’s posthoc showed that both 0.5 and 1.0 mg/kg nicotine doses increased DA turnover across both mouse lines (p’s < 0.05; Table 2). ANOVAs of line (2) x sex (2) x treatment (3) on NAc 5-HT, 5-HIAA, and 5-HT turnover showed that female mice had higher 5-HIAA content [1.60 ± 0.08 vs. 1.18 ± 0.07 ng/mg; F(1,18) = 11.4, p < 0.005] and 5-HT turnover [0.18 ± 0.01 vs. 0.14 ± 0.01; F(1,18) = 5.4, p < 0.05] than male mice. There were no main or interactive effects of line, sex, or treatment on NAc NE (Table 2).
Table 2.
Neurotransmitter content in HAP3 and LAP3 mice.
| Brain Area |
Line | Treatment (mg/kg nicotine) |
DA | DOPAC | HVA | DA Turnover | 5-HT | 5-HIAA | 5-HT Turnover |
NE |
|---|---|---|---|---|---|---|---|---|---|---|
| NAc | ||||||||||
| HAP3 | 0.0 | 56.2 ± 5.6 | 5.6 ± 0.3 | 6.8 ± 0.7 | 0.22 ± 0.01 | 8.6 ± 0.9 | 1.5 ± 0.1 | 0.17 ± 0.01 | 5.1 ± 1.3 | |
| 0.5 | 68.9 ± 4.0 | 8.0 ± 0.6* | 8.5 ± 0.4 | 0.24 ± 0.01* | 9.5 ± 0.7 | 1.6 ± 0.2 | 0.17 ± 0.03 | 4.5 ± 0.9 | ||
| 1.0 | 58.2 ± 6.6 | 7.7 ± 0.9* | 8.3 ± 0.5 | 0.28 ± 0.02* | 8.6 ± 0.2 | 1.4 ± 0.2 | 0.16 ± 0.02 | 5.1 ± 1.7 | ||
| LAP3 | 0.0 | 78.3 ± 4.7 | 6.5 ± 0.3 | 7.3 ± 0.3 | 0.18 ± 0.01 | 8.6 ± 1.0 | 1.3 ± 0.1 | 0.15 ± 0.02 | 4.1 ± 0.6 | |
| 0.5 | 68.2 ± 5.9 | 8.3 ± 0.9* | 7.5 ± 0.6 | 0.23 ± 0.01* | 8.6 ± 0.5 | 1.2 ± 0.2 | 0.14 ± 0.02 | 4.3 ± 0.2 | ||
| 1.0 | 68.7 ± 4.5 | 8.4 ± 0.6* | 7.7 ± 0.5 | 0.24 ± 0.01* | 8.2 ± 0.6 | 1.2 ± 0.1 | 0.15 ± 0.01 | 3.7 ± 0.5 | ||
| STR | ||||||||||
| HAP3 | 0.0 | 85.0 ± 7.5 | 4.8 ± 0.2 | 8.1 ± 0.5 | 0.16 ± 0.01 | 4.9 ± 0.3 | 1.1 ± 0.1 | 0.22 ± 0.01 | 2.3 ± 0.2 | |
| 0.5 | 96.9 ± 6.0 | 5.7 ± 0.2* | 9.5 ± 0.4 | 0.16 ± 0.01 | 5.0 ± 0.3 | 1.0 ± 0.1 | 0.21 ± 0.03 | 2.3 ± 0.3 | ||
| 1.0 | 104.2 ± 6.0 | 6.9 ± 0.8* | 12.0 ±0.8* | 0.18 ± 0.01 | 5.0 ± 0.5 | 1.2 ± 0.2 | 0.23 ± 0.02 | 2.6 ± 0.1 | ||
| LAP3 | 0.0 | 77.1 ± 12.5 | 4.5 ± 0.5 | 7.2 ± 0.8 | 0.16 ± 0.02 | 5.6 ± 0.3 | 0.8 ± 0.1 | 0.15 ± 0.02 | 3.1 ± 0.3 | |
| 0.5 | 113.5 ± 10.8 | 6.4 ± 0.4* | 9.2 ± 1.1 | 0.14 ± 0.01 | 5.4 ± 0.4 | 1.0 ± 0.1 | 0.19 ± 0.03 | 2.4 ± 0.2 | ||
| 1.0 | 102.0 ± 13.6 | 6.0 ± 0.3* | 9.2 ± 0.9* | 0.15 ± 0.01 | 5.3 ± 0.5 | 1.1 ± 0.1 | 0.20 ± 0.01 | 2.4 ± 0.4 |
p < 0.05 when data are collapsed across HAP3 and LAP3 lines.
STR.
ANOVAs of line (2) x sex (2) x treatment (3) on STR DA, DOPAC, HVA, and DA turnover yielded significant main effects of treatment on DOPAC [F(2,18) = 4.7, p < 0.05] and HVA [F(2,18) = 3.4, p = 0.05]. Tukey’s posthoc showed that both 0.5 and 1.0 mg/kg nicotine doses increased STR DOPAC (p < 0.05 and 0.005, respectively), and that 1.0 mg/kg nicotine increased STR HVA (p < 0.005; Table 2). There were no main or interactive effects of line, sex, or treatment on STR 5-HT, 5-HIAA, 5-HT turnover, or NE (Table 2).
DISCUSSION
The main purpose of this study was to assess genetic correlations between nicotine reinforcement-related behaviors, assessed with FC intake and CTA, and genetic predisposition toward alcohol intake/preference in two replicate lines of male and female selectively bred mice (HAP2/3 and LAP2/3 lines). The main results of this study are that HAP2/3 lines showed higher nicotine intake and lower nicotine-induced CTA than LAP2/3 lines. These findings in two independently selected lines of mice strongly support the conclusion that there are common genes that regulate oral intake of alcohol,nicotine, and sensitivity to nicotine-induced CTA (Crabbe et al. 1990). Furthermore, taken together with prior findings that HAP1 and HAP2 mice show weaker alcohol-induced CTA at 2.0 and 4.0 g/kg alcohol compared to LAP1 and LAP2 mice (Chester et al. 2003), these results suggest that reduced sensitivity to the aversive effects of both alcohol and nicotine may be a permissive mechanism that contributes to the increased oral intake of these drugs.
In Experiment 1, we found that HAP2/3 mice showed greater nicotine intake and intake ratio compared to LAP2/3 mice. This finding supports the existing literature in mice and rats showing that alcohol and nicotine FC intake (in mice; Li et al. 2005) and operant self-administration (in rats; Lê et al., 2006) are correlated. Importantly, our finding that HAP mice showed greater nicotine intake than LAP mice in both replicate lines provides strong evidence for a true genetic correlation between nicotine and alcohol intake. Additionally, we found no differences between HAP2/3 and LAP2/3 mice in quinine intake or intake ratio (Fig. 2), consistent with previous findings in HAP1 and LAP1 mice (Grahame et al. 1999), which suggests that the line differences in nicotine intake are, in general, not associated with differential sensitivity to bitter tastants. This interpretation is supported by previous findings in inbred mice that showed that strain differences in nicotine oral intake were not associated with taste factors (Glatt et al. 2009). Although we found that HAP2 also consumed more water than LAP2 mice in both Experiments 1.1 and 1.2, the interpretations of our findings should not be significantly affected by this because, in Experiment 1.1 (nicotine FC intake), in addition to greater nicotine intake, HAP2 also showed greater nicotine intake ratio (which takes into account water intake) than LAP2 mice, and in Experiment 1.2 (quinine FC intake), HAP2 and LAP2 mice did not show statistically significant differences in both quinine intake and intake ratio. Taken together, these findings suggest that the line differences in nicotine intake in HAP and LAP mice are influenced by differential sensitivity to nicotine’s post-ingestive motivational effects and are regulated by genes selected for high or low alcohol preference in these lines.
The nAChR antagonist, mecamylamine, reduced nicotine intake and intake ratio with no effect on water intake in HAP2 mice at a 3 mg/kg dose (Fig. 3), which suggests that nicotine intake in HAP2 mice is pharmacologically-relevant and influenced by nAChRs. The effects of 3 mg/kg mecamylamine on nicotine intake is unlikely to be a result of locomotor suppression because water intake was not significantly affected. Moreover, mecamylamine up to doses of 10 mg/kg were reported to have no significant effects on locomotor activity in mice (Perez et al. 2015). However, mecamylamine may affect nicotine intake by affecting nicotine pharmacokinetics. For example, a study had previously shown that mecamylamine treatment reduces brain availability of nicotine in mice (Mansner & Mattila 1977), an effect that may potentially influence nicotine intake. Nevertheless, given that previous studies have shown that mecamylamine also reduced nicotine IVSA (Watkins et al. 1999; Rowland et al. 2008) and FC alcohol drinking (Blomqvist et al. 1996) in rats, as well as binge-like alcohol drinking in mice (Hendrickson et al. 2009), nAChRs clearly play a key role in nicotine and alcohol intake behaviors and thus represent an important therapeutic target for treating problematic tobacco and alcohol use.
In Experiment 2, HAP2/3 mice showed lower sensitivity to nicotine-induced CTA compared to LAP2/3 mice (Fig. 4). Given that HAP2/3 mice showed greater nicotine intake than LAP2/3 mice in Experiment 1, we speculate that nicotine intake and nicotine-induced CTA have an inverse genetic relationship, similar to the inverse genetic relationship between alcohol intake/preference and alcohol-induced CTA shown in these selected lines (Chester et al. 2003) and in inbred mouse strains (Broadbent et al. 2002; Cunningham 2014).. Taken together, it may be that that genetic factors that contribute to higher alcohol intake may also contribute to higher nicotine intake by conferring lower sensitivity to the aversive effects of these drugs (as measured by CTA).
In Experiment 3, nicotine significantly increased DA turnover across both HAP2/3 and LAP2/3 lines in the NAc, consistent with a body of literature showing that nicotine increases midbrain DAergic activity, which in turn, has been shown in many studies to be important for nicotine self-administration behaviors (Leri & Vaccarino 2016). However, the lack of line difference in nicotine’s effects on DA turnover, as well as on the levels of any of the neurotransmitters measured, suggest that the line differences in nicotine intake and nicotine-induced CTA are regulated by other neural mechanisms.
A limitation to our neurochemical analyses is the lack of spatial and temporal resolution in the manner our tissue samples were collected (whole NAc and STR tissues were collected 10 min following nicotine or saline injection). Drug-induced neurochemical changes may vary with time (Bourne 2003) and by subregions within the NAc and STR (Sellings et al. 2008). Future studies using techniques with better spatiotemporal resolution, such as microdialysis, will provide a more accurate picture of the neurochemical dynamics following drug challenge.
It is possible that genes encoding nAChRs may contribute to the line differences in nicotine oral intake and CTA because studies have found that nAChR-encoding genes contributes to both nicotine and alcohol sensitivity in humans (e.g. Hoft et al. 2009) and mice (e.g. Powers et al. 2013). Comparisons of nAChR neuropharmacology between HAP and LAP mouse lines may represent a useful approach to further understand how this receptor system contributes to nicotine and alcohol intake. One genetic factor of interest is the CHRNA5-CHRNA3-CHRNB4 gene cluster, which encodes α5, α3, and β4 nAChR subunits. Over the past decade, studies in humans show that this gene cluster is strongly associated with nicotine and alcohol dependence (Joslyn et al. 2008; Hällfors et al. 2013), and studies in rodents show that α5α3β4-containing nAChRs regulate alcohol and nicotine intake (Fowler et al. 2011; Gallego et al. 2012), possibly through aversion-related mechanisms (Frahm et al. 2011). This receptor system represents a promising therapeutic target that warrants further mechanistic studies.
In conclusion, the findings indicate that nicotine FC intake and nicotine-induced CTA are phenotypes genetically correlated with propensity toward alcohol intake/preference. Genetic factors that permit higher FC alcohol intake may also permit higher FC nicotine intake and confer lower sensitivity to the aversive effects of nicotine, as measured by CTA. In addition, our results suggest that NAc and STR DAergic, serotonergic, and noradrenergic activity are not involved in the differences in sensitivity to nicotine between HAP2/3 and LAP2/3 mice. Given that mechanisms that modulate aversive effects of drugs may limit drug intake, future studies should focus on elucidating these mechanisms to inform the development of novel prevention and treatment strategies for problematic tobacco and alcohol use.
ACKNOWLEDGEMENTS
This study was supported by the Purdue Research Foundation and the National Institute on Alcohol Abuse and Alcoholism (AA013522 to Richard Bell and AA07611 to David Crabb) and the National Institute of Environmental Health Sciences at the National Institutes of Health (R01ES025750 to J.R.C.).
Footnotes
The authors report no conflicts of interest.
REFERENCES
- Barrenha GD & Chester JA (2007) Genetic correlation between innate alcohol preference and fear-potentiated startle in selected mouse lines. Alcohol Clin Exp Res 31, 1081–1088. [DOI] [PubMed] [Google Scholar]
- Besson M, David V, Baudonnat M, Cazala P, Guilloux J-P, Reperant C, Cloez-Tayarani I, Changeux J-P, Gardier AM & Granon S (2012) Alpha7-nicotinic receptors modulate nicotine-induced reinforcement and extracellular dopamine outflow in the mesolimbic system in mice. Psychopharmacology (Berl) 220, 1–14. [DOI] [PubMed] [Google Scholar]
- Blomqvist O, Ericson M, Johnson DH, Engel JA & Söderpalm B (1996) Voluntary ethanol intake in the rat: effects of nicotinic acetylcholine receptor blockade or subchronic nicotine treatment. Eur J Pharmacol 314, 257–267. [DOI] [PubMed] [Google Scholar]
- Bourne JA (2003) Intracerebral microdialysis: 30 years as a tool for the neuroscientist. Clin Exp Pharmacol Physiol 30, 16–24. [DOI] [PubMed] [Google Scholar]
- Broadbent J, Muccino KJ & Cunningham CL (2002) Ethanol-induced conditioned taste aversion in 15 inbred mouse strains. Behav Neurosci 116, 138–148. [PubMed] [Google Scholar]
- Carmody TP, Brischetto CS, Matarazzo JD, O’Donnell RP & Connor WE (1985) Co-occurrent use of cigarettes, alcohol, and coffee in healthy, community-living men and women. Health Psychol 4, 323–335. [DOI] [PubMed] [Google Scholar]
- Chester JA & Barrenha GD (2007) Acoustic startle at baseline and during acute alcohol withdrawal in replicate mouse lines selectively bred for high or low alcohol preference. Alcohol Clin Exp Res 31, 1633–1644. [DOI] [PubMed] [Google Scholar]
- Chester JA, Lumeng L, Li T-K & Grahame NJ (2003) High- and low-alcohol-preferring mice show differences in conditioned taste aversion to alcohol. Alcohol Clin Exp Res 27, 12–18. [DOI] [PubMed] [Google Scholar]
- Crabbe JC, Phillips TJ, Kosobud A & Belknap JK (1990) Estimation of genetic correlation: interpretation of experiments using selectively bred and inbred animals. Alcohol Clin Exp Res 14, 141–151. [DOI] [PubMed] [Google Scholar]
- Cunningham CL (2014) Genetic relationship between ethanol-induced conditioned place preference and other ethanol phenotypes in 15 inbred mouse strains. Behav Neurosci 128, 430–445. [DOI] [PMC free article] [PubMed] [Google Scholar]
- Cunningham CL, Fidler TL & Hill KG (2000) Animal models of alcohol’s motivational effects. Alcohol Res 24, 85–92. [PMC free article] [PubMed] [Google Scholar]
- De Fiebre CM, Medhurst LJ & Collins AC (1987) Nicotine response and nicotinic receptors in long-sleep and short-sleep mice. Alcohol 4, 493–501. [DOI] [PubMed] [Google Scholar]
- DiFranza JR & Guerrera MP (1990) Alcoholism and smoking. J Stud Alcohol 51, 130–135. [DOI] [PubMed] [Google Scholar]
- Falk DE, Yi H & Hiller-Sturmhöfel S (2006) An epidemiologic analysis of co-occurring alcohol and tobacco use and disorders: findings from the National Epidemiologic Survey on Alcohol and Related Conditions. Alcohol Res 29, 162–171. [PMC free article] [PubMed] [Google Scholar]
- de Fiebre NC, Dawson R Jr & de Fiebre CM (2002) The selectively bred high alcohol sensitivity (HAS) and low alcohol sensitivity (LAS) rats differ in sensitivity to nicotine. Alcohol Clin Exp Res 26, 765–772. [PubMed] [Google Scholar]
- Fowler CD, Lu Q, Johnson PM, Marks MJ & Kenny PJ (2011) Habenular α5 nicotinic receptor subunit signalling controls nicotine intake. Nature 471, 597–601. [DOI] [PMC free article] [PubMed] [Google Scholar]
- Frahm S, Ślimak MA, Ferrarese L, Santos-Torres J, Antolin-Fontes B, Auer S, Filkin S, Pons S, Fontaine J-F, Tsetlin V, Maskos U & Ibañez-Tallon I (2011) Aversion to nicotine Is regulated by the balanced activity of β4 and α5 nicotinic receptor subunits in the medial habenula. Neuron 70, 522–535. [DOI] [PubMed] [Google Scholar]
- Freeman GB, Sherman KA & Gibson GE (1987) Locomotor activity as a predictor of times and dosages for studies of nicotine’s neurochemical actions. Pharmacol Biochem Behav 26, 305–312. [DOI] [PubMed] [Google Scholar]
- Gallego X, Ruiz-Medina J, Valverde O, Molas S, Robles N, Sabrià J, Crabbe JC & Dierssen M (2012) Transgenic over expression of nicotinic receptor alpha 5, alpha 3, and beta 4 subunit genes reduces ethanol intake in mice. Alcohol 46, 205–215. [DOI] [PMC free article] [PubMed] [Google Scholar]
- Glatt AR, Denton K & Boughter JD (2009) Variation in nicotine consumption in inbred mice is not linked to orosensory ability. Chem Senses 34, 27–35. [DOI] [PMC free article] [PubMed] [Google Scholar]
- Grahame NJ, Li TK & Lumeng L (1999) Selective breeding for high and low alcohol preference in mice. Behav Genet 29, 47–57. [DOI] [PubMed] [Google Scholar]
- Hällfors J, Loukola A, Pitkäniemi J, Broms U, Männistö S, Salomaa V, Heliövaara M, Lehtimäki T, Raitakari O, Madden PA, Heath AC, Montgomery GW, Martin NG, Korhonen T & Kaprio J (2013) Scrutiny of the CHRNA5-CHRNA3-CHRNB4 smoking behavior locus reveals a novel association with alcohol use in a Finnish population based study. Int J Mol Epidemiol Genet 4, 109–119. [PMC free article] [PubMed] [Google Scholar]
- Hendrickson LM, Zhao-Shea R & Tapper AR (2009) Modulation of ethanol drinking-in-the-dark by mecamylamine and nicotinic acetylcholine receptor agonists in C57BL/6J mice. Psychopharmacology (Berl) 204, 563–572. [DOI] [PMC free article] [PubMed] [Google Scholar]
- Hoft NR, Corley RP, McQueen MB, Huizinga D, Menard S & Ehringer MA (2009) SNPs in CHRNA6 and CHRNB3 are associated with alcohol consumption in a nationally representative sample. Genes Brain Behav 8, 631–637. [DOI] [PMC free article] [PubMed] [Google Scholar]
- Joslyn G, Brush G, Robertson M, Smith TL, Kalmijn J, Schuckit M & White RL (2008) Chromosome 15q25.1 genetic markers associated with level of response to alcohol in humans. Proc Natl Acad Sci U S A 105, 20368–20373. [DOI] [PMC free article] [PubMed] [Google Scholar]
- Kasten CR, Blasingame SN & Boehm SL II (2015) Bidirectional enantioselective effects of the GABAB receptor agonist baclofen in two mouse models of excessive ethanol consumption. Alcohol 49, 37–46. [DOI] [PMC free article] [PubMed] [Google Scholar]
- Lê AD, Li Z, Funk D, Shram M, Li TK & Shaham Y (2006) Increased vulnerability to nicotine self-administration and relapse in alcohol-naive offspring of rats selectively bred for high alcohol intake. J Neurosci Off J Soc Neurosci 26, 1872–1879. [DOI] [PMC free article] [PubMed] [Google Scholar]
- Leri F & Vaccarino FJ (2016) Tribute to: Self-administered nicotine activates the mesolimbic dopamine system through the ventral tegmental area [William Corrigall, Kathleen Coen and Laurel Adamson, Brain Res 653 (1994) 278–284]. Brain Res 1645, 61–64. [DOI] [PubMed] [Google Scholar]
- Li XC, Karadsheh MS, Jenkins PM & Stitzel JA (2005) Genetic correlation between the free-choice oral consumption of nicotine and alcohol in C57BL/6JxC3H/HeJ F2 intercross mice. Behav Brain Res 157, 79–90. [DOI] [PubMed] [Google Scholar]
- Lim SS, Vos T, Flaxman AD, Danaei G, Shibuya K, Adair-Rohani H, Amann M, Anderson HR, Andrews KG, Aryee M, Atkinson C, Bacchus LJ, Bahalim AN, Balakrishnan K, Balmes J, Barker-Collo S, Baxter A, Bell ML, Blore JD, Blyth F, Bonner C, Borges G, Bourne R, Boussinesq M, Brauer M, Brooks P, Bruce NG, Brunekreef B, Bryan-Hancock C, Bucello C, Buchbinder R, Bull F, Burnett RT, Byers TE, Calabria B, Carapetis J, Carnahan E, Chafe Z, Charlson F, Chen H, Chen JS, Cheng AT-A, Child JC, Cohen A, Colson KE, Cowie BC, Darby S, Darling S, Davis A, Degenhardt L, Dentener F, Des Jarlais DC, Devries K, Dherani M, Ding EL, Dorsey ER, Driscoll T, Edmond K, Ali SE, Engell RE, Erwin PJ, Fahimi S, Falder G, Farzadfar F, Ferrari A, Finucane MM, Flaxman S, Fowkes FGR, Freedman G, Freeman MK, Gakidou E, Ghosh S, Giovannucci E, Gmel G, Graham K, Grainger R, Grant B, Gunnell D, Gutierrez HR, Hall W, Hoek HW, Hogan A, Hosgood HD, Hoy D, Hu H, Hubbell BJ, Hutchings SJ, Ibeanusi SE, Jacklyn GL, Jasrasaria R, Jonas JB, Kan H, Kanis JA, Kassebaum N, Kawakami N, Khang Y-H, Khatibzadeh S, Khoo J-P, Kok C, Laden F, Lalloo R, Lan Q, Lathlean T, Leasher JL, Leigh J, Li Y, Lin JK, Lipshultz SE, London S, Lozano R, Lu Y, Mak J, Malekzadeh R, Mallinger L, Marcenes W, March L, Marks R, Martin R, McGale P, McGrath J, Mehta S, Mensah GA, Merriman TR, Micha R, Michaud C, Mishra V, Mohd Hanafiah K, Mokdad AA, Morawska L, Mozaffarian D, Murphy T, Naghavi M, Neal B, Nelson PK, Nolla JM, Norman R, Olives C, Omer SB, Orchard J, Osborne R, Ostro B, Page A, Pandey KD, Parry CDH, Passmore E, Patra J, Pearce N, Pelizzari PM, Petzold M, Phillips MR, Pope D, Pope CA, Powles J, Rao M, Razavi H, Rehfuess EA, Rehm JT, Ritz B, Rivara FP, Roberts T, Robinson C, Rodriguez-Portales JA, Romieu I, Room R, Rosenfeld LC, Roy A, Rushton L, Salomon JA, Sampson U, Sanchez-Riera L, Sanman E, Sapkota A, Seedat S, Shi P, Shield K, Shivakoti R, Singh GM, Sleet DA, Smith E, Smith KR, Stapelberg NJC, Steenland K, Stöckl H, Stovner LJ, Straif K, Straney L, Thurston GD, Tran JH, Van Dingenen R, van Donkelaar A, Veerman JL, Vijayakumar L, Weintraub R, Weissman MM, White RA, Whiteford H, Wiersma ST, Wilkinson JD, Williams HC, Williams W, Wilson N, Woolf AD, Yip P, Zielinski JM, Lopez AD, Murray CJL, Ezzati M, AlMazroa MA & Memish ZA (2012) A comparative risk assessment of burden of disease and injury attributable to 67 risk factors and risk factor clusters in 21 regions, 1990–2010: a systematic analysis for the Global Burden of Disease Study 2010. Lancet 380, 2224–2260. [DOI] [PMC free article] [PubMed] [Google Scholar]
- Mansner R & Mattila MJ (1977) Pharmacokinetics of nicotine in adult and infant mice. Med Biol 55, 317–324. [PubMed] [Google Scholar]
- McKee SA & Weinberger AH (2013) How can we use our knowledge of alcohol-tobacco interactions to reduce alcohol use? Annu Rev Clin Psychol 9, 649–674. [DOI] [PMC free article] [PubMed] [Google Scholar]
- Miller NS & Gold MS (1998) Comorbid cigarette and alcohol addiction: epidemiology and treatment. J Addict Dis 17, 55–66. [DOI] [PubMed] [Google Scholar]
- Oberlin B, Best C, Matson L, Henderson A & Grahame N (2010) Derivation and characterization of replicate high- and low-alcohol preferring lines of mice and a high-drinking crossed HAP line. Behav Genet 41, 288–302. [DOI] [PMC free article] [PubMed] [Google Scholar]
- Oberlin BG & Grahame NJ (2009) High-alcohol preferring mice are more impulsive than low-alcohol preferring mice as measured in the delay discounting task. Alcohol Clin Exp Res 33, 1294–1303. [DOI] [PMC free article] [PubMed] [Google Scholar]
- Perez E, Quijano-Cardé N & De Biasi M (2015) Nicotinic mechanisms modulate ethanol withdrawal and modify time course and symptoms severity of simultaneous withdrawal from alcohol and nicotine. Neuropsychopharmacol 40, 2327–2336. [DOI] [PMC free article] [PubMed] [Google Scholar]
- Powers MS, Broderick HJ, Drenan RM & Chester JA (2013) Nicotinic acetylcholine receptors containing α6 subunits contribute to alcohol reward-related behaviours. Genes Brain Behav [DOI] [PMC free article] [PubMed] [Google Scholar]
- Risinger FO & Brown MM (1996) Genetic differences in nicotine-induced conditioned taste aversion. Life Sci 58, 223–229. [DOI] [PubMed] [Google Scholar]
- Robinson SF, Marks MJ & Collins AC (1996) Inbred mouse strains vary in oral self-selection of nicotine. Psychopharmacology (Berl) 124, 332–339. [DOI] [PubMed] [Google Scholar]
- Rowland NE, Robertson K, Soti F & Kem WR (2008) Nicotine analog inhibition of nicotine self-administration in rats. Psychopharmacology (Berl) 199, 605–613. [DOI] [PubMed] [Google Scholar]
- Sellings LHL, Baharnouri G, McQuade LE & Clarke PBS (2008) Rewarding and aversive effects of nicotine are segregated within the nucleus accumbens. Eur J Neurosci 28, 342–352. [DOI] [PubMed] [Google Scholar]
- Swan GE, Carmelli D & Cardon LR (1997) Heavy consumption of cigarettes, alcohol and coffee in male twins. J Stud Alcohol 58, 182–190. [DOI] [PubMed] [Google Scholar]
- Wang Y, Lee J-W, Oh G, Grady SR, McIntosh JM, Brunzell DH, Cannon JR & Drenan RM (2014) Enhanced synthesis and release of dopamine in transgenic mice with gain-of-function α6* nAChRs. J Neurochem 129, 315–327. [DOI] [PMC free article] [PubMed] [Google Scholar]
- Watkins SS, Epping-Jordan MP, Koob GF & Markou A (1999) Blockade of nicotine self-administration with nicotinic antagonists in rats. Pharmacol Biochem Behav 62, 743–751. [DOI] [PubMed] [Google Scholar]