Abstract
Tuberculosis is a devastating disease and has shown resurgence in recent years with the advent of acquired immunodeficiency syndrome. Central nervous system involvement is the most devastating form of the disease, comprising 10% of all tuberculosis cases. The causative organism, Mycobacterium tuberculosis, incites a granulomatous inflammatory response in the brain, the effects of which can be appreciated on magnetic resonance imaging (MRI), which can thus be used for diagnosis of the same. Neurotuberculosis can present in various patterns, which can be identified on MRI. The meningeal forms include leptomeningitis and pachymeningitis. Parenchymal forms of neurotuberculosis include tuberculoma in its various stages, tubercular cerebritis and abscess, tubercular rhombencephalitis, and tubercular encephalopathy. Each pattern has characteristic MRI appearances and differential diagnoses on imaging. Complications of neurotuberculosis, usually of tubercular meningitis, include hydrocephalus, vasculitis, and infarcts as well as cranial nerve palsies. Various MRI sequences besides the conventional ones can provide additional insight into the disease, help in quantifying the disease load, and help in differentiation of neurotuberculosis from conditions with similar imaging appearances and presentations. These can enable accurate and timely diagnosis by the radiologist and early institution of treatment in order to reduce the likelihood of permanent neurological sequelae.
Keywords: tuberculoma, MRI, brain, tuberculosis, spectroscopy
Introduction
Tuberculosis (TB) is a devastating disease caused by Mycobacterium tuberculosis with over eight million deaths reported annually worldwide from direct or indirect consequences of the disease [1]. It has shown a resurgence in recent years even in non-endemic areas with the advent of acquired immunodeficiency syndrome (AIDS), with 9272 cases of TB reported in USA in 2016 [2]. Central nervous system (CNS) involvement is the most devastating form of the disease and is an important cause of morbidity and mortality in affected individuals, with permanent sequelae occurring in the majority of the victims. It comprises 10% of all tuberculosis cases and 20% of TB cases in immunocompromised patients [3,4]. In almost all cases, the causative organism is M. tuberculosis. The most common mode of spread of the infection to the CNS is via the haematological route, usually from a pulmonary focus. A few rare cases of direct spread from the paranasal sinuses, mastoids, or orbit have also been reported [5]. Once the organism gains access to the CNS, it incites a strong granulomatous inflammatory response, the effects of which can usually be readily appreciated on magnetic resonance imaging (MRI), thus enabling radiological diagnosis and timely institution of treatment. The cardinal challenge in diagnosis of the condition on MRI stems from the “many faces” of the disease, i.e. the spectrum of appearances on MRI that the condition can potentially produce. In this paper we have reviewed the various patterns of intracranial tubercular infection with the various MRI features of each pattern and their complications. In addition, possible close differentials that may present a diagnostic challenge have also been discussed, with special attention to the differentiating features using both conventional MRI as well as advanced MRI techniques.
Spectrum of intracranial tuberculosis
Intracranial tuberculosis can be broadly divided into meningeal and parenchymal patterns of involvement (Table 1). Any combination of the patterns can also occur.
Table 1.
Patterns of central nervous system tuberculosis
| Meningeal tuberculosis | Parenchymal tuberculosis |
|---|---|
| Leptomeningitis | Tuberculoma |
| Pachymeningitis | Cerebritis |
| Abscess | |
| Rhombencephalitis | |
| Encephalopathy |
MRI protocol
Any MRI performed for suspected intracranial tuberculosis should include axial precontrast T1W, T2W, FLAIR (fluid-attenuated inversion recovery sequence), DWI (diffusion-weighted imaging sequence), and GRE (gradient echo sequence)/SWI (susceptibility-weighted imaging sequence) sequences and postcontrast T1W scans in all three planes. 1H proton spectroscopy and magnetisation transfer imaging may be additionally performed in cases where the morphology or distribution of the lesions are atypical, presenting a diagnostic challenge. Magnetic resonance angiography (MRA) and magnetic resonance venography (MRV) may be used in cases with suspected vascular complications.
Meningeal tuberculosis
Tubercular leptomeningitis
This is the most common manifestation of CNS tuberculosis overall and also the most common pattern associated with complications [6]. The organism seeds into a subpial (rarely subependymal) focus of infection called the ‘Rich focus’, which subsequently ruptures into the subarachnoid (or ventricular) space and triggers an inflammatory response. Meningitis usually presents with features of meningeal irritation such as neck stiffness and photophobia, although it may sometimes have an insidious presentation, especially in children [7].
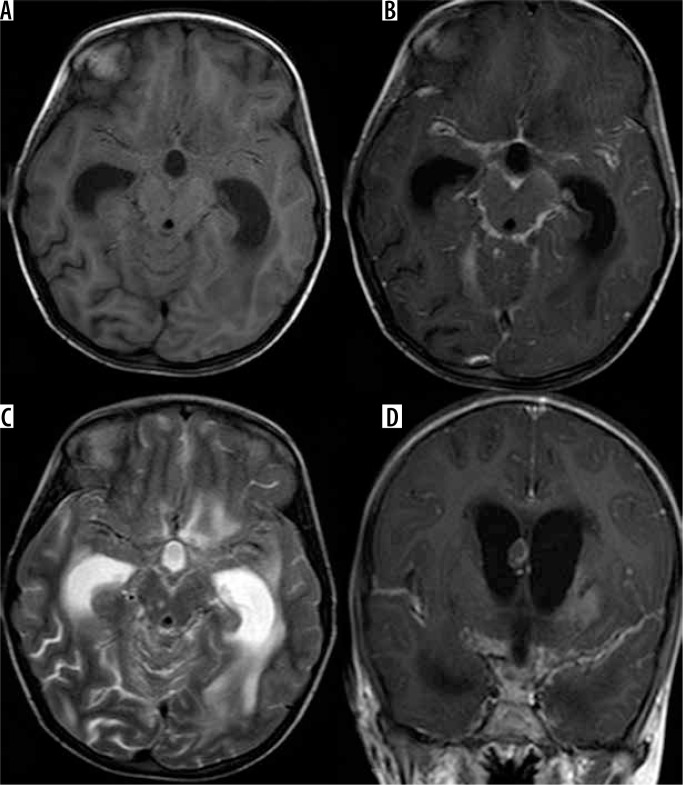
On MRI, diffusely enhancing exudates involving the basal cisterns are the most consistent feature. Diffuse leptomeningeal enhancement on post contrast T1W images in the involved regions is evident [8]. The leptomeningeal enhancement shows a distinctive predilection to involve the basal cisterns in TB, in particular the perimesencephalic, interpeduncular, prepontine, and suprasellar cisterns. It frequently extends along the inferomedial surface of the frontal lobes, the anteromedial surface of the temporal lobes, the floor of the third ventricle, the superior aspect of the tentorial surface, and along the sylvian fissures. Associated altered signal intensity of the cerebrospinal fluid (CSF) in the basal cisterns and sylvian fissures may also be evident even on precontrast scans (Figure 1). Magnetisation transfer MRI (MT-MRI) is useful, particularly in cases of mild meningitis, because the conspicuity of the meningeal thickening (on precontrast scans) and enhancement (on postcontrast scans) is accentuated, allowing accurate radiological delineation of the disease load by increasing the detectability of lesions [9,10].
Figure 1.
Tubercular leptomeningitis. A (T1W axial) and C (T2W axial) show altered signal intensity in the basal cisterns. B (T1WCE axial) and D (T1WCE coronal) show diffuse leptomeningeal enhancement along the basal cisterns and Sylvian fissures with dilated lateral ventricles
Tubercular pachymeningitis
Tubercular pachymeningitis is a relatively uncommon entity as compared to tubercular leptomeningitis. The vast majority of cases of pachymeningitis are secondary to acute or chronic tubercular leptomeningitis, although a few cases of direct seeding of the dura with bacteria by haematogenous spread resulting in isolated pachymeningitis have also been reported. On MRI, it is characterised by focal or diffuse dural thickening and avid post-contrast dural enhancement. FLAIR sequence is especially useful for visualisation of the thickened dura [11,12]. The diagnosis is straightforward in cases associated with other characteristic features of CNS tuberculosis. However, in isolated cases the condition may be difficult to differentiate from other causes of pachymeningitis, such as neurosarcoidosis, autoimmune disorders (such as Wegener’s granulomatosis, rheumatoid arthritis), neurosyphilis, idiopathic hypertrophic pachymeningitis, and en plaque meningioma.
Parenchymal tuberculosis
Tuberculoma
Parenchymal tuberculomas are the most common form of intracranial parenchymal tuberculosis. They occur due to conglomeration and coalescence of tubercular microgranulomas, which tend to occur at the grey-white matter junction due to arrest of the haematogenously spread microbes caused by a reduction in calibre of vessels in that region. Occasionally, lesions can develop in the brain parenchyma secondary to spread of CSF infection through the perivascular (Virchow Robin) spaces [13]. They can, however, occur in almost any possible location in the brain, including the sulcal spaces, brainstem, cerebellar hemispheres, basal cisterns, and the ventricular system. They also show a tendency to conglomerate and occur in clusters or coalesce into larger tuberculomas. Tuberculomas are more common in children and are predominantly infratentorial. In adults they tend to be predominantly supratentorial. Pathologically tuberculoma consists of a typical granuloma with central caseous necrosis. Clinically they present with headache, seizures, raised intracranial tension (ICT), focal neurological deficits, and fever.
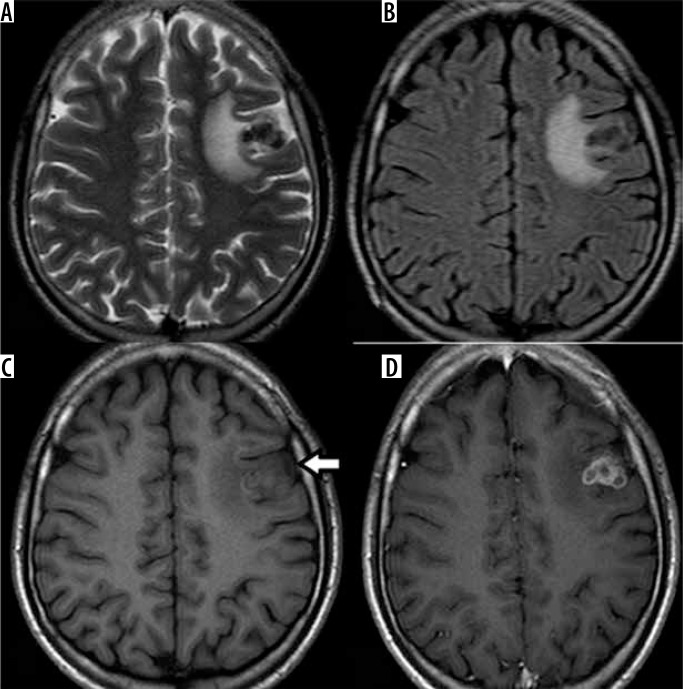
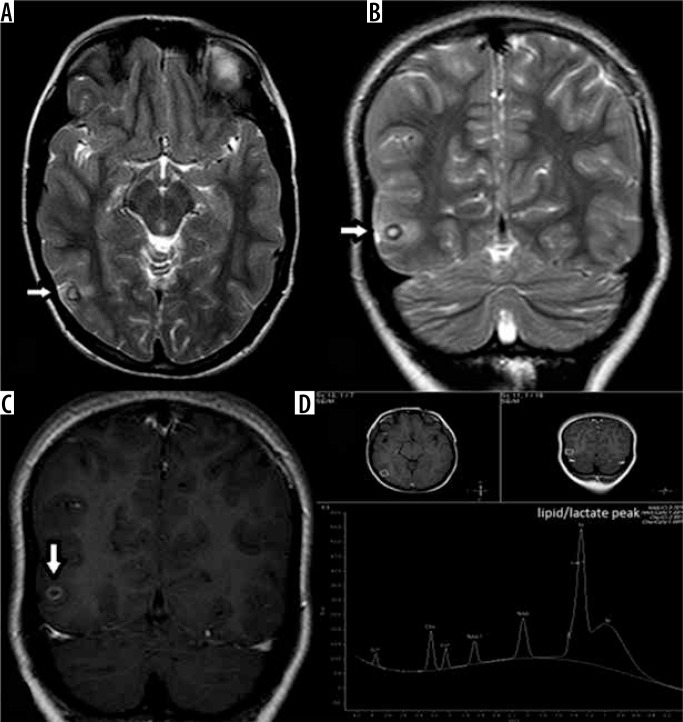
Stages of tuberculoma: Tuberculomas occur in four stages – non caseating granuloma, caseating granuloma, caseating granuloma with central liquefaction, and calcified granuloma (Figures 2 and 3). Pathologically tuberculoma consist of a typical granuloma with epithelioid cells, Langhans giant cells, and a peripheral rim of lymphocytes. Central caseous necrosis followed by liquefaction develops in subsequent stages. Post treatment a paradoxical increase in size of tuberculoma can occur. They may resolve completely, but in most cases they resolve with the formation of calcified granulomas. Their MRI appearance, although somewhat variable, in the majority of cases is as depicted in Table 2 [14,15].
Figure 2.
Caseating tuberculomas. A (T2W axial) and B (FLAIR axial) show conglomerate hypointense lesions in left frontal region with perilesional oedema, which on C (T1W axial) appear isointense with a hyperintense rim. D (T1WCE axial) shows ring enhancement of the conglomerate tuberculomas
Figure 3.
Caseating tuberculoma with liquefaction. A (T2W axial) and B (T2W coronal) show a focal lesion with T2 hypointense rim and central hyperintensity. C (T1WCE coronal) shows ring enhancement of the lesion. D (MR spectroscopy) shows lipid peak at 1.3 ppm
Table 2.
MRI appearance of tuberculoma
| Lesion | T1W | T2W | FLAIR | DWI | T1WCE |
|---|---|---|---|---|---|
| Non caseating granuloma | Iso- to hypointense | Hyperintense | No suppression | No restriction | Homogeneous enhancement |
| Caseating granuloma (Figure 2) | Iso- to hypointense with hyperintense rim | Hypointense | No suppression | No restriction | Homogeneous or ring enhancement |
| Caseating granuloma with central liquefaction (Figure 3) | Isointense to hypointense with hyperintense rim | Hypointense rim with central hyperintensity | Partial suppression | May or may not show restriction | Ring enhancement |
| Calcified granuloma | Iso- to hypointense | Hypointense | No suppression | No restriction | No enhancement |
The lesion and the hyperintense rim on T1W images in the case of caseating granulomas become more conspicuous on MT T1W images. A combination of factors (fibrosis, gliosis, and macrophage products such as free radicals) are responsible for the T2W hypointensity of the caseous part of the tuberculoma in the caseating granulomatous stages [11]. Perilesional oedema appears hyperintense on T2W and FLAIR sequences and is sometimes more conspicuous than the lesion itself.
In their final stage of resolution, tuberculomas often undergo calcification, and the perilesional oedema resolves completely. Detection can become difficult in this stage using T1W and T2W sequences. GRE/SWI sequences are especially useful in the detection of such calcified lesions due to their magnetic susceptibility effects. It is, however, impossible to differentiate the calcified granuloma due to TB from that due to any other cause based on the imaging findings.
A wide variety of differential diagnoses can be considered for the ring-enhancing lesions of tuberculomas. Important ones include neurocysticercosis, metastasis, CNS lymphoma (in immunocompromised patients), toxoplasmosis, tumours (such as glioblastoma), and pyogenic abscess.
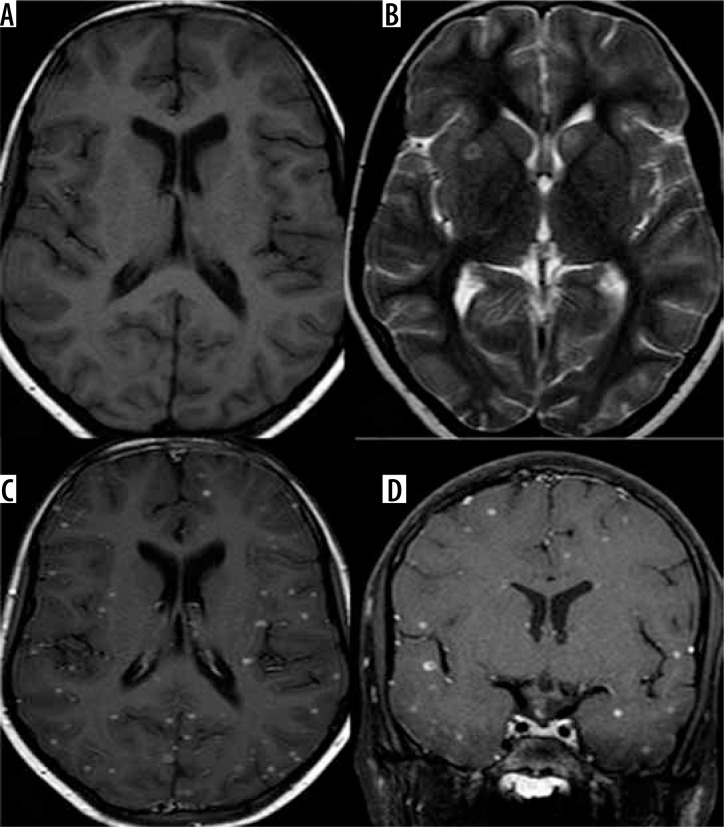
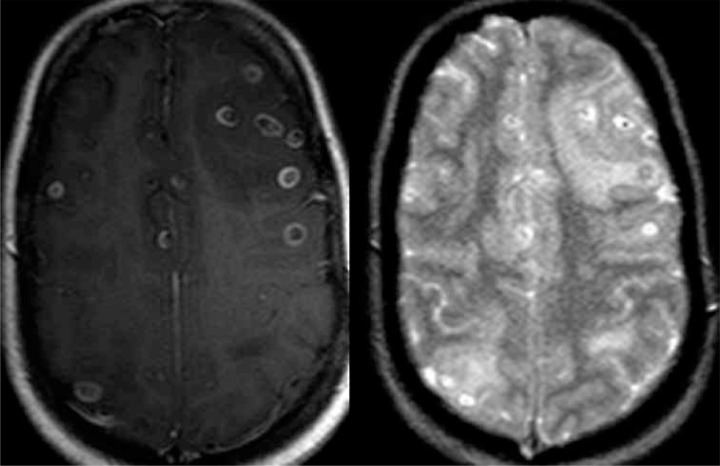
Miliary tuberculomas: These are mostly seen in immunocompromised patients and occur when infection reaches the brain through haematogenous spread, usually from a pulmonary focus. They are usually diffusely scattered in the brain parenchyma, predominantly located at the grey-white matter junction. Innumerable small non caseating granulomas, less than 2-3 mm in size, which show homogeneous post-contrast enhancement, may be detected on MRI (Figure 4). On non-contrast scans they may or may not be visible. They may, however, appear hypointense on T2W sequences, suggestive of caseation. Miliary tuberculomas can have a variety of unusual presentations due to their insignificant mass effect, and may present with headaches, seizures, meningeal signs, and even anxiety [16]. The differential diagnoses for miliary tuberculomas include Lyme’s disease, neurosarcoidosis, metastases, lymphoid granulomatosis, Erdheim-Chester disease, and histoplasmosis.
Figure 4.
Miliary tuberculomas. A (T1W axial) shows no significant abnormality. B (T2W axial) shows two focal lesions in the right lentiform nucleus and the left caudate nucleus. C (T1WCE axial) and D (T1WCE coronal) show numerous focal homogeneously enhancing lesions in the cerebral parenchyma
Tubercular cerebritis
Tubercular cerebritis can occur with or without associated meningitis. Cerebritis refers to involvement of a focal area of brain parenchyma in the infective process, which is identified on MRI as swelling and altered signal intensity of the involved gyri. The gyri appear hypointense on T1W and hyperintense on T2W scans compared to normal parenchyma and show patchy post-contrast enhancement [17]. Pathologically it is composed of tubercular microgranulomata with scarce tubercular bacilli and without the associated caseous necrosis.
Tubercular abscess
Tubercular abscess is an infrequent pattern of presentation, occurring in less than 10% of cases. It is more common in immunocompromised patients and in extremes of age. Patients may present with focal neurological deficits, fever, headache, and features of raised ICT. Clinical progression is usually faster than with tuberculomas. There are two theories of formation of tubercular abscess. One hypothesises progression of tubercular cerebritis and the other, liquefaction of tuberculomas. Pathologically it consists of a walled off collection of pus containing viable and dead bacteria, cellular debris, and caseous material [18]. Tubercular brain abscess being a rare entity, Whitener devised criteria for the pathological diagnosis of the same in a patient with the characteristic clinical presentation, which include three essential features [13,19]:
macroscopic evidence of abscess with pus,
abscess wall of vascular granulation tissue with acute and chronic inflammatory cells,
presence of tubercular bacilli demonstrated on culture or positive acid-fast stain.
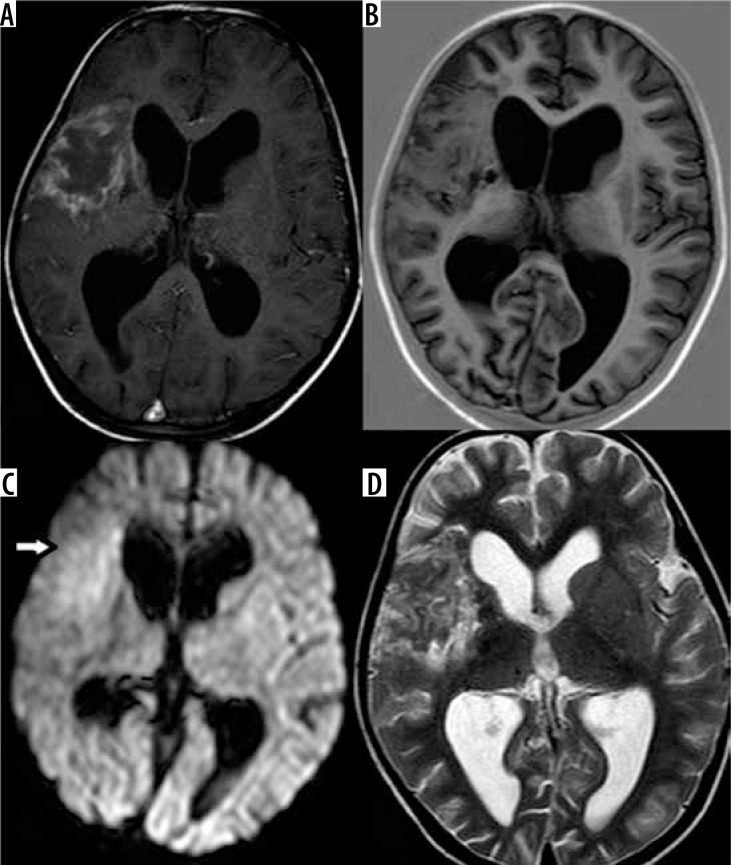
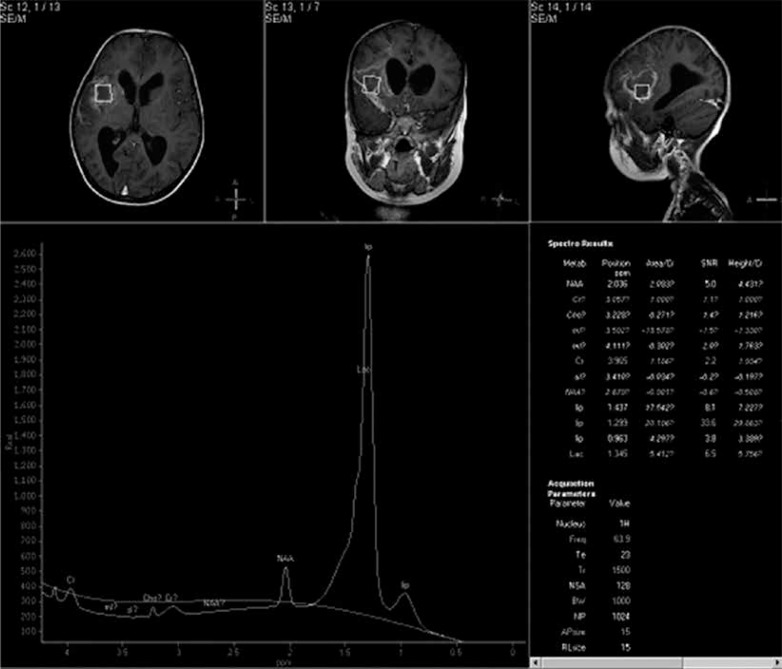
On imaging, an abscess appears as a large (usually > 3 cm), well-defined, localised lesion with perilesional oedema and mass effect. It may be multiloculate. The abscess wall usually appears thin and smooth. Contents of the abscess are usually hypointense on T1W and hyperintense or heterogeneous on T2W with variable degrees of suppression on FLAIR. DWI usually shows restricted diffusion with low apparent diffusion coefficient (ADC) values (Figures 5 and 6). The abscess wall is usually isointense on T1 and hypointense on T2. Tubercular abscess may sometimes be difficult to differentiate from caseating tuberculomas with liquefaction. This differentiation is, however, clinically very important because management of tuberculoma involves medical therapy with antituberculous drugs, while management of tubercular brain abscess involves surgical drainage of the pus. Imaging plays a major role in this. Size > 3 cm, the presence of restricted diffusion, a thin smooth wall, and multiloculation usually favour abscess over tuberculoma, although it is not definitive.
Figure 5.
Tubercular abscess. A (T1WCE axial) shows an irregular hypointense lesion with a thin rim of peripheral enhancement. B (T1IR axial) shows the lesion to by hypointense. The lesion shows diffusion restriction on C (DWI axial) and appears heterogeneous in signal intensity on D (T2W axial)
Figure 6.
Same case as in Figure 5. Magnetic resonance spectroscopy shows large lipid peak at 1.3 ppm
Tuberculous rhombencephalitis
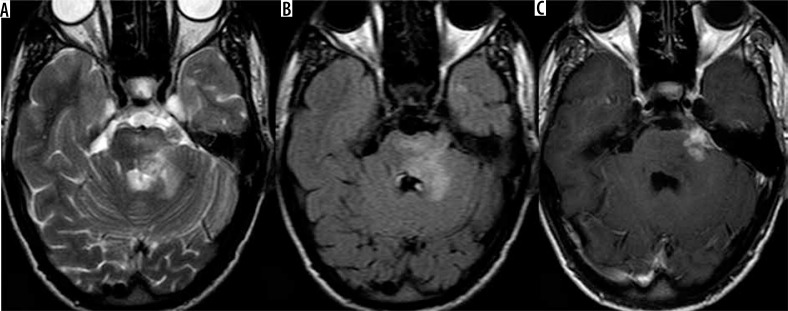
Tuberculous rhombencephalitis is a rare pattern of neurotuberculosis encompassing < 5% of the cases, although it is more frequent in patients with AIDS (~25%) [20]. Patients usually present with cerebellar symptoms or focal neurological deficits of cranial nerve palsies pointing to brainstem involvement. They may also present with signs of raised ICT due to associated hydrocephalus or meningeal irritation due to associated leptomeningitis. There is primary involvement of the cerebellum and brainstem (hindbrain). It is generally in the form of tuberculomas involving the parenchyma of the hindbrain and is frequently associated with leptomeningitis involving the basal cisterns (Figure 7). Associated inflammatory oedema can be visualised as T2W/FLAIR hyperintensity with swelling of the brainstem structures. Often, associated leptomeningitis involving the basal cisterns can also be seen on post-contrast T1W scan. The hallmark of this condition is the high incidence of associated complications such as cranial nerve palsies (leading to focal neurological deficits) and hydrocephalus [21]. Prognosis is poor compared to other forms, with a relatively high rate of mortality and permanent neurological sequelae due to brainstem involvement.
Figure 7.
Tubercular rhombencephalitis. A (T2W axial) and B (FLAIR axial) show conglomerate hypointense lesions involving the pons with perilesional oedema. C (T1WCE axial) shows ring enhancement of the lesions s/o conglomerate tuberculomas
Tuberculous rhombencephalitis can have several differential diagnoses including other infective causes such as Listeria or Herpes, autoimmune causes such as Behçet’s disease and systemic lupus erythematosus (SLE), and paraneoplastic syndromes. Listeria is particularly important in this regard because it also tends to infect immunocompromised individuals and presents with ring-enhancing lesions involving the brainstem. MRI findings are not always conclusive, and CSF analysis may be required to establish the diagnosis in such cases. If ring enhancing lesions are not visible, diffuse brainstem gliomas may also be a possible differential diagnosis. 1H proton spectroscopy can be useful in such cases because it shows elevated choline at 3.2 ppm in the case of diffuse brainstem gliomas as compared to lipid peak at 1.3 ppm in case of tubercular aetiology.
Tuberculous encephalopathy
This typically occurs in young children with onset of seizures, altered sensorium, stupor, and coma without signs of meningitis. It is thought to be due to a type IV hypersensitivity reaction to tubercular protein. Pathologically, extensive white matter injury and perivascular demyelination is present in the brain parenchyma. On MRI, extensive cerebral oedema is found, with unilateral or bilateral extensive T2W/FLAIR hyperintensity [22]. Diffuse post-contrast enhancement of the involved white matter may be seen. It has a poor prognosis, with death usually occurring within one to two months of onset [18]. Acute disseminated encephalomyelitis (ADEM) is an important differential diagnosis in many cases.
Complications of central nervous system tuberculosis
-
Complications involving the ventricles:
hydrocephalus – communicating/non-communicating,
ventriculitis,
choroid plexitis.
-
Vascular complications:
arterial – vasculitis and infarcts,
venous – dural venous sinus thrombosis and venous infarcts.
Cranial neuropathies.
Hydrocephalus
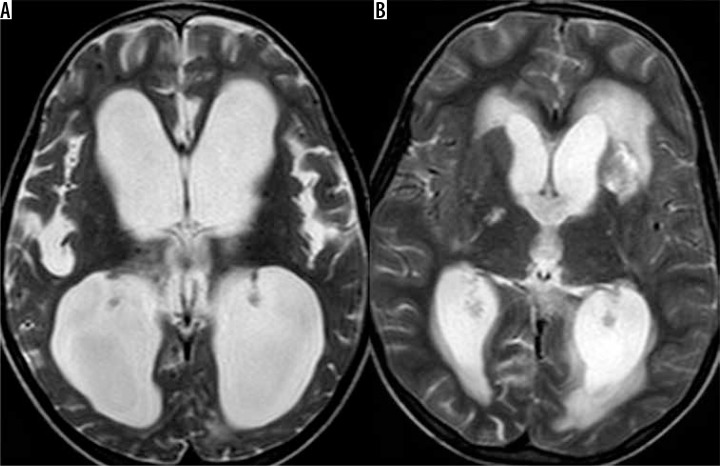
Hydrocephalus is the most common complication of CNS tuberculosis [23]. It can be either communicating or non-communicating in nature. Communicating hydrocephalus is more common and occurs due to obstruction to CSF flow in the basal cisterns by the inflammatory exudates (Figure 8). In later stages it can persist as sequelae secondary to post-inflammatory adhesions in the basal cisterns. Non-communicating hydrocephalus, although more commonly due to mass effect secondary to a tuberculoma or tubercular abscess, can also occur in cases complicated by ventriculitis and ependymitis, which may result in inflammatory exudates and post-inflammatory adhesions causing obstruction, usually at the level of aqueduct of Sylvius.
Figure 8.
Complications of tubercular meningitis. A (T2W axial) shows gross dilatation of the bilateral lateral ventricles indicating hydrocephalus. B (T2W axial) shows multiple infarcts in bilateral gangliocapsular regions
Ventriculitis
Rupture of a subependymal focus of infection into the ventricles or spread of infection into the ventricles through the communicating foramina in late stages of tubercular leptomeningitis results in ventriculitis [11]. Ventriculitis is visualised on MRI as heterogeneously increased signal intensity of the CSF on T1W scan as compared to normal CSF, with thickening and post-contrast enhancement of the ependymal lining. Often it is associated with hydrocephalus.
Choroid plexitis
Choroid plexitis is another rare complication often seen in association with ventriculitis and ependymitis, resulting from involvement of the choroid plexus in the inflammatory process. It is visualised on imaging as enlargement and prominent enhancement of the involved choroid plexus [11].
Vascular (arterial)
Vascular complications are also relatively common. Vasculitis and vascular occlusions are detected in 20-41% of the imaged cases of CNS TB. Tubercular infection shows a predilection to involve the small and medium sized vessels. It predominantly involves the lenticulostriate and thalamoperforating vessels and subsequently produces infarcts in these vascular territories involving the bilateral gangliothalamic regions, which have been referred to as the ‘medial tuberculosis zone’ (Figure 8) [24].
Vascular (venous)
Tubercular meningitis can also lead to dural venous sinus thrombosis and subsequent venous infarcts. This is, however, an unusual complication and requires a high index of suspicion for accurate diagnosis. DWI is of particular value in the detection of vascular complications such as infarcts [14]. MRA (magnetic resonance angiography) may also be used in selected cases in order to identify irregularity, beading, and segmental narrowing of medium sized arteries. Likewise, MRV (magnetic resonance venography) can be used in cases of suspected venous sinus thrombosis.
Cranial neuropathies
Cranial nerve involvement occurs in 17-40% of cases, and the patient may present with multiple cranial nerve palsies. Causes include ischaemia secondary to vasculitis or nerve entrapment by the exudates the basal cisterns. MRI shows thickening and T2W hyperintensity of the involved nerves, with enhancement of the proximal segments adjacent to the brainstem. Cranial nerves II, III, IV, and VII are most frequently involved in CNS tuberculosis. Furthermore, cranial nerve involvement has been found to be an important feature favouring tubercular meningitis over acute bacterial meningitis, in which it is relatively uncommon [15,16].
Differential MRI features of central nervous system tuberculosis from other lesions
Tubercular leptomeningitis vs. pyogenic/fungal leptomeningitis
Differentiation of tubercular meningitis from pyogenic or fungal meningitis may be radiologically difficult or even impossible using conventional MRI sequences, especially when the distribution of inflammation is atypical for tubercular meningitis. 1H proton spectroscopy may be useful in such cases because it shows lipid and lactate peak in the enhancing meninges in case of tubercular aetiology. On quantitative evaluation with MT-MRI, the percentage difference in mean signal intensity between the meninges and the adjacent brain parenchyma has been found to be significantly higher in tubercular meningitis as compared to pyogenic or fungal meningitis (20% vs. 10%) [9]. In addition, the magnetisation transfer ratio (MTR) from the meninges in tubercular meningitis (19.10 ± 1.02) has also been found to be significantly lower than in pyogenic meningitis and significantly higher than in viral meningitis [9,10].
Tubercular pachymeningitis vs. other causes of pachymeningitis
1H proton spectroscopy is again useful in such cases because it shows lipid and lactate peak in the enhancing dura in the case of tubercular aetiology.
Tuberculoma vs. other ring enhancing lesions
1H proton spectroscopy plays a major role in differentiating tuberculomas from other ring enhancing lesions, especially in atypical cases. A prominent lipid peak at 1.3 ppm is characteristic of tuberculomas [25]. Recent studies also show the presence of a guanidinoacetate peak at 3.8 ppm to be characteristic of tuberculomas [26]. Gupta et al. have also demonstrated that tuberculomas with heterogeneous signal intensity on T1W and T2W with heterogeneous post-contrast enhancement show a choline peak at 3.32 ppm in addition to the lipid peak at 1.3 ppm and suggested high cellularity in this variety of tuberculoma as a possible cause for the same [27]. Tuberculosis and neurocysticercosis (NCC) are close differentials in countries where both infections are endemic. The differences on MRI between the two are tabulated in Table 3 [28,29] (Figure 9).
Table 3.
MRI differences between tuberculoma and neurocysticercosis
| Tuberculoma | Neurocysticercosis |
|---|---|
| Lesions in the grey-white matter junction | Lesions in the sulcal subarachnoid spaces |
| T2 hypointense caseous granulomas | T2 hyperintense cyst unless calcified |
| No/incomplete suppression on FLAIR | Complete suppression on FLAIR |
| No scolex visualised | Eccentric T2 hypointense scolex |
| T1W hyperintense rim on MT MRI | No T1W hyperintense rim |
| Size may be > 2 cm | Size usually < 2 cm |
| Conglomerate ring enhancing lesions | Diffusely distributed, various stage cysts |
| Larger extent of perilesional oedema | Smaller extent of perilesional oedema |
Figure 9.
Neurocysticercosis. Magnetic resonance axial images showing multiple ring enhancing lesions with typical eccentric scolex
Tuberculoma vs. metastases
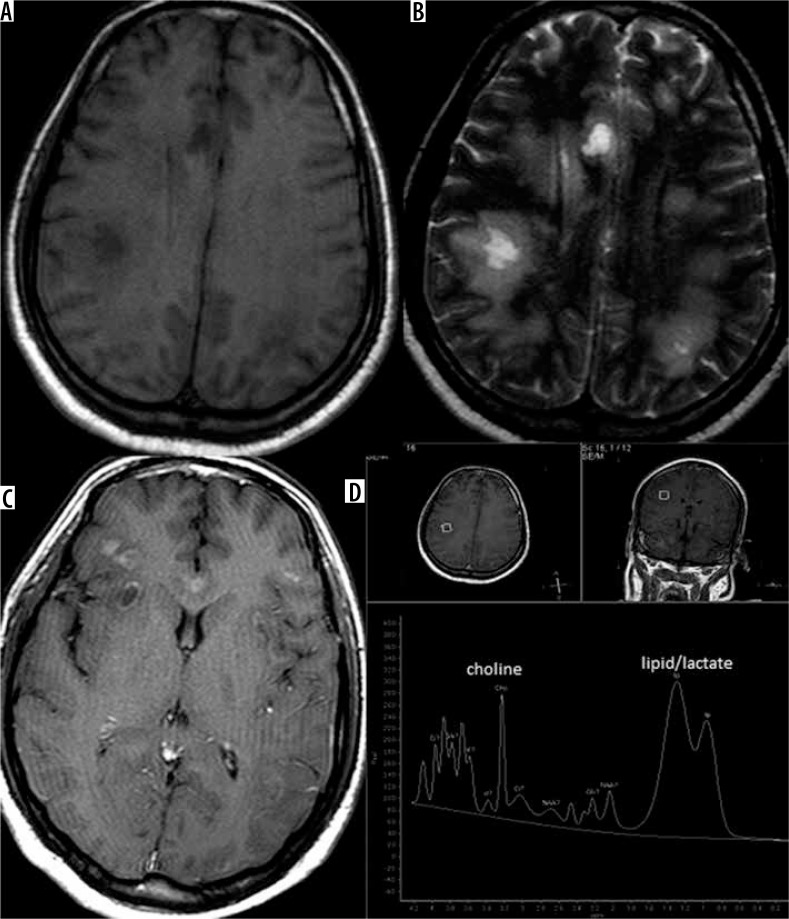
Both can be multiple. However, the extent of perilesional oedema is disproportionately high in metastases as compared to tuberculomas. Also, metastases are usually hyperintense on T2W in contrast to the T2W hypointense tuberculomas. 1H proton spectroscopy is also helpful because it shows choline peak at 3.2 ppm in metastases, while tuberculoma shows a lipid peak (Figure 10).
Figure 10.
Metastasis. Magnetic resonance axial images showing multiple ring enhancing lesions with perilesional oedema at grey-white matter junction with choline peak in addition to lipid/lactate peak on spectroscopy
Tubercular vs. pyogenic/fungal abscess
Tubercular abscess has a thicker wall than pyogenic abscess [30] Modified MRI techniques such as MR spectroscopy, DWI, and MT MRI play an important role in differentiating tubercular from pyogenic and fungal abscess. 1H proton spectroscopy shows lipid and lactate peak in the case of tubercular abscess, while it shows cytosolic amino acid peak in pyogenic abscess and shows trehalose peak in addition to amino acid peak in fungal abscess. DWI shows diffusion restriction of the contents in pyogenic and tubercular abscesses, while diffusion restriction of the wall and intracavitary projections rather than the intracavitary contents is characteristic of fungal abscess. Mean MTR of the wall of tubercular abscess (19.89 ± 1.55) is significantly lower than that of pyogenic abscess [31].
Conclusions
Intracranial tuberculosis is a single disease entity with “many faces” on imaging appearance and can hence produce a wide spectrum of patterns in the brain, including tubercular meningitis, tuberculoma, tubercular cerebritis, abscess, and encephalopathy. Furthermore, each of these patterns can have a wide variety of appearances and can mimic numerous other conditions, the common ones of which have been discussed. Careful evaluation of the MRI, appropriate use of modified techniques, and recent advances along with adequate clinico-radiological correlation can enable accurate and timely diagnosis by the radiologist and hence early institution of treatment. This is particularly important in view of the high incidence of permanent neurological sequelae in patients with delayed initiation of treatment.
Conflict of interest
The authors report no conflict of interest.
References
- 1.Torres C, Riascos R, Figueroa R, Gupta RK. Central nervous system tuberculosis. Top Magn Reson Imaging. 2014;23:173–189. doi: 10.1097/RMR.0000000000000023. [DOI] [PubMed] [Google Scholar]
- 2.Ogundipe T, Otolorin A, Ogundipe F, et al. Multidrug-resistant tuberculosis lymphadenitis as the initial presentation of secondary multidrug-resistant tuberculosis: a case report. Cureus. 2018;10:e2363. doi: 10.7759/cureus.2363. [DOI] [PMC free article] [PubMed] [Google Scholar]
- 3.Bernaerts A, Vanhoenacker FM, Parizel PM, et al. Tuberculosis of the central nervous system: overview of neuroradiological findings. Eur Radiol. 2003;13:1876–1890. doi: 10.1007/s00330-002-1608-7. [DOI] [PubMed] [Google Scholar]
- 4.Vidal JE, de Oliveira AC, Filho FB, et al. Tuberculous brain abscess in AIDS patients: report of three cases and literature review. Int J Infect Dis. 2005;9:201–207. doi: 10.1016/j.ijid.2004.06.010. [DOI] [PubMed] [Google Scholar]
- 5.Rock RB, Olin M, Baker CA, et al. Central nervous system tuberculosis: pathogenesis and clinical aspects. Clin Microbiol Rev. 2008;21:243–261. doi: 10.1128/CMR.00042-07. [DOI] [PMC free article] [PubMed] [Google Scholar]
- 6.Andronikou S, Wilmshurst J, Hatherill M, VanToorn R. Distribution of brain infarction in children with tuberculous meningitis and correlation with outcome score at 6 months. Pediatr Radiol. 2006;36:1289–1294. doi: 10.1007/s00247-006-0319-7. [DOI] [PubMed] [Google Scholar]
- 7.Bathla G, Khandelwal G, Maller VG, Gupta A. Manifestations of cerebral tuberculosis. Singapore Med J. 2011;52:124–131. [PubMed] [Google Scholar]
- 8.Burrill J, Williams CJ, Bain G, et al. Tuberculosis: a radiologic review. Radiographics. 2007;27:1255–1273. doi: 10.1148/rg.275065176. [DOI] [PubMed] [Google Scholar]
- 9.Kamra P, Azad R, Prasad KN, et al. Infectious meningitis: prospective evaluation with magnetization transfer MRI. Br J Radiol. 2004;77:387–394. doi: 10.1259/bjr/23641059. [DOI] [PubMed] [Google Scholar]
- 10.Gupta RK, Kathuria MK, Pradhan S. Magnetization transfer MR imaging in CNS tuberculosis. Am J Neuroradiol. 1999;20:867–875. [PMC free article] [PubMed] [Google Scholar]
- 11.Gupta RK, Kumar S. Central nervous system tuberculosis. Neuroimaging Clin N Am. 2011;21:795–814. doi: 10.1016/j.nic.2011.07.004. [DOI] [PubMed] [Google Scholar]
- 12.Goyal M, Sharma A, Mishra NK, et al. Imaging appearance of pachymeningeal tuberculosis. AJR Am J Roentgenol. 1997;169:1421–1424. doi: 10.2214/ajr.169.5.9353472. [DOI] [PubMed] [Google Scholar]
- 13.Krishnan N, Robertson BD, Thwaites G. The mechanisms and consequences of the extra-pulmonary dissemination of Mycobacterium tuberculosis. Tuberculosis. 2010;90:361–366. doi: 10.1016/j.tube.2010.08.005. [DOI] [PubMed] [Google Scholar]
- 14.Shukla R, Abbas A, Kumar P, et al. Evaluation of cerebral infarction in tuberculous meningitis by diffusion weighted imaging. J Infect. 2008;57:298–306. doi: 10.1016/j.jinf.2008.07.012. [DOI] [PubMed] [Google Scholar]
- 15.Arbeláez A, Medina E, Restrepo F, Castillo M. Cerebral tuberculosis. Semin Roentgenol. 2004;39:474–481. doi: 10.1016/j.ro.2004.06.003. [DOI] [PubMed] [Google Scholar]
- 16.Morgado C, Ruivo N. Imaging meningo-encephalic tuberculosis. Eur J Radiol. 2005;55:188–192. doi: 10.1016/j.ejrad.2005.04.017. [DOI] [PubMed] [Google Scholar]
- 17.Sanei Taheri M, Karimi MA, Haghighatkhah H, et al. Central nervous system tuberculosis: an imaging-focused review of a reemerging disease. Radiol Res Pract. 2015;2015:1–8. doi: 10.1155/2015/202806. [DOI] [PMC free article] [PubMed] [Google Scholar]
- 18.Patkar D, Narang J, Yanamandala R, et al. Central nervous system tuberculosis: pathophysiology and imaging findings. Neuroimaging Clin N Am. 2012;22:677–705. doi: 10.1016/j.nic.2012.05.006. [DOI] [PubMed] [Google Scholar]
- 19.Ku BD, Yoo S. Extensive meningeal and parenchymal calcified tuberculoma as long-term residual sequelae of tuberculous meningitis. Neurol India. 2009;57:521–522. doi: 10.4103/0028-3886.55593. [DOI] [PubMed] [Google Scholar]
- 20.Sahaiu-Srivastava S, Jones B. Brainstem tuberculoma in the immunocompetent: case report and literature review. Clin Neurol Neurosurg. 2008;110:302–304. doi: 10.1016/j.clineuro.2007.11.002. [DOI] [PubMed] [Google Scholar]
- 21.Campos LG, Trindade RAR, Faistauer Â, et al. Rhombencephalitis: pictorial essay. Radiologia Brasileira. 2016;49:329–336. doi: 10.1590/0100-3984.2015.0189. [DOI] [PMC free article] [PubMed] [Google Scholar]
- 22.Kim HJ, Shim KW, Lee MK, et al. Tuberculous encephalopathy without meningitis: pathology and brain MRI findings. Eur Neurol. 2011;65:156–159. doi: 10.1159/000324170. [DOI] [PubMed] [Google Scholar]
- 23.Ahluwalia VV, Sagar GD, Singh TP, et al. MRI spectrum of CNS tuberculosis. J Indian Acad Clin Med. 2013;14:83–90. [Google Scholar]
- 24.Shah GV. Central nervous system tuberculosis: imaging manifestations. Neuroimaging Clin N Am. 2000;10:355–374. [PubMed] [Google Scholar]
- 25.Seth R, Kalra V, Sharma U, Jagannathan N. Magnetic resonance spectroscopy in ring enhancing lesions. Indian Pediatrics. 2010;47:803–804. doi: 10.1007/s13312-010-0107-1. [DOI] [PubMed] [Google Scholar]
- 26.Morales H, Alfaro D, Martinot C, et al. MR spectroscopy of intracranial tuberculomas: A singlet peak at 3.8 ppm as potential marker to differentiate them from malignant tumors. Neuroradiol J. 2015;28:294–302. doi: 10.1177/1971400915592077. [DOI] [PMC free article] [PubMed] [Google Scholar]
- 27.Venkatesh SK, Gupta RK, Paul L, et al. Spectroscopic increase in signal is not a specific marker for differentiation of infective/inflammatory from neoplastic lesions of the brain. J Magn Reson Imaging. 2001;14:8–15. doi: 10.1002/jmri.1144. [DOI] [PubMed] [Google Scholar]
- 28.Verma R, Gupta R. Multiple ring-enhancing lesions: diagnostic dilemma between neurocysticercosis and tuberculoma. BMJ Case Rep. 2014;2014:bcr2013202528–8. doi: 10.1136/bcr-2013-202528. [DOI] [PMC free article] [PubMed] [Google Scholar]
- 29.Trivedi R, Saksena S, Gupta RK. Magnetic resonance imaging in central nervous system tuberculosis. Indian J Radiol Imaging. 2009;19:256–265. doi: 10.4103/0971-3026.57205. [DOI] [PMC free article] [PubMed] [Google Scholar]
- 30.Mohindra S, Savardekar A, Gupta R, et al. Tuberculous brain abscesses in immunocompetent patients: A decade long experience with nine patients. Neurol India. 2016;64:66–74. doi: 10.4103/0028-3886.173639. [DOI] [PubMed] [Google Scholar]
- 31.Luthra G, Parihar A, Nath K, et al. Comparative evaluation of fungal, tubercular, and pyogenic abscesses with conventional and diffusion MR imaging and proton MR spectroscopy. AJNR Am J Neuroradiol. 2007;28:1332–1338. doi: 10.3174/ajnr.A0548. [DOI] [PMC free article] [PubMed] [Google Scholar]


