Summary
The aim of this study was to establish a robust model of diabetic myocardial hypertrophy in Mus musculus castaneus mice. Mice were fed a high‐fat diet for four weeks and then given streptozotocin (STZ, 40 mg kg−1 d−1 for 5 days, intraperitoneally) and fasting blood glucose (FBG) levels were tested after seven days. Mice with FBG levels above 11.1 mmol/L were considered diabetic. Diabetic mice continued to have access to the high‐fat diet until cardiac hypertrophy developed. FBG and body weight (BW) were measured weekly. Myocardial hypertrophy was confirmed by left ventricle (LV) hypertrophy index (LVHI), LV/BW, LV histopathological observation and atrial natriuretic factor (ANF) mRNA expression. Serum insulin and plasma haemoglobin A1c (HbA1c) levels, total cholesterol (TCH) and triglyceride (TG) were measured, and then an insulin resistance index (HOMA.IR) was calculated. The level of FBG in the model group remained above 11.1 mmol/L, and the BW showed significant weight loss, compared with the control group (P < 0.01). The high levels of HbA1c, HOME.IR, TCH and TG, and the low level of insulin suggested that glucose metabolism was not balanced with insulin resistance; meanwhile, higher TCH and TG showed that dyslipidaemia had also developed. After the diabetic mice were kept on the high‐energy diet for another four weeks, histopathological observation showed myocardial injuries, much more surface area and collagen fibres, higher LVHI and LV/BW, and elevated expression of ANF mRNA (P < 0.01), suggesting that myocardial hypertrophy had appeared in Mus musculus castaneus mice under the current experimental conditions. Thus a robust model of diabetic myocardial hypertrophy was established four weeks after confirmation of diabetes, which was induced by feeding a high‐fat diet for four weeks combined with a repeated low‐dose STZ exposure, in Mus musculus castaneus mice.
Keywords: animal model, diabetic cardiomyopathy, Mus musculus castaneus mice, myocardial hypertrophy
1. INTRODUCTION
Diabetic cardiomyopathy (DCM) is a common cardiovascular complication of diabetes, which is independent of hypertension and coronary heart disease and is closely linked to a high incidence and high mortality of heart failure in diabetic patients. As a key structural change in DCM, left ventricular hypertrophy (LVH), along with myocardial remodelling, can be observed in the early stages of DCM, which will cause abnormal left ventricular filling and diastolic dysfunction.1 With compensatory hypertrophy of the heart, systolic function will eventually decrease in the late stages of DCM.2, 3 Therefore, it is indispensable that novel therapies are developed to retard the progression of diabetic myocardial hypertrophy (DCH). Animal models should be useful in dissecting the pathogenesis of the disease and for testing novel therapies. However, their utility in related studies has been constrained by the fact that most models have failed to replicate the key functional and structural features of advanced human DCM. Therefore, it is extremely important to establish a robust animal model that recapitulates human diabetic cardiac hypertrophy.
At present, there are four main animal models used in the study of diabetes and its complications. (a) A pancreatic resection animal model, in which all or most of the pancreas is removed from the experimental animal to produce permanent diabetes. When the surgery is performed by a skilled surgeon, this model is reliable for inducing hyperglycaemia in pigs,4 dogs5 and primates.6 However, this is a very invasive surgery for the animals, and it increases the chances of hypoglycaemia leading to pancreatic exocrine deficiency.7 (b) Spontaneous genetic animal models, such as BB rats, db rats and NOD mice, do not undergo any surgical procedure, and the symptoms occur under natural conditions.8, 9 However, the cost is high, and housing and breeding require special conditions. In addition, frequent genetic variations and large degree of individual differences also limit their practical applications. (c) Transgenic animal models, that is to say, the researchers control specific gene components of the experimental animal and their expression by means of experiments to create the unique diabetic genetic trait. This method is widely used in studies related to diabetes worldwide. Nevertheless, most transgenic animal models tend to make a single gene or multiple genes associated with abnormal glucose tolerance and insulin resistance and are not fully consistent with the physiological and pathogenesis processes of human diabetes. Additionally, the cost is high. (d) Chemical‐induced pathology in an animal model, which causes diabetes in the animal by the application of chemical substances. Alloxan and streptozotocin (STZ) are mainly used in chemical‐induced models. Systematic reviews have reported that alloxan is not completely specific to the islets and slightly overdosing the animals may cause general toxicity and the loss of many animals; therefore, it has rarely been used in recent years.10 As the most commonly used chemical inducer of experimental diabetes in rodents, STZ has a targeted toxicity to islet β cells.11 However, relatively little is known about the optimal dose and timing parameters for STZ administration; similarly, little is known about the development of diabetic myocardial hypertrophy in these treated mice. To simulate the pathophysiological process of clinical diabetic myocardial hypertrophy as much as possible, a simple, stable and reliable animal model is urgently needed. In this study, a scientific and practical model to develop diabetic myocardial hypertrophy in Mus musculus castaneus mice with a high‐fat diet combined with repeated low‐dose STZ intraperitoneal injection (i.p.) is characterized and will provide a basis for the further development of experimental studies on DCM.
2. MATERIALS AND METHODS
2.1. Chemicals and reagents
Streptozotocin (dissolved in 0.1 mmol/L citrate buffer, pH 4.5) was purchased from Sigma‐Aldrich (S0130‐1G; Santa Clara, CA, USA). Test kits for total cholesterol (TCH, F002), triglyceride (TG, F001), plasma haemoglobin A1c (HbA1c, A056‐2) and an ELISA kit for insulin (H203) were purchased from Jiancheng Bioengineering Institute (Jiangsu, China). Trizol (9108), reverse transcription kit (RR047A) and SYBR Premix Ex TaqTM II (RR820A) were purchased from Takara BIO Inc. (Liaoning, China). PCR primers were synthesized and purified by Takara BIO Inc. The remaining reagents were analytical grade.
2.2. Ethical approval
All protocols associated with this experiment were approved by the Institutional Animal Care and Use Committee ofChongqing Medical University. The experiment was carried out in accordance with the National Institutes of Health Guide for the Care and Use of Laboratory Animals.
2.3. Animal model
Male Mus musculus castaneus mice (weight 15‐18 g, aged 4‐6 weeks) were purchased from the Animal Laboratory Center of Chongqing Medical University [Chongqing, China, Animal qualified certificate: SYXK (Chongqing) 2012‐0001]. All animals were housed in a temperature‐controlled room (25 ± 2°C) with a 12‐hours light/dark cycle and were given free access to standard laboratory mice chow and water.
Some mice were fed a high‐fat diet (containing 10% sucrose, 10% yolk, 10% axungia, 1.5% cholesterol, 0.5% bile salt and 68% basic forage), which was produced by Shengmin Scientific Research Animal Breeding Center (2016GT‐102; Jiangsu, China). After 4 weeks, STZ (40 mg kg−1 d−1 for 5 days, i.p.) was administered to the mice. Fasting blood glucose (FBG) levels were tested with a One Touch Glucometer (Johnson & Johnson, New Brunswick, New Jersey, USA) after 7 days (at the end of the 6th week). Mice with FBG levels above 11.1 mmol/L were considered diabetic. Diabetic mice continued to have access to the high‐fat diet until cardiac hypertrophy developed, after approximately an additional 4 weeks; this was the diabetic cardiac hypertrophy model group (DMH, n = 15). The normal control group (NC, n = 15) consisted of mice fed a commercial rodent diet, and the high‐fat diet control group (HFD, n = 15) consisted of mice fed a high‐fat diet. The mice in the NC and HFD groups received vehicle injections instead of STZ (Figure 1).
Figure 1.
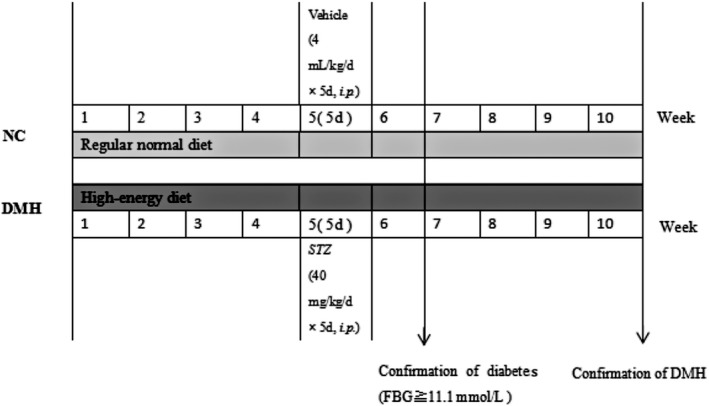
Schematic diagram of the experimental protocol. The mice were fed a high‐fat diet for 4 weeks and then given streptozotocin (STZ, 40 mg kg−1 d−1 for 5 days, i.p.) and fasting blood glucose (FBG) levels were tested after 7 days (at the end of the 6th week). Mice with FBG levels above 11.1 mmol/L were considered diabetic. Diabetic mice continued on the high‐fat diet for another 4 weeks (from the 7th week to the 10th week) until they developed cardiac hypertrophy, which was the diabetic cardiac hypertrophy model group (DMH). The normal control group (NC) consisted of mice fed a commercial rodent diet, and the high‐fat diet control group (HFD) consisted of mice fed a high‐fat diet. The mice in the NC and HFD groups received vehicle injections instead of STZ
Fasting blood glucose and body weight (BW) were measured weekly. At the 4th week after the onset of the diabetic model, blood was collected through a retro‐orbital procedure after anaesthesia. Then, the heart was separated into the left ventricle (LV) and the right ventricle with septum (RV+S) and weighed quickly. Finally, the left ventricular hypertrophy index (LVHI = LV/RV+S) and LV/BW were calculated. Left ventricular tissue was snap frozen and kept at −80°C for extracting total RNA.
2.4. Biochemical analysis
At the end of the experiment, blood was collected from the retro‐orbital venous plexus, clotted at room temperature for 30 minutes, centrifuged at 3000×g for 20 minutes and stored at −80°C. According to the instructions, the optical density (OD) value at 490 nm for TCH and TG (in serum), 530 nm for HbA1c (in erythrocytes) or 450 nm for insulin by a microplate reader (Bio‐Tek ELX800, Winooski, Vermont, USA) was detected, and then, the contents were calculated (HbA1c expressed as per 10 g of haemoglobin). Additionally, the insulin resistance index (HOME.IR) was calculated according to the formula HOME.IR = (FBG × insulin)/22.5.
2.5. Left ventricular pathological examination
2.5.1. Light microscopy: haematoxylin and eosin (H&E) and Masson staining
The left ventricular tissue was fixed in 4% paraformaldehyde in a centrifuge tube for 6 hours and preserved in 70% ethanol. Fixed tissue was dehydrated with a graded series of ethanol to propylene oxide and embedded in paraffin, and then 3‐ to 5‐μm‐thick sections of paraffin‐embedded tissue were stained with H&E and Masson. The histopathological changes were examined under light microscopy. Individual cell surface area (five random fields from every sample were averaged) and percentage of collagen tissue (CVF = collagen area/total area) were measured with Image‐ProPlus 6.0 professional image analysis software. The results of six independent samples were used for statistical analysis.
2.5.2. Transmission electron microscopy
Left ventricular tissue was cut into 1‐mm3 pieces and then fixed with 2.5% cold glutaraldehyde solution (pH 7.4) in a centrifuge tube. They were rinsed and postfixed with 1% osmium tetroxide in 0.1 mol/L PBS for 2 hours at room temperature, dehydrated through a graded series of ethanol to propylene oxide and embedded in epoxy resin. 600‐Å sections were made and observed under the transmission electron microscope.
2.6. The mRNA expression of atrial natriuretic factor (ANF)
According to the manufacturer's instructions, total RNA was extracted from left ventricular homogenates using the Trizol reagent, quantified by ultraviolet spectrometric detection (Eppendorf, Germany) and reverse transcribed into cDNA using a PrimeScript™ RT reagent kit. The primers were designed according to the gene sequence of mice in GenBank (ANF: forward: 5′‐GCA AAC ATC AGA TCG TGC CC‐3′ and reverse: 5′‐CAC CGC ACT GTA CAC AGG AT‐3′, 122 bp; β‐actin: forward: 5′‐CCA CCA TGT ACC CAG GCA TT‐3′ and reverse: 5′‐AGG GTG TAA AAC GCA GCT CA‐3′, 101 bp). The reaction parameters were as follows: 95°C for 30 seconds; 95°C for 5 seconds, 60°C for 30 seconds; 40 cycles. The amount of ANF mRNA relative to the internal control gene, β‐actin, was calculated using the ∆Ct (Ct = cycle threshold) method as follows: the relative expression = 2−∆Ct, ∆Ct = Ct (target gene) − Ct (β‐actin). The results of three independent experiments were used for statistical analysis.
2.7. Statistical analysis
The results were presented as the mean ± standard deviation (SD). Differences between the groups were analysed by one‐way ANOVA or SNK‐q test using SPSS statistical package (version 17.0). P values <0.05 were considered statistically significant.
3. RESULTS
3.1. General health of the experimental mice
Mice in the NC and HFD groups were in good health condition with a normal appetite, water intake and urine output during the experiment. In contrast, the behaviour of the mice in the DMH group gradually became sluggish and they had dark, dull hair. The food and water intake and urine output were significantly higher than the NC and HFD groups. Two mice died in the DMH group, one mouse on day 7 after the administration of STZ (i.e., week 6) and one during week 9. Over the final 4 weeks, all but one diabetic mouse developed myocardial hypertrophy, which was confirmed by histopathological observation and ANF mRNA expression. Therefore, in this model, the success rate was 80%, and the mortality rate was 13%.
There was no significant difference in BW among groups at the beginning of the experiment. BW increased in the NC and HFD groups in a time‐dependent manner by 64.12% and 60.47%, respectively, by the end of the experiment (P < 0.01). The weight of the mice in the DMH group also increased gradually until the 4th week; then, from week 5 (after five consecutive days of STZ administration), the BW remained unchanged until the end of the experiment (week 10; P > 0.05). Compared with the corresponding HFD or NC groups, the DMH group weighed significantly less, by 22.96% and 15.97% respectively (P < 0.01; Figure 2).
Figure 2.
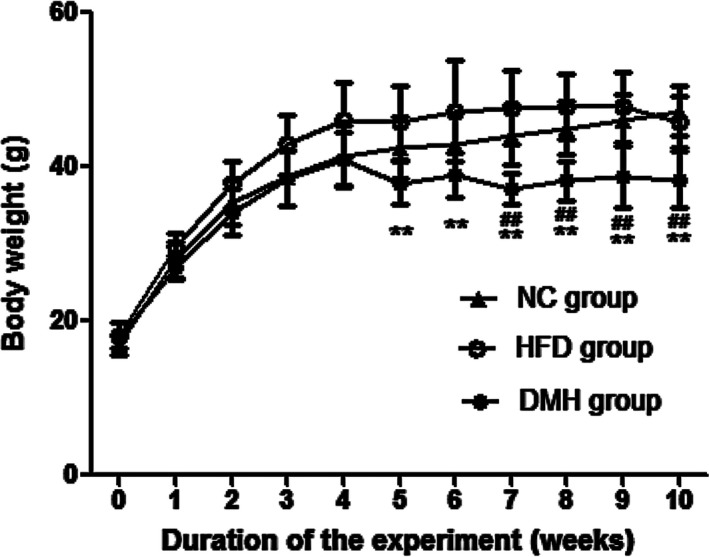
Changes in body weight during the experiment. DMH, diabetic myocardial hypertrophy model; HFD, high‐fat diet control; NC, normal control. Mean ± SD, nNC = 15, nHFD = 15, nDMH = 12. ## P < 0.01 vs NC group; **P < 0.01 vs HFD group
3.2. Establishment of diabetic model
After 7 days of treatment with STZ, the FBG level of mice in the DMH significantly increased to 20.51 ± 1.99 mmol/L and remained at this level until the end of the experiment (P < 0.01), suggesting a diabetic model was established and remained stable. The levels of FBG in the NC group (6.89 ± 0.96 mmol/L) and the HFD group (7.81 ± 1.45 mmol/L) remained stable from week 5 to week 10 (P > 0.05; Figure 3).
Figure 3.
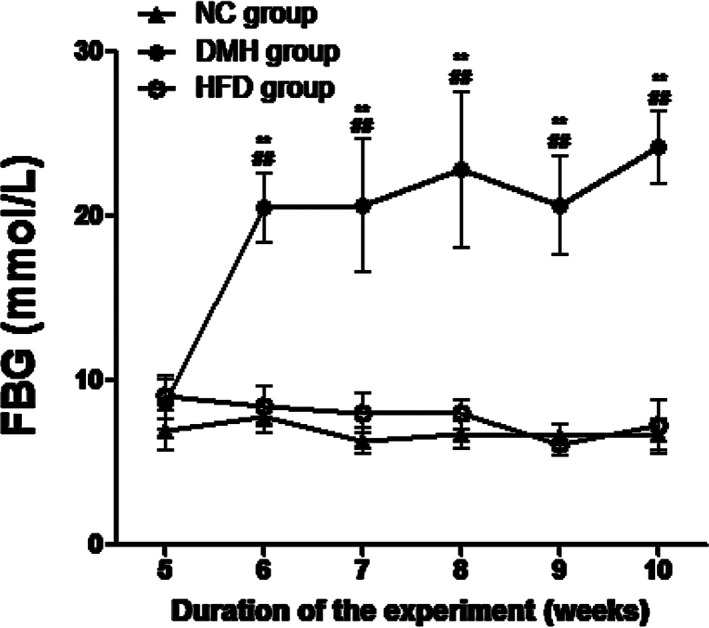
Fasting blood glucose (FBG) levels in the experimental groups. DMH, diabetic myocardial hypertrophy model; HFD, high‐fat diet control; NC, normal control. FBG was measured weekly from week 5 until the end of the experiment. Mean ± SD, nNC = 15, nHFD = 15, nDMH = 12. ## P < 0.01 vs NC group; **P < 0.01 vs HFD group
The levels of TCH and TG increased significantly in both HFD and DMH mice (P < 0.01), but they increased the most in the DMH group (P < 0.01). Meanwhile, in the DMH group, the HOME.IR and HbA1c also increased (P < 0.05), but the level of insulin decreased (P < 0.01; Table 1).
Table 1.
Levels of serum lipid and diabetes‐related parameters in mice (mean ± SD)
| Group | n | TCH (mmol/L) | TG (mmol/L) | Insulin (μIU/mL) | HOME.IR | HbA1c (/10 g Hb) |
|---|---|---|---|---|---|---|
| NC | 15 | 2.63 ± 0.53 | 0.42 ± 0.19 | 81.18 ± 6.70 | 23.31 ± 3.29 | 25.47 ± 4.36 |
| HFD | 15 | 4.30 ± 0.36## | 0.70 ± 0.09## | 85.27 ± 6.78 | 28.39 ± 3.18 | 31.96 ± 3.64 |
| DMH | 12 | 8.13 ± 0.70##,** | 1.25 ± 0.23##,** | 54.93 ± 8.16##,** | 59.61 ± 8.70##,** | 54.81 ± 5.35##,* |
DMH, diabetic myocardial hypertrophy model; HbAlc, haemoglobin A1c; HFD, high‐fat diet control; HOME.IR, HOME insulin resistance index; NC, normal control; TCH, total cholesterol; TG, triglyceride. Mean ± SD. # P < 0.05; ## P < 0.01 vs NC group; *P < 0.05; **P < 0.01 vs HFD group.
3.3. Evaluation of cardiac hypertrophy in diabetic mice
After 4 weeks of establishing diabetes, the levels of LVHI, LV/BW and mRNA expression of ANF in the DMH group were significantly higher than expression levels in the NC group and the HFD group (P < 0.01; Figures 4, 5).
Figure 4.
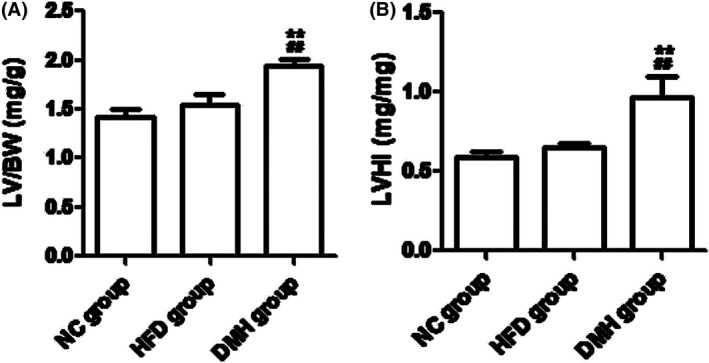
Evaluation of myocardial hypertrophy in diabetic mice. DMH, diabetic myocardial hypertrophy model; HFD, high‐fat diet control; NC, normal control; LV/BW, left ventricular weight/body weight; LVHI, left ventricular weight/right ventricle and septum weight. Mean ± SD, nNC = 15, nHFD = 15, nDMH = 12. ## P < 0.01 vs NC group; **P < 0.01 vs HFD group
Figure 5.
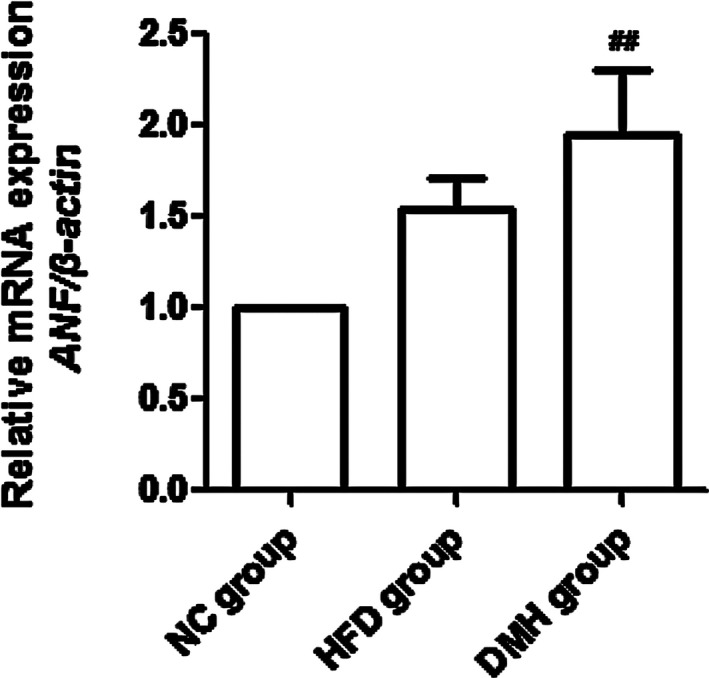
Relative mRNA expression of atrial natriuretic factor (ANF) in diabetic mice. DMH, diabetic myocardial hypertrophy model; HFD, high‐fat diet control; NC, normal control. Mean ± SD, n = 3. ## P < 0.01 vs NC group
3.4. Pathological changes in the left ventricle
According to the H&E staining, muscle fibres were disordered, myocardial cells became hypertrophic and disorganized, and focal fibrosis appeared. The cell surface area in the DMH group was significantly higher, by 39.67% and 30.67%, compared with that in the NC group and HFD group respectively (P < 0.01; Figure 6). Masson staining showed that the area of blue dye collagen fibres in the DMH group was significantly higher, by 56.99% and 43.61%, compared with that in the NC group and HFD group respectively (P < 0.01; Figure 7).
Figure 6.
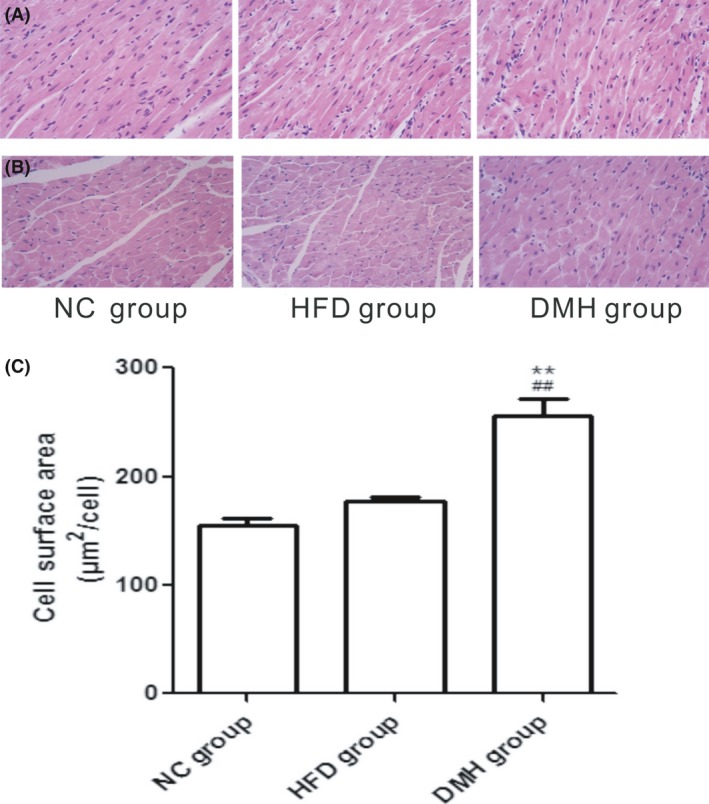
Longitudinal section (A) and transverse section (B) of left ventricular tissue stained with haematoxylin and eosin (scale bar: 100 μm, original magnification ×400). C, cell surface area of the left ventricle in each experimental group. DMH, diabetic myocardial hypertrophy model; HFD, high‐fat diet control; NC, normal control. Mean ± SD, n = 6. ## P < 0.01 vs NC group; **P < 0.01 vs HFD group [Colour figure can be viewed at wileyonlinelibrary.com]
Figure 7.
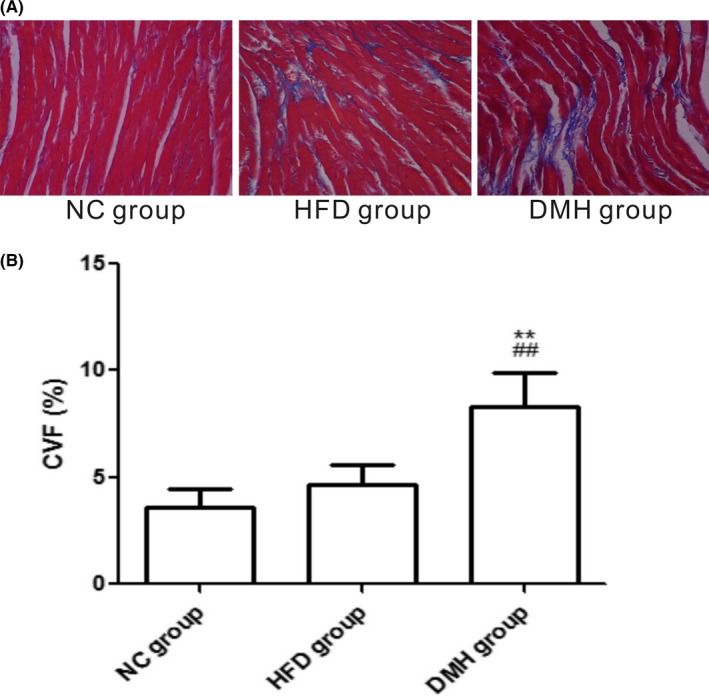
Interstitial fibrosis of the left ventricles by Masson staining (A), the collagen fibres are stained blue (scale bar: 100 μm, original magnification ×400), and collagen volume fraction of the left ventricles in experimental groups (B). CVF, collagen volume fraction; DMH, diabetic myocardial hypertrophy model; HFD, high‐fat diet control; NC, normal control. Mean ± SD, n = 6. ## P < 0.01 vs NC group; **P < 0.01 vs HFD group [Colour figure can be viewed at wileyonlinelibrary.com]
As demonstrated in the transmission electron microscopy analyses, the cardiac myofibrils were arranged in an orderly fashion and composed of regular and continuous sarcomeres and normal mitochondria which were distributed longitudinally across myofibrils in the NC group and HFD group. In contrast, LV tissue in the DMH group showed myocardial injuries such as disruption of the intercalated disc, irregular pattern of cross‐striation, enlarged and misaligned nuclei, and aggregation of mitochondria (Figure 8).
Figure 8.
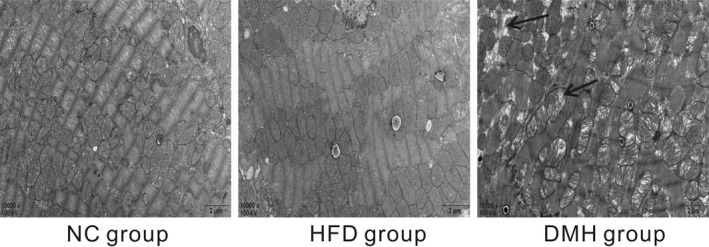
Transmission electron microscopy images of the left ventricle (scale bar: 2 μm, original magnification ×10 000). The black arrows in the figure indicate myofibrillar lysis and mitochondrial swelling. Examination of the photographs reveals orderly myofibrils, regular sarcomeres and normal mitochondria in the normal control (NC group) and in the high‐fat‐diet control (HFD group) but myofibrillar lysis, sarcomere deformation, mitochondrial hypertrophy and disorder in the diabetic myocardial hypertrophy model (DMH group)
4. DISCUSSION
The worldwide prevalence of diabetes mellitus and its complications is on the rise, and the number of patients will reach 366 million by 2030 according to the World Health Organization.12 As one of the complications of high mortality caused by diabetes, DCM is receiving increasing attention. Cardiac hypertrophy is an important pathological process in DCM, which has a high correlation with the growing incidence of heart failure and sudden death in diabetic patients.13 For a comprehensive study in DMH it is essential to have a reliable and convenient animal model. STZ, the most widely used chemical to induce diabetes,14, 15, 16, 17 selectively damages pancreatic cells, causes cell necrosis and results in reduced blood insulin and elevated blood sugar.18 However, systematic research on the development and examination of cardiac hypertrophy after diabetes onset is scarce. Therefore, the present study intended to explore an efficient, economic and easy approach to establish a DMH model and mimic the pathological progress that occurs in diabetic patients.
Studies have found that 90% of rodent genomes are identical to the human genome and can be gene‐driven and phenotype‐driven. Among them, the mouse is similar to humans from the anatomical, physiological and biochemical levels, which is the main reason mice are widely used in diabetic model systems.19 Many animal strains have been used to establish diabetes and the complications being induced by STZ. C57BL/6J mice are the most commonly used. Interestingly, Mus musculus castaneus mice have the same rate and stability in the establishment of a diabetic model,20 but they are less expensive than C57BL/6J mice. Earl et al21 found that Mus musculus castaneus mice were superior for in‐depth immunological studies.
In this study, long‐term high‐energy feeding combined with STZ at 40 mg kg−1 d−1 for 5 days resulted in diabetes‐related changes in Mus musculus castaneus mice. For example, compared with the NC group, even though the mice in the HFD group reached a stable BW quickly, their BW showed no significant difference during the whole experiment, whereas the model group showed significant weight loss after STZ administration. In addition, the FBG was above 11.1 mmol/L, which suggested that diabetes was established. As we examined the mice in the cages while determining the amount of remaining feed and the degree of moisture in the litter, the symptoms of diabetes, such as polydipsia, polyuria, polyphagia, weight loss, poor mental status and dull hair, became increasing apparent. At the end of the experiment, the high levels of HbAlc, HOME.IR and the low level of insulin suggested that glucose metabolism was not balanced, with insulin resistance; meanwhile, higher TCH and TG showed that dyslipidaemia had also developed. It was noteworthy that diabetes was not found in mice as a consequence of giving a high‐fat diet alone using the same experimental conditions, although both TCH and TC increased significantly, which was consistent with the studies by Brainard et al.22
DMH has been associated with several features, such as increases in heart volume, myocardial protein and cell diameter, as well as significant ultrastructural changes in myocardial tissue and the expression of foetal genes, such as ANF mRNA.23 It has been reported that cardiac function changes in STZ‐induced diabetic rats from 6 to 14 weeks and myocardial cell ultrastructure changes from 8 to 12 weeks after giving STZ.24 Barrière et al25 successfully simulated human type 2DM by offering a high‐fat/high‐fructose diet and low‐dose STZ to rats and simply determined the formation of DCM at week 56. However, no report has been found for a mouse model of diabetic cardiac hypertrophy, especially in Mus musculus castaneus mice.
In this study, after the diabetic mice were kept on the high‐energy diet for another 4 weeks after the STZ administration, histopathological observation showed myocardial injuries, much more surface area and collagen fibres, higher LVHI and LV/BW, and elevated expression of ANF mRNA. These results strongly suggested that the diabetic myocardial hypertrophy model was successfully established in Mus musculus castaneus mice under the current experimental conditions, which had similar characteristics to those that are found in humans. 80% of the mice developed diabetic cardiac hypertrophy, and 13% died during the experiment (which lasted ~10 weeks).
In conclusion, a diabetic model was established by feeding a high‐fat diet for 4 weeks combined with a repeated low‐dose STZ exposure. Next, a myocardial hypertrophy model was confirmed after another 4 weeks in Mus musculus castaneus mice. Thus the present study provides a reliable, low‐cost, easy‐to‐use in vivo model for future studies on diabetic cardiac hypertrophy and should be widely applied.
ACKNOWLEDGEMENTS
All the authors have made a significant contribution to this manuscript, have seen and approved the final manuscript, and declared no competing financial interest.
CONFLICT OF INTEREST
The authors declare no competing financial interest.
FUNDING SOURCE
This work was supported by the Opening Foundation of Key Laboratory of Basic Pharmacology of Ministry of Education, Zunyi Medical University, Guizhou, China (No. JCYL‐K‐007) and the Natural Science Foundation of Chongqing, China (No. cstc2017jcjAX0211), and the Guizhou Traditional Chinese Medicine Administration Bureau, Guizhou, China (No. QZYY‐2016‐004), and the National Natural Science Foundation of China (No. 81471334 and 81871002).
Zhang J, Qiu H, Huang J, et al. Establishment of a diabetic myocardial hypertrophy model in Mus musculus castaneus mouse. Int J Exp Path. 2018;99:295–303. 10.1111/iep.12296
REFERENCES
- 1. Huynh K, Bernardo BC, McMullen JR, Ritchie RH. Diabetic cardiomyopathy: mechanism and new treatment strategies targeting antioxidant signaling pathways. Pharmacol Ther. 2014;142:375‐415. [DOI] [PubMed] [Google Scholar]
- 2. Lacombe VA, Viatchenko‐Karpinski S, Terentyev D, et al. Mechanisms of impaired calcium handling underlying subclinical diastolic dysfunction in diabetes. Am J Physiol Regul Integr Comp Physiol. 2007;293:1787‐1797. [DOI] [PMC free article] [PubMed] [Google Scholar]
- 3. Schilling JD, Mann DL. Diabetic cardiomyopathy: bench to bedside. Heart Fail Clin. 2012;8:619‐631. [DOI] [PMC free article] [PubMed] [Google Scholar]
- 4. Mellert J, Hering BJ, Liu X, et al. Successful islet auto‐ and allotransplantation in diabetic pigs. Transplantation. 1998;66:200‐204. [DOI] [PubMed] [Google Scholar]
- 5. Fisher SJ, Shi ZQ, Lickley HL, Efendic S, Vranic M, Giacca A. Low‐dose IGF‐I has no selective advantage over insulin in regulating glucose metabolism in hyperglycemic depancreatized dogs. J Endocrinol. 2001;168:49‐58. [DOI] [PubMed] [Google Scholar]
- 6. He S, Chen Y, Wei L, et al. Treatment and risk factor analysis of hypoglycemia in diabetic rhesus monkeys. Exp Biol Med (Maywood). 2011;236:212‐218. [DOI] [PubMed] [Google Scholar]
- 7. Herrath MG, Filippi C, Coppieters K. How viral infections enhance or prevent type 1 diabetes‐from mouse to man. J Med Virol. 2011;83:1672. [DOI] [PubMed] [Google Scholar]
- 8. Rabinovitch A, Suarezpikzon W, Shelkh A. Cytokine gene expression in pancreatic isletinfiltrating leukocytes of BB rats. Diabetes. 1996;45:749‐754. [DOI] [PubMed] [Google Scholar]
- 9. Tremblen S, Penna G, Bosi E, Mortara A, Gately MK, Adorini L. Interleuk in‐12 administration induce Thelper type 1 cells and accelerates auto immune diabetes in NOD mice. J Exp Med. 1995;181:817‐821. [DOI] [PMC free article] [PubMed] [Google Scholar]
- 10. Mostafavinia A, Amini A, Ghorishi SK, Pouriran R, Bayat M. The effects of dosage and the routes of administrations of streptozotocin and alloxan on induction rate of type1 diabetes mellitus and mortality rate in rats. Lab Anim Res. 2016;32:160‐165. [DOI] [PMC free article] [PubMed] [Google Scholar]
- 11. Furman BL. Streptozotocin‐induced diabetic models in mice and rats. Curr Protoc Pharmacol. 2015;70(5):pp. 47.1‐5.47.20. [DOI] [PubMed] [Google Scholar]
- 12. Wild S, Roglic G, Green A, Sicree R, King H. Global prevalence of diabetes: estimates for the year 2000 and projections for 2030. Diabetes Care. 2004;27:1047‐1053. [DOI] [PubMed] [Google Scholar]
- 13. Fuentes‐Antrás J, Picatoste B, Gómez‐Hernández A, Egido J, Tuñón J, Lorenzo Ó. Updating experimental models of diabetic cardiomyopathy. J Diabetes Res. 2015;2015:1‐15. [DOI] [PMC free article] [PubMed] [Google Scholar]
- 14. Liu P, Su J, Song X, Wang S. Activation of nuclear β‐catenin/c‐Myc axis promotes oxidative stress injury in streptozotocin‐induced diabetic cardiomyopathy. Biochem Biophys Res Commun. 2017;493:1573‐1580. [DOI] [PubMed] [Google Scholar]
- 15. Yang L, Peng C, Xia J, et al. Effects of icariside II ameliorates diabetic cardiomyopathy in streptozotocin‐induced diabetic rats by activating Akt/NOS/NF‐κB signaling. Mol Med‐Rep. 2017;17:4099‐4105. [DOI] [PubMed] [Google Scholar]
- 16. Kawamura M, Paulsen MJ, Goldstone AB, et al. Tissue‐engineered smooth muscle cell and endothelial progenitor cell bi‐level cell sheets prevent progression of cardiac dysfunction, microvascular dysfunction, and interstitial fibrosis in a rodent model of type 1 diabetes‐induced cardiomyopathy. Cardiovasc Diabetol. 2017;16:142. [DOI] [PMC free article] [PubMed] [Google Scholar]
- 17. Yu LY, Shi WL, Guo XG. Cardio‐Protective role of Gingerol along with prominent anti‐diabetic cardiomyopathy action in a streptozotocin‐induced diabetes mellitus rat model. Cell J. 2017;19:469‐475. [DOI] [PMC free article] [PubMed] [Google Scholar]
- 18. Graham ML, Janecek JL, Kittredge JA, Hering BJ, Schuurman HJ. The streptozotocin‐induced diabetic nude mouse model: differences between animals from different sources. Comp Med. 2011;61:356‐360. [PMC free article] [PubMed] [Google Scholar]
- 19. Kern TS, Tang J, Berkowitz BA. Validation of structural and functional lesions of diabetic retinopathy in mice. Mol Vis. 2010;16:2121‐2131. [PMC free article] [PubMed] [Google Scholar]
- 20. Zheng GY, Zhang JB. Comparison of streptozotocin‐induced C57B1/6J and Kunming mouse type 1 diabetes model. Chin J Biochem Pharm. 2016;1:20‐22. [Google Scholar]
- 21. Earl PL, Americo JL, Cotter CA, Moss B. Comparative live bioluminescence imaging of monkeypox virus dissemination in a wild‐derived inbred mouse (Mus musculus castaneus) and outbred African dormouse (Graphiurus kelleni). Virology. 2015;15:150‐158. [DOI] [PMC free article] [PubMed] [Google Scholar]
- 22. Brainard RE, Watson LJ, Demartino AM, et al. High fat feeding in mice is insufficient to induce cardiac dysfunction and does not exacerbate heart failure. PLoS ONE. 2013;8:e83174. [DOI] [PMC free article] [PubMed] [Google Scholar]
- 23. Nayor M, Enserro DM, Xanthakis V, et al. Comorbidities and cardiometabolic disease: relationship with longitudinal changes in diastolic function. JACC Heart Fail. 2018;S2213–1779:30050‐30057. [DOI] [PMC free article] [PubMed] [Google Scholar]
- 24. Fein FS, Komstein LB, Strobecket JE, Capasso JM, Sonnenblick EH. Alterd myocardial mechanics in diabetic rats. Circ Res. 1980;47:922‐923. [DOI] [PubMed] [Google Scholar]
- 25. Barrière DA, Noll C, Roussy G, et al. Combination of high‐fat/high‐fructose diet and low‐dose streptozotocin to model long‐term type‐2 diabetes complications. Sci Rep. 2018;8:424. [DOI] [PMC free article] [PubMed] [Google Scholar]


