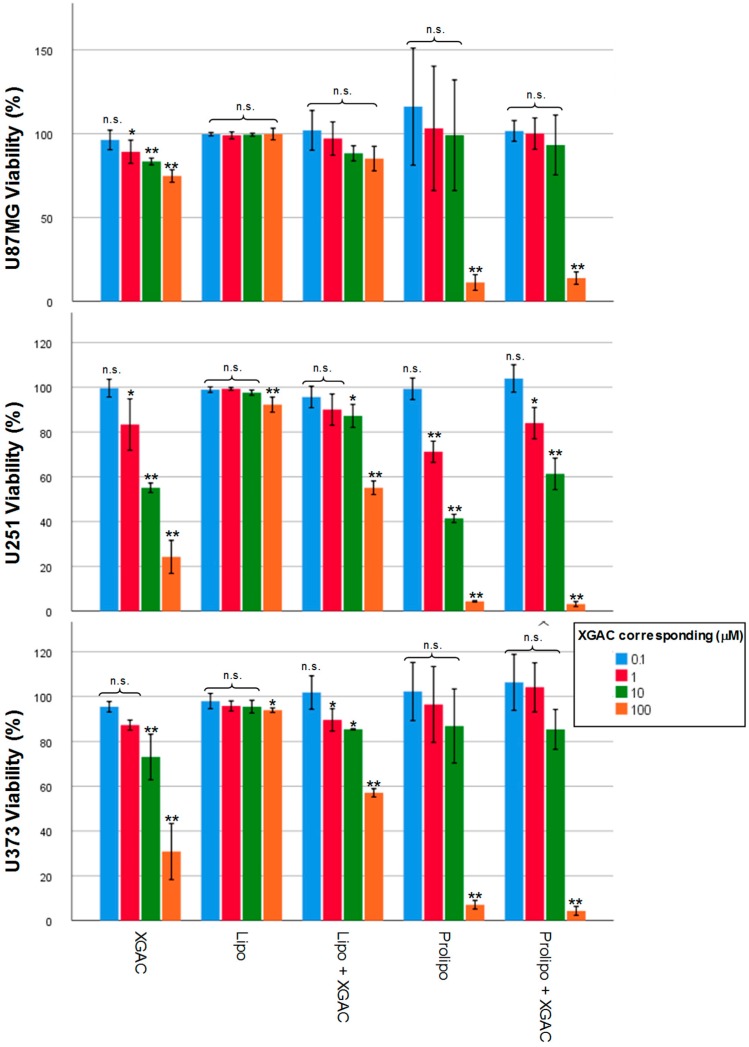
Figure 5.
U87MG (A), U251 (B), U373 (C) glioma cell lines using xanthone 2 (XGAC), liposomes without and with xanthone 2, proliposomes without and with xanthone 2 at different concentrations 0.1, 1, 10 and 100 μM, as determined by MTT. Data are presented as the mean ± standard deviation (SD); n = 3; n.s.—not significant; * p < 0.05; ** p < 0.01.

