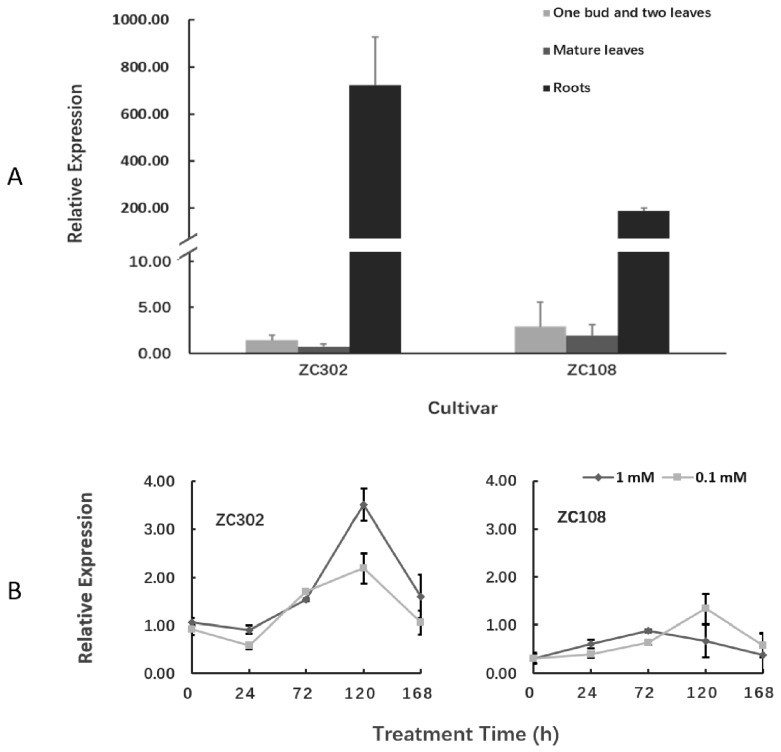
Figure 6.
Expression of CsAlaDC in tea plants. (A) Expression of CsAlaDC in several tissues of tea cultivars. (B) Nitrogen treatment effect on the expression levels of CsAlaDC in the roots of tea plants. The reported concentrations (1 mM and 0.1 mM) refer to the level of NH4NO3 treatment for tea seedlings. The relative expressions of the gene were quantified using qRT-PCR and normalized to GAPDH. Error bars indicate the standard errors over three biological replicates.

