Abstract
Epidemiological investigation is an important approach to assessing the risk of late effects after radiotherapy, and organ dosimetry is a crucial part of such analysis. Computed tomography (CT) images, if available, can be a valuable resource for individualizing the dosimetry, because they describe the specific anatomy of the patient. However, CT images acquired for radiation treatment planning purposes cover only a portion of the body near the target volume, whereas for epidemiology, the interest lies in the more distant normal tissues, which may be located outside the scan range. To address this challenge, we developed a novel method, called the Anatomically Predictive Extension (APE), to extend a partial-body CT image stack using images of a computational human phantom matched to the patient based on their height and weight. To test our method, we created five APE phantoms from chest and abdominal images extracted from the chest-abdomen-pelvis (CAP) CT scans of five patients. Organ doses were calculated for simple chest and prostate irradiations that were planned on the reference computational phantom (assumed patient geometry if no CT images are available), APE phantoms (patient-phantom hybrid given a partial-body patient CT) and full patient CAP CT scans (ground truth). The APE phantoms and patient CAP CT scans resulted in nearly identical dosimetry for those organs that were fully included in the partial-body CT used to construct the APE. The calculated doses to these same organs in the reference phantoms differed by up to 20% and 52% for the chest and prostate cases, respectively. For organs outside the scan coverage, the reference phantom showed, on average, dose differences of 31% (chest case) and 41% (prostate case). For the APE phantoms, these values were 26% (chest) and 17% (prostate). The APE method combines patient and phantom images to improve organ dosimetry both inside and outside the scan range. We intend to use the APE method for estimating dose for organs peripheral to the treatment fields; however, this method is quite generalizable with many potential applications.
INTRODUCTION
Advances in radiological imaging combined with modern radiotherapy technologies have made it possible to deliver radiation precisely to the intended target. Nevertheless, even with the most careful treatment planning, nearby normal tissues will receive some radiation dose. As cancer survival rates improve, it becomes increasingly important to consider the impact this unintended dose may have on the long-term health of patients (1). Radiotherapy has been implicated as a contributor to late-term toxicities such as second primary cancers (2) and radiation-induced cardiovascular disease (3). Improved knowledge of the relationship between organ dose and these morbidities is critical for the optimization of treatment techniques and the development of preventative measures for mitigating toxicity.
Epidemiological investigation is one important way to assess the risk of late effects after radiotherapy and accurate organ dosimetry is a key component of such analysis. Dosimetry for epidemiological studies, however, poses several unique challenges. First, the dose calculation methods need to cover regions beyond the target and adjacent tissue, which are not often considered as part of standard clinical practice. The methods must also be simple and fast enough so that they can be applied to a large epidemiological cohort. To address these issues, previous epidemiological studies have relied on analytical dose calculation methods based on physical measurements in water phantoms (4, 5). More recently, advanced analytical methods (6, 7) and streamlined Monte Carlo radiation transport methods (8, 9) have been proposed.
Another challenge is that in retrospective epidemiological studies, there is often large uncertainty in the patient anatomy; radiological images are not always accessible for patients who were treated many years ago or may be too expensive to retrieve due to administrative and technical issues. Furthermore, even when costly computed tomography (CT) images are available, which is mostly the case for patients who were treated after the introduction of the Picture Archiving and Communication System (PACS), the scan coverage frequently does not include all the anatomy of interest. CT scans used for radiotherapy planning typically cover only a portion of the body near the target volume. However, epidemiologists are often interested in the dose received by normal tissues located further away (10). The tissues and organs of interest may be located completely outside the CT scan coverage or may be only partially included. One way to overcome this challenge is to use whole-body computational human phantoms (11, 12), which provide extended anatomy for calculating dose to out-of-scan organs. However, there will inevitably be a difference between the anatomy of the computational phantom and the patient. Organ dose calculations need to be highly individualized, and for some applications, small anatomical differences can result in substantial differences in the dosimetry. This is especially true for radiotherapy because of the steep dose gradients involved.
An important research question is how computational phantoms can be adjusted to a specific individual. We hypothesize that organ dosimetry estimates can be improved by incorporating partial-body CT images, when available, into the computational phantom. To test this hypothesis, we developed an automated method for extending a partial-body CT to whole-body anatomy for cases where the organs of epidemiologic interest reside outside the available CT scan range. We have named this the Anatomically Predictive Extension (APE) method and the resulting patient-phantom combination is called the APE phantom.
MATERIALS AND METHODS
Patient Torso CT Images
Anonymized chest-abdomen-pelvis (CAP) CT scans of five patients were retrieved from the National Institutes of Health (NIH) Clinical Center (Bethesda, MD) in digital imaging and communications (DICOM) format. The selected patients were enrolled in a protocol approved by an NIH Institutional Review Board. The in-plane resolution of the images ranged from 0.8203 × 0.8203 cm2 to 0.9375 × 0.9375 cm2. The slice thickness of the CT images was 0.5 cm for all the patients. The CAP CT scans cover nearly all the organs of epidemiologic interest starting at the lung apices and extending to the symphysis pubis. The average age of the five patients was 52 years old (45–58 years). The average height and weight, respectively, were 176 cm (162–193 cm) and 85 kg (68–104 kg) with the body mass index (BMI) ranging from 24 to 30 kg/m2. The CT images were imported into an Eclipse2 treatment planning system (Varian Medical Systems Inc., Palo Alto, CA) for the contouring of major organs. Subsets of the CAP CT scans were created for testing the APE method, with the full CAP CT scans being used as ground truth. Two partial-body image subsets were created from the CAP CT scans: one representing a chest CT (lung apices to costophrenic angle) and the other representing an abdominal CT (diaphragm to symphysis pubis).
Anatomy Extension Process
Selection of computational phantom.
The APE method substitutes the missing patient anatomy with that of a computational human phantom selected from a library of phantoms developed at the National Cancer Institute in collaboration with University of Florida (13). The library consists of a total of 351 pediatric and adult phantoms with different heights and weights to represent the U.S. population. The height and weight of the adult male phantoms ranges from 160 to 190 cm and from 50 to 140 kg, respectively. These whole-body phantoms were developed based on patient CT images and contain over 100 different organs or tissues. The polygon-mesh phantoms used in this work were voxelized to match the resolution of the five patient CAP CT scans described above. The voxelized phantoms were then converted to DICOM CT images and a corresponding DICOM-RT structure file containing the phantom organ contours. The methods for generating these files have been previously described elsewhere (8). For this work, computational phantoms from the library most closely matching each of the five patients were selected based on available data from the medical records, such as age, gender (male in this study), height and weight. The arms of the phantoms were removed before voxelization to approximate CT patients who have their arms raised above their shoulders (i.e., outside the CT scan range).
Identification of the optimal merge location.
We developed an algorithm to automatically select the optimal axial z-position in the phantom where the patient partial-body CT can be inserted to create an approximately continuous whole-body anatomy. This was achieved by generating two-dimensional (2D) anterior-posterior (AP) masks of the patient and phantom skeletal structures. The skeletal masks were created by applying a threshold to the CT image pixels based on their assigned Hounsfield unit (HU). Pixels in the range of 285–3,500 HU were selected to capture most skeletal structures. The masks were normalized to have a value of 1 in the skeleton and a value of 0 elsewhere.
The optimal merge location was selected as that resulting in maximal overlap between the phantom and patient skeletal masks. A global search is conducted by scanning the patient skeletal mask across the phantom skeletal mask in both the lateral and axial directions. A Dice similarity coefficient (DSC) is calculated for each possible alignment of the masks. When the upper-left-hand pixel of the patient skeletal mask is located at pixel index position (x,z) relative to the phantom skeletal mask, the DSC is calculated as follows:
where N is an operator yielding the number of pixels of value 1 in a binary mask, Pa the 2D skeletal mask of the patient derived from the patient’s partial-body CT, and Ph(x,z) is the 2D skeletal mask of the whole-body phantom cropped to the size of the patient mask so that the pixel at index coordinate (x, z) is in the upper-left-hand corner. The mask Ph(x, z) is padded with zeros as necessary so that it is the same size as Pa. The DSC can range from 0 to 1, where a value of 0 represents the case whereby the masks do not overlap at all and a value of 1 represents the case whereby the masks overlap completely. The DSC will reach a maximum at some optimal index coordinate (x*, z*). The optimal z-position, z* is selected as the location for inserting the patient images into the phantom. The optimal lateral coordinate, x*, provides some information on how to align the skeleton of the patient and phantom in the lateral direction. However, we opted instead to use the outer dimensions of the patient and phantom for the lateral and anterior-posterior alignment, as described in the next section.
The reliability of our method for registering the phantom and patient anatomies was evaluated using the five patient CAP CT scans. We generated a total of 23 subsets of the CAP CT image stacks, which were 20 cm in axial length at axial increments of 2 cm, starting from the lung apices to the symphysis pubis (0–20 cm, 2–22 cm, 4–24 cm, etc.). The optimal merge location for each of the CT subsets was calculated using the method above. The axial position, z*, selected for the CT subsets, was then compared to the expectation that they should increase incrementally by 2 cm (0, 2, 4, 6 cm, etc.) as constructed for the five patients.
Merging patient and phantom anatomy.
The patient and phantom anatomies are merged at the selected axial position z* by overriding the phantom anatomy with that of the patient. A bounding-box registration method was used to reduce discontinuities between the phantom and the patient. The phantom portions are linearly scaled in the lateral (x) and anterior-posterior (y) direction to match the outer contour dimensions of the patient as measured on the first and last image in the patient’s partial-body CT stack. The phantom image stacks appended above and below the patient’s partial-body CT image stack are scaled independently and aligned at the center of the bounding boxes.
The tumor and the selected organs at risk in the patient are typically contoured by manual segmentation as part of the radiotherapy treatment planning. The phantoms used in this work have the advantage of being pre-contoured with over 100 different organs or tissues. Our anatomy extension method reads the pre-existing DICOM-RT structure files of the patient and combines them with those of the phantom, overriding the phantom contours where necessary. The patient and phantom structures are matched through the use of standard naming conventions. The same translation and scaling factors applied to the phantom images are applied to the phantom contours. For instance, the upper half of the patient’s liver may be contoured from the partial-body CT images. The lower half of the liver will then be taken from the phantom and the two structures will be combined into a single liver structure in the final merged APE phantom.
Automated Script for Anatomy Extension
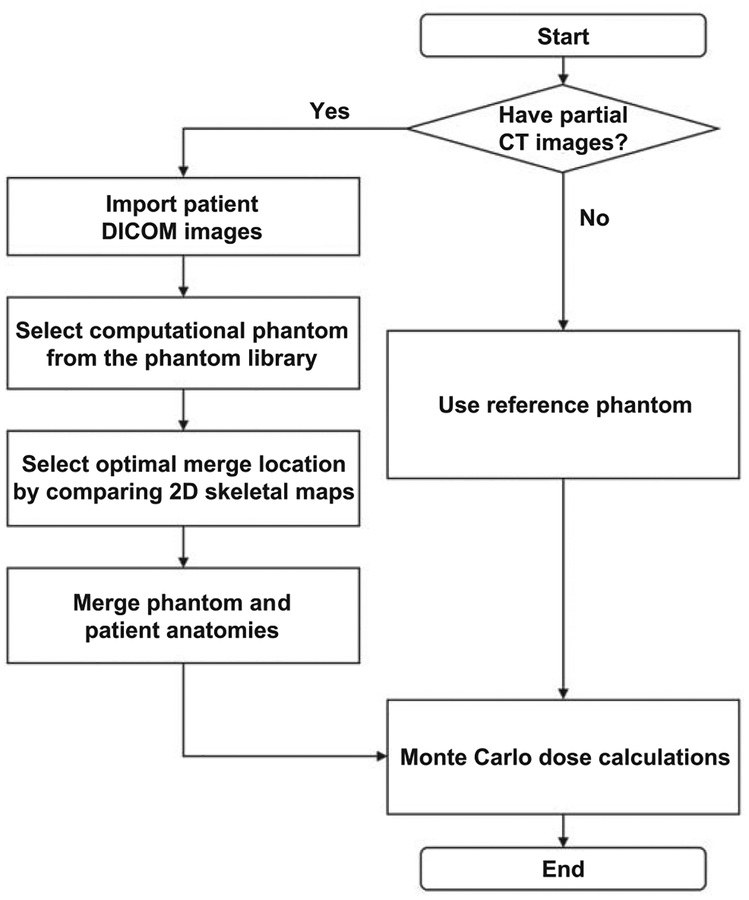
An in-house application was written in Python™ computer language to automate the APE method. A key feature of this software is that it reads and writes files in DICOM format. The input to the software is the patient’s partial-body CT and a corresponding DICOM-RT structure file containing the patient’s radiotherapy target and normal tissue contours. The output of the software is a directory containing the DICOM CT images of the whole-body APE phantom and a DICOM-RT structure file containing the APE phantom organ contours. These files can then be used as the input for dose calculation tools such as a commercial treatment planning system. The workflow of the APE method is summarized in Fig. 1.
FIG. 1.
Workflow of the Anatomically Predictive Extension process.
Validation of APE Method in Illustrative Radiotherapy
When a patient’s CT images are unavailable and their height and weight unknown, the best option for dose reconstruction is to use a reference phantom as a surrogate for the unknown anatomy. The goal of this work was to determine whether the organ doses calculated using APE phantoms would be more accurate than those calculated using a reference phantom. Two idealized cases representing chest and prostate radiotherapy treatments were considered. Organ doses were calculated for simple chest and prostate irradiations that were planned on a reference computational phantom (14) (assumed patient geometry if no CT images are available), the APE phantoms (patient-phantom hybrid given a partial-body patient CT) and the full patient CAP CT images (ground truth).
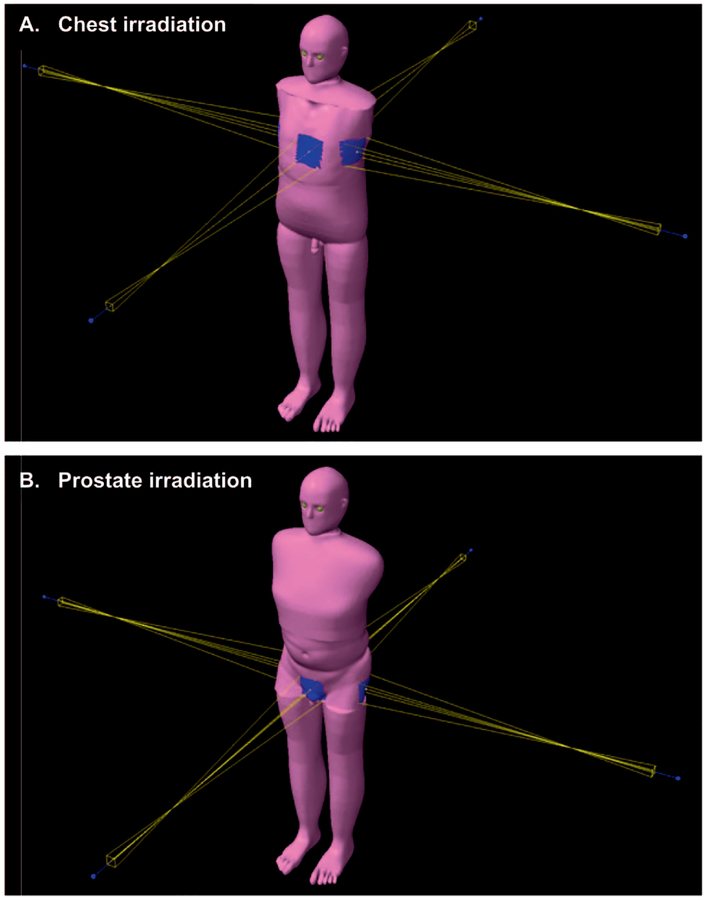
As the normal tissues of interest are located away from the primary radiotherapy fields, we elected to use our previously reported Monte Carlo dose calculation method (8). This method uses the X-ray Voxel Monte Carlo (XVMC) code as the dose calculation engine (15). All cases were transferred to an Eclipsee™ treatment planning system. A certified medical physicist created simple chest and prostate treatment plans on the patient CAP CT scans (Fig. 2). These treatment plans were then copied to the reference phantom and APE phantoms. The mean organ dose received by the heart, left and right lungs, liver, stomach, bladder and prostate was calculated for the idealized radiotherapy treatments. Sufficient particle histories were simulated to ensure that the Monte Carlo statistical error on the organ dose estimates was negligible (<1%) in all cases.
FIG. 2.
Screenshots of chest and prostate irradiation (panels A and B, respectively), taken from the Eclipse treatment planning system.
RESULTS
Patient CT and Selected Phantoms
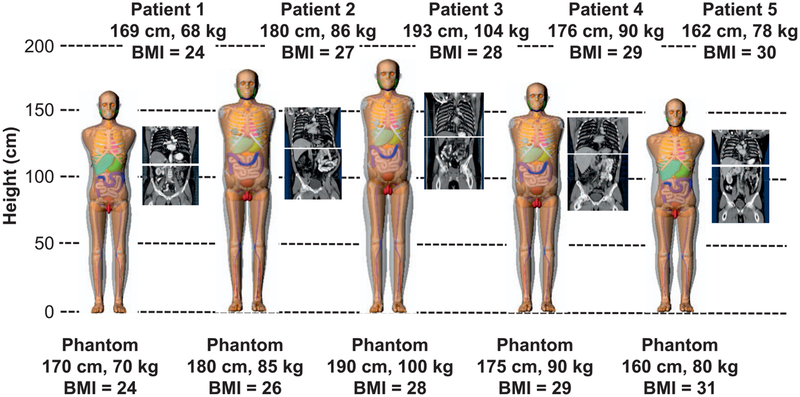
Figure 3 shows the chest and abdominal CT images extracted from the CAP CT scans of the five patients having different heights and weights. The body size-matched adult male computational phantoms are shown to the left of the patient CTs in increasing order of BMI.
FIG. 3.
Chest and abdominal CT image sets extracted from the full chest-abdomen-pelvis CT scans for the five patients with different BMIs ranging from 24–30 kg/m2. To the left of the images are the computational phantoms selected to match each patient.
Selection of Optimal Merge Location
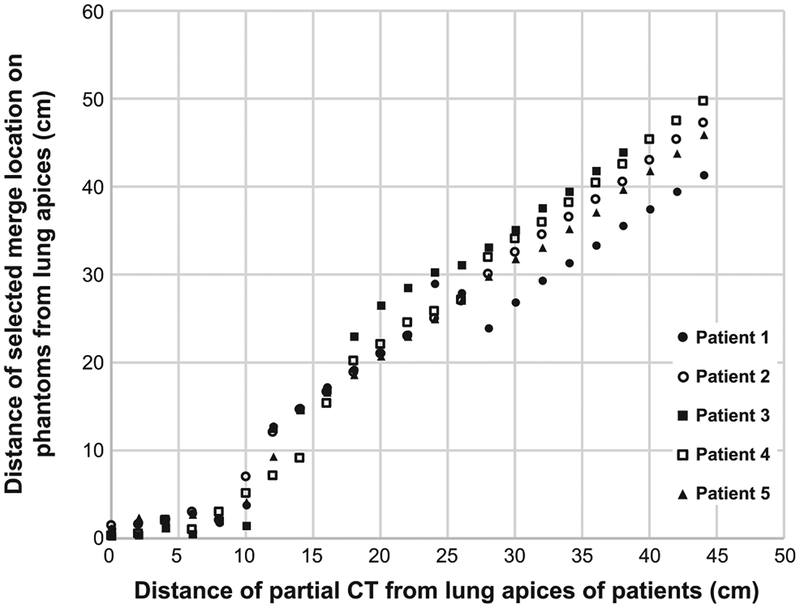
Figure 4 shows the performance of the algorithm for determining the optimal merge location for the five patients. The distance between the lung apices of the patient and the top of the partial-body CT extracted from the CAP scans is plotted on the x-axis and increases from 0 to 44 cm in 2-cm increments. The corresponding optimal merge location, z*, for each subset of the CAP scan are shown on the y-axis relative to the axial location of the lung apices in the phantom. We would expect the graph to show a line of identity if the algorithm perfectly maps the patient skeletal anatomy onto the phantom. Overall, the selected merge locations for the five patients show good agreement with the original anatomical locations. As the mapping process is based on the bony structures, we found that it is sensitive to the postures of the patients and phantoms. The least accurate portion is in the 0–10 cm range, which is attributed to differences in scapular rotation. The patients have their arms positioned above their shoulders, while the phantoms originally had their arms down at their side. The slope of the lines shown in Fig. 4 do deviate from patient 1. This indicates that even though the patient and phantoms have similar heights, there can still be systematic differences in the distances between skeletal landmarks.
FIG. 4.
Comparison of the distance of the partial CT skeletal mask (x-axis) with the distance of the merge location selected by the APE algorithm (y-axis) for the five patients.
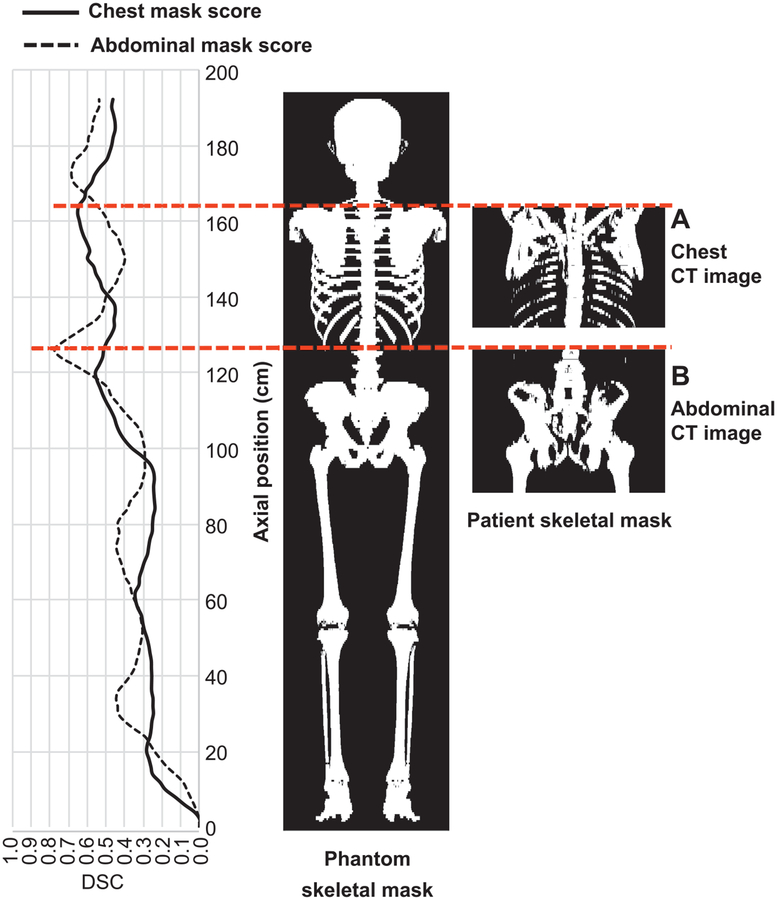
Figure 5 shows the skeletal mapping procedure for patient 3 with a height of 193 cm. Convolution of the skeletal maps of the chest CT and the whole-body phantom was performed (Fig. 5A) and the largest DSC calculated as a function of axial position z is plotted on the left in a solid line. The global maximum DSC was 0.66 at an axial position of 162 cm measured from the feet of the phantom. The case of the abdominal CT (Fig. 5B) had a global maximum DSC of 0.78 at an axial position of 125 cm. In both cases, the DSC reached local maxima at different axial positions (e.g., approximately 120 cm, pelvis region, for the chest CT and approximately 175 cm, clavicle region, for the abdominal CT), indicating that the algorithm was confused.
FIG. 5.
An example of the mapping process for patient 3. The largest DSC calculated as a function of the axial position (left side), the skeletal mask of the selected phantom (center), and the skeletal masks of the patient for the chest (panel A) and abdominal (panel B) CT cases (right side).
APE Whole-Body Phantom
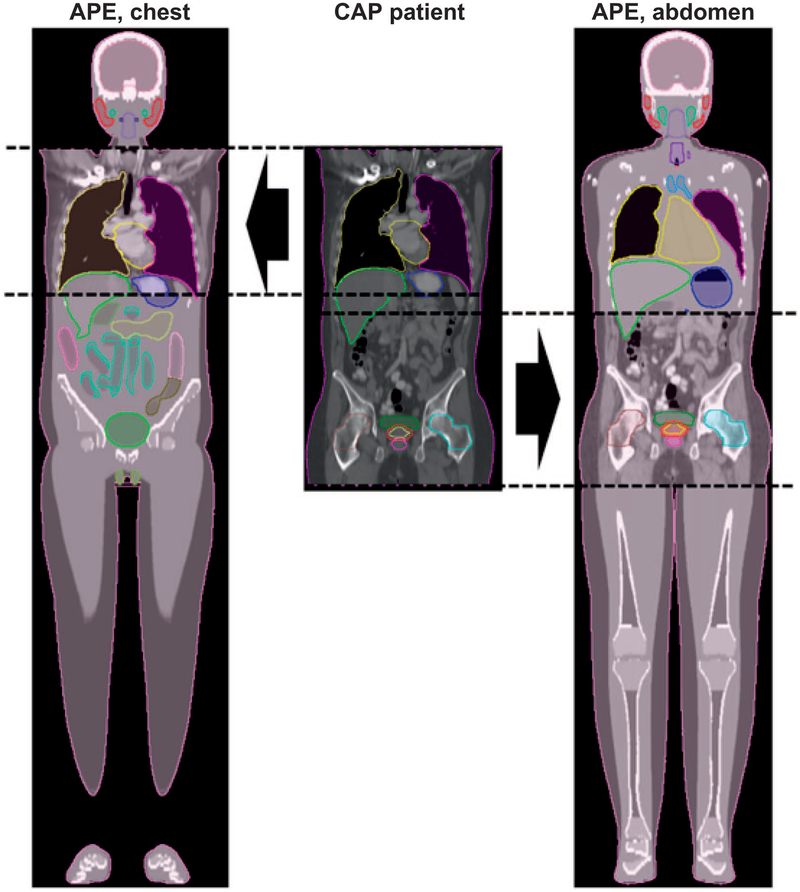
Figure 6 shows an example of APE phantoms generated from chest and abdominal CT scans taken from the full CAP CT scan of patient 5. The organ contours for the patient and APE phantom are also shown. The organs at the boundary between the anatomies of the patient and the phantom (such as the liver and the stomach) show imperfect, although sometimes remarkable continuity. The organ contours for the patient and phantom are combined so that the mean dose received by the merged organs (e.g., the liver or stomach) can be calculated.
FIG. 6.
Example APE phantom generated from chest and abdominal CT scans for patient 5. From left to right, the chest CT-based APE phantom, the original full torso CT of the patient and the abdomen CT-based APE phantom.
Organ Dose Comparison
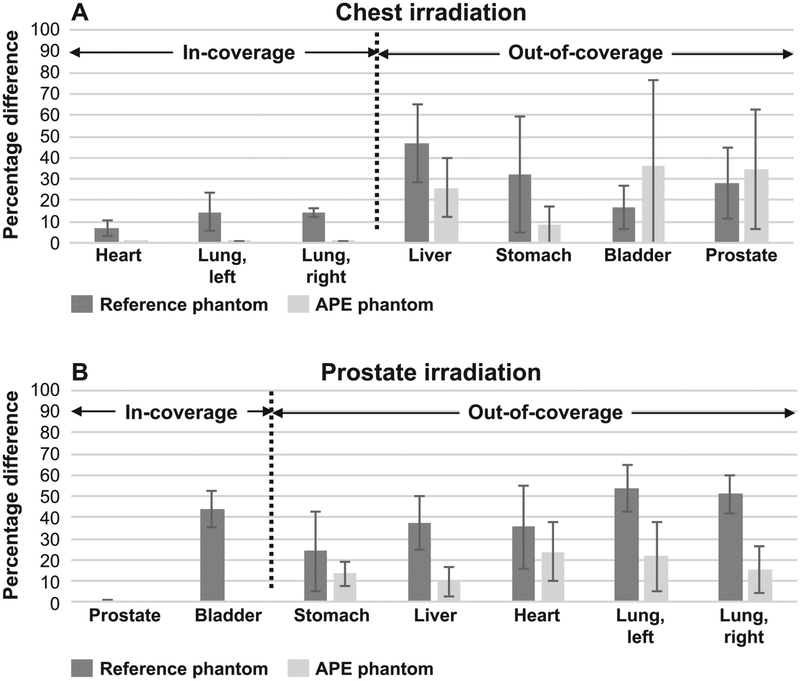
For comparison purposes the mean organ doses for the chest and prostate cases were compared relative to that calculated for the heart and prostate, respectively. The resulting percentage organ doses for the chest and the prostate irradiation cases are shown in Table 1. Percentage dose difference for the reference and APE phantoms compared to the patient CAP CT is shown in Table 2 and Fig. 7.
TABLE 1.
Percentage Dose in Illustrative Radiotherapy Chest and Prostate Irradiations for the Reference Phantom, APE Phantoms and Full CAP CT Patient Anatomies
| Patient 1 (BMI = 24) | Patient 2 (BMI = 27) | Patient 3 (BMI = 28) | Patient 4 (BMI = 29) | Patient 5 (BMI = 30) | |||||||||||
|---|---|---|---|---|---|---|---|---|---|---|---|---|---|---|---|
| Organ | Ref. | APE | Patient | Ref. | APE | Patient | Ref. | APE | Patient | Ref. | APE | Patient | Ref. | APE | Patient |
| Chest irradiation | |||||||||||||||
| Heart | 88.569 | 100.140 | 100.000 | 95.711 | 99.936 | 100.000 | 95.342 | 99.994 | 100.000 | 96.132 | 99.800 | 100.000 | 90.538 | 100.160 | 100.000 |
| Lung (left) | 22.845 | 28.774 | 28.714 | 24.687 | 29.960 | 29.939 | 24.592 | 24.585 | 24.586 | 24.796 | 28.005 | 28.021 | 23.353 | 29.775 | 30.264 |
| Lung (right) | 22.274 | 19.725 | 19.711 | 24.070 | 21.080 | 21.090 | 23.977 | 20.734 | 20.736 | 24.176 | 20.814 | 20.818 | 22.769 | 20.198 | 20.545 |
| Liver | 4.268 | 11.653 | 12.504 | 4.612 | 4.245 | 3.246 | 4.595 | 4.525 | 3.522 | 4.633 | 9.509 | 6.613 | 4.363 | 15.884 | 13.215 |
| Stomach | 3.925 | 9.203 | 9.169 | 4.241 | 4.678 | 4.679 | 4.225 | 4.429 | 4.116 | 4.260 | 4.686 | 5.999 | 4.012 | 9.731 | 10.898 |
| Bladder | 0.032 | 0.032 | 0.045 | 0.034 | 0.059 | 0.029 | 0.034 | 0.030 | 0.032 | 0.035 | 0.044 | 0.033 | 0.033 | 0.045 | 0.042 |
| Prostate | 0.016 | 0.016 | 0.029 | 0.017 | 0.029 | 0.016 | 0.017 | 0.015 | 0.023 | 0.017 | 0.022 | 0.022 | 0.016 | 0.023 | 0.027 |
| Prostate irradiation | |||||||||||||||
| Prostate | 99.505 | 100.081 | 100.000 | 100.055 | 99.999 | 100.000 | 99.064 | 100.041 | 100.000 | 99.328 | 100.031 | 100.000 | 99.533 | 99.649 | 100.000 |
| Bladder | 45.877 | 87.911 | 87.898 | 46.130 | 65.529 | 65.516 | 45.674 | 95.419 | 95.439 | 45.795 | 80.865 | 80.864 | 45.890 | 87.121 | 87.168 |
| Stomach | 0.063 | 0.072 | 0.089 | 0.063 | 0.066 | 0.056 | 0.063 | 0.136 | 0.128 | 0.063 | 0.067 | 0.062 | 0.063 | 0.095 | 0.083 |
| Liver | 0.054 | 0.074 | 0.086 | 0.054 | 0.071 | 0.070 | 0.054 | 0.123 | 0.117 | 0.054 | 0.106 | 0.098 | 0.054 | 0.091 | 0.076 |
| Heart | 0.016 | 0.019 | 0.034 | 0.016 | 0.023 | 0.017 | 0.016 | 0.032 | 0.028 | 0.016 | 0.026 | 0.023 | 0.016 | 0.027 | 0.032 |
| Lung (left) | 0.011 | 0.017 | 0.034 | 0.012 | 0.016 | 0.019 | 0.011 | 0.022 | 0.027 | 0.011 | 0.019 | 0.022 | 0.011 | 0.025 | 0.028 |
| Lung (right) | 0.011 | 0.018 | 0.026 | 0.011 | 0.016 | 0.018 | 0.011 | 0.021 | 0.026 | 0.011 | 0.018 | 0.020 | 0.011 | 0.024 | 0.025 |
The organs completely included in the partial-body CT images used to construct the APE are indicated in boldface type. Percentage dose was computed relative to that received by the heart and prostate for the chest and prostate cases, respectively.
TABLE 2.
Percentage Dose Difference between the Reference Phantom and Patients, and between APE Phantoms and Patients
| Patient 1 (BMI = 24) | Patient 2 (BMI = 27) | Patient 3 (BMI = 28) | Patient 4 (BMI = 29) | Patient 5 (BMI = 30) | ||||||
|---|---|---|---|---|---|---|---|---|---|---|
| Organ | Ref. | APE | Ref. | APE | Ref. | APE | Ref. | APE | Ref. | APE |
| Chest irradiation | ||||||||||
| Heart | 11 | 0 | 4 | 0 | 5 | 0 | 4 | 0 | 9 | 0 |
| Lung (left) | 20 | 0 | 18 | 0 | 0 | 0 | 12 | 0 | 23 | 2 |
| Lung (right) | 13 | 0 | 14 | 0 | 16 | 0 | 16 | 0 | 11 | 2 |
| Liver | 66 | 7 | 42 | 31 | 30 | 28 | 30 | 44 | 67 | 20 |
| Stomach | 57 | 0 | 9 | 0 | 3 | 8 | 29 | 22 | 63 | 11 |
| Bladder | 29 | 29 | 17 | 103 | 6 | 6 | 6 | 33 | 21 | 7 |
| Prostate | 45 | 45 | 6 | 81 | 26 | 35 | 23 | 0 | 41 | 15 |
| Prostate irradiation | ||||||||||
| Prostate | 0 | 0 | 0 | 0 | 1 | 0 | 1 | 0 | 0 | 0 |
| Bladder | 48 | 0 | 30 | 0 | 52 | 0 | 43 | 0 | 47 | 0 |
| Stomach | 29 | 19 | 13 | 18 | 51 | 6 | 2 | 8 | 24 | 14 |
| Liver | 37 | 14 | 23 | 1 | 54 | 5 | 45 | 8 | 29 | 20 |
| Heart | 53 | 44 | 6 | 35 | 43 | 14 | 30 | 13 | 50 | 16 |
| Lung (left) | 68 | 50 | 37 | 16 | 59 | 19 | 50 | 14 | 61 | 11 |
| Lung (right) | 58 | 31 | 39 | 11 | 58 | 19 | 45 | 10 | 56 | 4 |
The organs completely included in the partial-body CT images used to construct the APE are indicated in boldface type. Data are shown in either normal, italicized or bold face type to indicate the size of the discrepancy: normal <10%; italicized 10–25%; bold face >25%. The data have been rounded to whole numbers.
FIG. 7.
Absolute percentage difference for reference and APE phantoms compared to that calculated using the full CAP CT scans averaged over the five patients for the chest and prostate irradiation cases (panels A and B, respectively). The organs located in-scan and out-of-scan are indicated.
The results show that the APE phantoms offer some dosimetric advantages compared to reference phantoms. As expected, the APE phantoms and CAP CT images result in nearly identical dosimetry for those organs which are fully included in the partial-body CT used to construct the APE (e.g., heart and lungs for the chest irradiation case, and prostate and bladder for the prostate irradiation case). The reference phantoms showed, on average, organ dose differences of up to 20% and 52% in the chest and prostate cases, respectively, compared to that calculated using the full CAP scan images. The improved accuracy in the dosimetry for the APE phantoms clearly demonstrates the benefit of using patient-specific anatomy.
The results for the out-of-scan organ dosimetry were mixed. In many cases the organ doses were improved compared to the reference phantom (e.g., difference of 57% for the reference phantom versus 0.4% APE phantom for the stomach in patient 1 chest case). In other cases, however, there was no significant difference observed and sometimes the reference phantom showed better agreement (e.g., 6% reference phantom vs. 35% APE phantom for the heart in patient 2 abdomen case). Overall, however, the results still show that the APE phantoms perform similarly or better than the reference phantom. For the chest irradiation case, the average absolute difference for the out-of-scan organs was reduced from 31% (reference phantom) to 26% (APE phantom). For the prostate irradiation case, the average difference decreased from 41% (reference phantom) to 17% (APE phantom).
DISCUSSION
The main objective of this study was to develop an improved method for dose reconstruction for patients with limited anatomical data. One important application is for epidemio-logical studies used to assess the risk of late-effects after radiotherapy. For instance, we have found that the thyroid is consistently located just beyond the typical CT scan range used for breast radiotherapy planning. While the majority of second primary tumors occur within the beam-bordering region, a previous study found that approximately 20% are located in tissues 5–30 cm away from the irradiated volume (10). Our anatomy extension algorithm will help assess the radiation dose received by these distant organs and tissues and will be useful in future studies aimed at evaluating the dose-response relationship of radiation-induced second cancers.
It is worth noting that we compared organ doses between a reference phantom and patient CAP CT scans and then between the APE phantoms and patient CAP CT scans. We also compared organ doses between body size-matched phantoms and patient CAP CT scans. However, we chose not to include this latter comparison here because we did not observe clear improvement compared to reference phantoms. We found that anatomical variability in different patients cannot be captured simply by changing the size of the phantoms, which underscores the importance of the APE technique. The APE method captures as much patient-specific anatomy as possible for improving the dosimetry. While not perfect, the APE method has some important advantages over other dose reconstruction methods, which do not consider patient-specific anatomy (4, 5).
There are certain limitations to the algorithm discussed here. Manual contouring of patient CT images is still required, although the phantom CT images are already contoured. We presume that key organs at risk are already segmented during radiotherapy planning. We are exploring atlas-based automatic segmentation methods for additional organs of interest in epidemiological studies. In addition, we have so far only demonstrated the APE using images extracted from CAP scans (i.e., from lung apices to symphysis pubis). We have not yet tested the performance of APE phantoms generated using other types of CT scans (e.g., head and neck CT scans), although we believe the APE method is applicable to the entire body. Also, although the APE phantoms provide more accurate organ dose estimation than the reference phantom, we acknowledge that a dose discrepancy between APE phantoms and patients still exists. Finally, as noted before, the discontinuity in anatomy between the phantom and patient still exists in the merged APE phantom.
CONCLUSION
We developed a novel method to extend radiological patient images by combining them with available computational phantoms. We confirmed that the APE method results in improved dosimetric accuracy for external radiotherapy applications compared to dose calculations based on a reference computational phantom. The APE method will be useful for researchers to more accurately estimate organ doses outside the treatment fields when only partial-body radiological images are available.
ACKNOWLEDGMENTS
This research was funded by the NIH Intramural Research Program, National Cancer Institute, Division of Cancer Epidemiology and Genetics. The contents are solely the responsibility of the authors and do not necessarily represent the official views of the NIH. This work utilized the computational resources of the NIH high-performance computing [Biowulf user guide (http://biowulf.nih.gov)].
Footnotes
Certain commercially available software and equipment are identified in this manuscript to foster understanding. Such identification does not imply recommendation by the NIH, nor does it imply that they are the best available for the purpose.
REFERENCES
- 1.Miller KD, Siegel RL, Lin CC, Mariotto AB, Kramer JL, Rowland JH, et al. Cancer treatment and survivorship statistics, 2016. CA Cancer J Clin 2016; 66:271–89. [DOI] [PubMed] [Google Scholar]
- 2.Berrington de Gonzalez A, Gilbert E, Curtis R, Inskip P, Kleinerman R, Morton L, et al. Second solid cancers after radiation therapy: A systematic review of the epidemiologic studies of the radiation dose-response relationship. Int J Radiat Oncol 2013; 86:224–33. [DOI] [PMC free article] [PubMed] [Google Scholar]
- 3.Raghunathan D, Khilji MI, Hassan SA, Yusuf SW. Radiation-induced cardiovascular disease. Curr Atheroscler Rep 2017; 19:22. [DOI] [PubMed] [Google Scholar]
- 4.Stovall M, Weathers R, Kasper C, Smith SA, Travis L, Ron E, et al. Dose reconstruction for therapeutic and diagnostic radiation exposures: Use in epidemiological studies. Radiat Res 2006; 166:141–57. [DOI] [PubMed] [Google Scholar]
- 5.Diallo I, Lamon A, Shamsaldin A, Grimaud E, de Vathaire F, Chavaudra J. Estimation of the radiation dose delivered to any point outside the target volume per patient treated with external beam radiotherapy. Radiother Oncol 1996; 38:269–71. [DOI] [PubMed] [Google Scholar]
- 6.Jagetic LJ, Newhauser WD. A simple and fast physics-based analytical method to calculate therapeutic and stray doses from external beam, megavoltage x-ray therapy. Phys Med Biol 2015; 60:4753–75. [DOI] [PMC free article] [PubMed] [Google Scholar]
- 7.Taddei PJ, Jalbout W, Howell RM, Khater N, Geara F, Homann K, et al. Analytical model for out-of-field dose in photon craniospinal irradiation. 2013; 58:7463–79. [DOI] [PMC free article] [PubMed] [Google Scholar]
- 8.Lee C, Jung JW, Pelletier C, Pyakuryal A, Lamart S, Kim JO, et al. Reconstruction of organ dose for external radiotherapy patients in retrospective epidemiologic studies. Phys Med Biol 2015; 60:2309–24. [DOI] [PMC free article] [PubMed] [Google Scholar]
- 9.Bednarz B, Xu XG. A feasibility study to calculate unshielded fetal doses to pregnant patients in 6-MV photon treatments using Monte Carlo methods and anatomically realistic phantoms. Med Phys 2008; 35:3054–61. [DOI] [PMC free article] [PubMed] [Google Scholar]
- 10.Diallo I, Haddy N, Adjadj E, Samand A, Quiniou E, Chavaudra J, et al. Frequency distribution of second solid cancer locations in relation to the irradiated volume among 115 patients treated for childhood cancer. 2009; 74:876–83. [DOI] [PubMed] [Google Scholar]
- 11.Xu XG. An exponential growth of computational phantom research in radiation protection, imaging, and radiotherapy: a review of the fifty-year history. Phys Med Biol 2014; 59:R233–302. [DOI] [PMC free article] [PubMed] [Google Scholar]
- 12.Cristy M Mathematical phantoms representing children of various ages for use in estimates of internal dose. Oak Ridge, TN: Oak Ridge National Laboratory; 1980. (http://bit.ly/2GckySV) [Google Scholar]
- 13.Geyer AM, O’Reilly S, Lee C, Long DJ, Bolch WE. The UF/NCI family of hybrid computational phantoms representing the current US population of male and female children, adolescents, and adults–application to CT dosimetry. Phys Med Biol 2014; 59:5225–42. [DOI] [PMC free article] [PubMed] [Google Scholar]
- 14.Lee C, Lodwick D, Hurtado J, Pafundi D, Williams JL, Bolch WE. The UF family of reference hybrid phantoms for computational radiation dosimetry. Phys Med Biol 2010; 55:339–63. [DOI] [PMC free article] [PubMed] [Google Scholar]
- 15.Fippel M Fast Monte Carlo dose calculation for photon beams based on the VMC electron algorithm. Med Phys 1999; 26:1466–75. [DOI] [PubMed] [Google Scholar]


