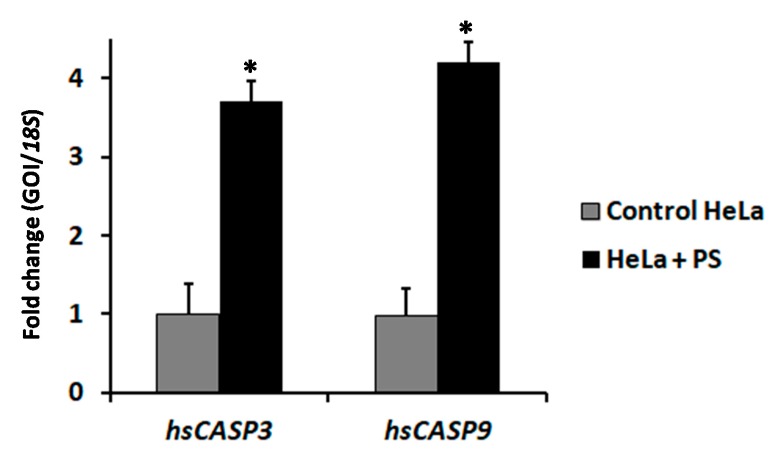
Figure 5.
RT-qPCR analysis of apoptosis-related genes in HeLa cells. HeLa cells were treated for 24 h with 12.5 µg/mL of solubilized and activated PS proteins from Bt5. Expression profile was comparable with that obtained with Bt7. Relative expression was determined with the 2−ΔΔCt method using the PCR efficiencies determined with the standard curve included in each run. Each data point represents the results obtained from three independent batches of cDNA made. Expression of target genes (Gene of interest (GOI), hsCASP3 and hsCASP9) was normalized to that of the housekeeping gene 18S, represented as mean ± SD, and is expressed as fold-change. (*) indicates significantly different mean values at p < 0.05 using a paired Student’s t-test.

