Abstract
Ultra-weak self-association can govern the macroscopic solution behavior of concentrated macromolecular solutions ranging from food products to pharmaceutical formulations and the cytosol. For example, it can promote dynamic assembly of multi-protein signaling complexes, lead to intracellular liquid–liquid phase transitions, and seed crystallization or pathological aggregates. Unfortunately, weak self-association is technically extremely difficult to study, as it requires very high protein concentrations where short intermolecular distances cause strongly correlated particle motion. Additionally, protein samples near their solubility limit in vitro frequently show some degree of polydispersity. Here we exploit the strong mass-dependent separation of assemblies in the centrifugal field to study ultra-weak binding, using a sedimentation velocity technique that allows us to determine particle size distributions while accounting for colloidal hydrodynamic interactions and thermodynamic non-ideality (Chaturvedi, S. K.; et al. Nat. Commun.2018, 9, 4415; DOI: 10.1038/s41467-018-06902-x). We show that this approach, applied to self-associating proteins, can reveal a time-average association state for rapidly reversible self-associations from which the free energy of binding can be derived. The method is label-free and allows studying mid-sized proteins at millimolar protein concentrations in a wide range of solution conditions. We examine the performance of this method with hen egg lysozyme as a model system, reproducing its well-known ionic-strength-dependent weak self-association. The application to chicken γS-crystallin reveals weak monomer–dimer self-association with KD = 24 mM, corresponding to a standard free energy change of approximately −9 kJ/mol, which is a large contribution to the delicate balance of forces ensuring eye lens transparency.
1. Introduction
Weak macromolecular interactions control a wide spectrum of macroscopic solution behavior and are intensely studied in a diverse range of disciplines, including, for example, colloid chemistry, nanoparticles, polymer chemistry, biotechnology, food chemistry, and biophysical chemistry. With intracellular concentrations in the range of 100–500 mg/mL, ultra-weak self-association processes of proteins with KD in the mM range can have substantial impact on phase behavior, the dynamic formation of multi-protein complexes, and the formation of pathologic assemblies. Classical examples of the latter are hemoglobin aggregation in sickle cell disease1 and crystallin aggregates forming cataracts in the eye lens.2,3 More recently, weak interactions promoting structurally polymorph supramolecular assemblies have drawn increasing attention, and the propensity for some proteins to promote liquid–liquid phase transitions to form membrane-less organelles has become an area of active research.4−6 In parallel, significant work has been devoted to the engineering of therapeutic proteins and their formulations to suppress the formation of immunogenic higher-order structures in the highly concentrated pharmaceutical protein drug products.7−11
For protein solutions in the range of 100 mg/mL, the intermolecular distances are on the order of macromolecular dimensions. In principle, several analytical techniques, such as small-angle X-ray and neutron scattering,12−15 paramagnetic NMR spectroscopy,16,17 static and dynamic light scattering,18−23 and analytical ultracentrifugation,24−29 allow binding measurements under highly concentrated conditions. However, these techniques require simultaneous modeling of colloidal hydrodynamic and thermodynamic interactions or solution structure factors, respectively, which inherently tend to obscure the self-association process, and/or depend on a high degree of sample purity. Either approach is problematic for protein samples near their solubility limit in vitro that are prone to form aggregates or contain undissolved microclusters, which often severely limits experimental studies of ultra-weak interactions. Unfortunately, correlated macromolecular motion at high concentrations leads to a violation of the superposition principle underlying standard particle size-distribution analyses, which can make it difficult to verify whether highly concentrated solutions are sufficiently monodisperse.
Using gravitational force as a perturbation to assess macromolecular assembly and interactions is a powerful concept. The foundation of hindered and promoted sedimentation, dependent on the interplay between repulsive hydrodynamic and weak attractive forces, is well established in colloid chemistry and statistical fluid mechanics.30−32 Similarly, enhanced sedimentation through strong or weak protein interactions, as well as reduced sedimentation from hydrodynamic non-ideality, is well known in sedimentation velocity (SV) analytical ultracentrifugation.33 The latter is a classical technique of physical biochemistry,34−37 but major computational advances in recent decades have strongly enhanced this method in terms of concentration range, resolution, and application to interacting macromolecules.33,38,39 In particular, a new experimental opportunity for studying weak interactions in concentrated protein solutions has arisen recently with the new ability to quantitatively interpret the characteristic boundary anomalies at high concentrations to measure hydrodynamic interactions while simultaneously determining a high-resolution diffusion-deconvoluted sedimentation coefficient distribution, termed cNI(s0).40 (For a mathematical description, see the Supporting Information [SI].) Among the virtues lending SV to work at high macromolecular concentration are the absence of special label or solvent requirements and minimal sample dilution. In experiments up to 50 mg/mL, it has been shown to baseline-resolve small oligomers of medium-sized proteins and hydrodynamically separate larger particles.40 Here, we show that this approach of determining a sedimentation coefficient distribution from non-ideal solutions allows the study of ultra-weak protein self-association, including processes with rapid interconversion between short-lived oligomeric states.
2. Results and Discussion
2.1. Principle of Experimental Approach
In the present work we exploit the fact that the spatio-temporal evolution of sedimentation boundary shapes contains detailed information on the concentration-dependence of sedimentation. To clarify the basic idea, Figure 1 shows calculated concentration profiles evolving with time at 200000g for a 20 kDa protein at 50 mg/mL exhibiting a weak monomer–dimer self-association. The predictions are based on coupled Lamm partial-differential equations41 (LPDEs) including chemical conversion between monomer and dimer states each with concentration-dependent sedimentation and diffusion coefficients (see SI). Compared to ideal sedimentation in dilute conditions, colloidal hydrodynamic interactions at high concentration cause both retardation and self-sharpening of the sedimentation boundaries.33,42,43 By contrast, the dominant effect of self-association is the enhancement of sedimentation, while boundaries remain significantly sharpened under non-ideal conditions. Through a detailed analysis of both the boundary shapes and migration throughout the entire sedimentation process, the new cNI(s0) method allows, for the first time, to unravel the two competing phenomena: polydispersity from oligomerization and/or aggregation, and non-ideal interactions in a mean-field approximation expressed through coefficients kS for sedimentation and kD for diffusion. The latter are related to the second virial coefficient B2 = (kS + kD)/2, and capture volume exclusion and hydrodynamic interactions dependent on the interparticle distance distribution. (B2 is considered here in w/v units, equivalent to B′2M with B′2 in molar units.)
Figure 1.
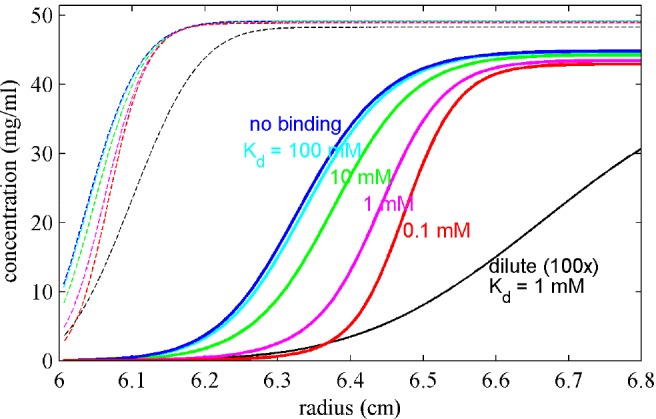
Visualization of the information content of sedimentation boundaries at high concentration. Sedimentation profiles are calculated for a 20 kDa protein in self-association equilibrium between 2.1 S monomer and 3.0 S dimer, for time points of 3000 s (dashed) and 18 000 s (solid) after sedimentation at 50 000 rpm. Measurement of a dilute sample (25 μM; black line, concentrations 100-fold magnified) provides information on diffusion and monomer sedimentation coefficient. At high concentration (2.5 mM; colored lines) colloidal non-ideality interactions (kS = 10 mL/g, kD = 5 mL/g) oppose sedimentation and the concentration-dependent retardation leads to characteristic “self-sharpening”, the latter revealing the magnitude of non-ideal interactions. The sedimentation boundaries are further modulated by self-association enhancing migration.
A concentration series will shift relative populations of molecules in monomeric and dimeric state, which can be recognized from the corresponding shift in the sedimentation coefficient distributions cNI(s0). For the simulated system of Figure 1 with KD = 1 mM, the cNI(s0) distributions as a function of protein concentration are shown in Figure 2. Analogous to sedimentation in dilute solution,33,44 the measured distributions reflect the molecular time-average oligomeric state for self-association reactions with short complex lifetimes relative to sedimentation. These can exhibit a bimodal shape due to dilution within the sedimentation boundary.45 This results in a concentration-dependent peak pattern that cannot be directly interpreted in terms of oligomeric species. However, the sedimentation coefficient distributions can be conventionally integrated to determine the isotherm of weight-average s-values (termed sw), and since hydrodynamic interactions have been accounted for in cNI(s0), the sw isotherm can be modeled by mass action law as shown in the inset of Figure 2. In these analyses, the relative precision of the non-ideality parameter kS in cNI(s0) is ∼10%, which in unfavorable cases can amplify into errors of KD from isotherm modeling by a factor 2 to 3.
Figure 2.
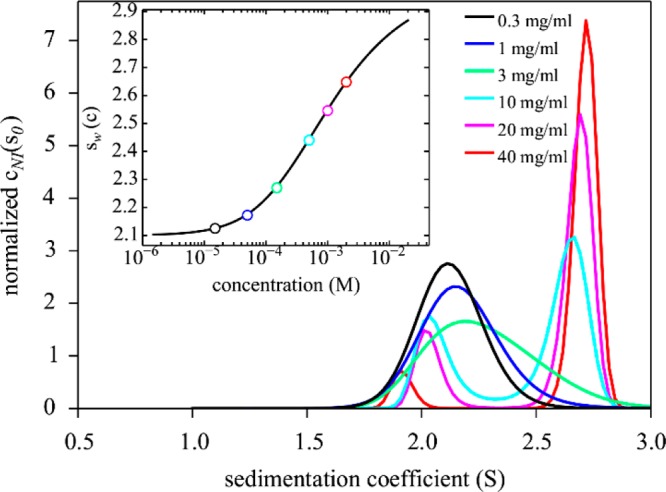
Sedimentation coefficient distributions cNI(s0) calculated for the simulated monomer–dimer system of Figure 1, based on known parameters, with KD = 1 mM, at concentrations between 0.015 and 2 mM (0.3–40 mg/mL). The inset shows the weight-average sedimentation coefficients for each concentration from integration of cNI(s0) (symbols) and the expected binding isotherm based on mass action law (line).
2.2. Demonstration with Hen Egg Lysozyme as Model System
To test this approach in practice we carried out SV experiments with hen egg lysozyme (HEL), which is known to weakly self-associate depending on the buffer conditions.20,22,46Figure 3 shows typical SV data at 29 mg/mL (2 mM) HEL taken from a dilution series from 0.5 to 29 mg/mL. For the cNI(s0) analysis of the concentration series, the scaling parameter for ideal diffusion was kept at the frictional ratio obtained at the lowest concentration (where non-ideality is negligible), whereas the non-ideality coefficient for sedimentation kS was fixed at the average value measured at the two highest concentrations (where non-ideality is strongest). Even though assembly products at higher concentration may differ in frictional ratio, boundary sharpening from non-ideality counteracts and masks concentration-dependent diffusion.40 The data have extremely high signal/noise ratio and can be fit by cNI(s0) generally with a ratio of rmsd to signal of (2–3) × 10–3. Figure 4a shows the resulting sedimentation coefficient distributions at different concentrations. In addition to the monomer peak, a faster peak can be discerned with a concentration-dependent population and s-value, which is characteristic for self-associating systems in fast exchange. It reflects the time-average state of molecules at high concentrations in the leading edge of the sedimentation boundary. As an independent control we measured the second virial coefficient B2 by sedimentation equilibrium, resulting in a slightly negative value of B2 = −2.5 mL/g, that is consistent with previous reports22 and confirms HEL self-association in these conditions.
Figure 3.
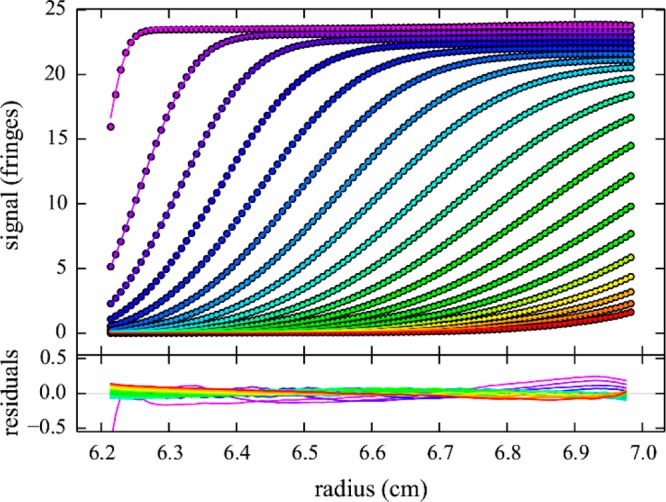
Rayleigh interference optical sedimentation boundaries of 29 mg/mL HEL in 10 mM sodium acetate, pH 4.6, 300 mM NaCl at 50 000 rpm (circles) and best-fit from the cNI(s0) model (lines), as shown in Figure 4. Residuals are shown in the lower panel. The root-mean-square deviation is 0.002-fold the loading signal. For clarity only every 10th data point of every 3rd scan is shown, in a color temperature indicating the evolution of time.
Figure 4.
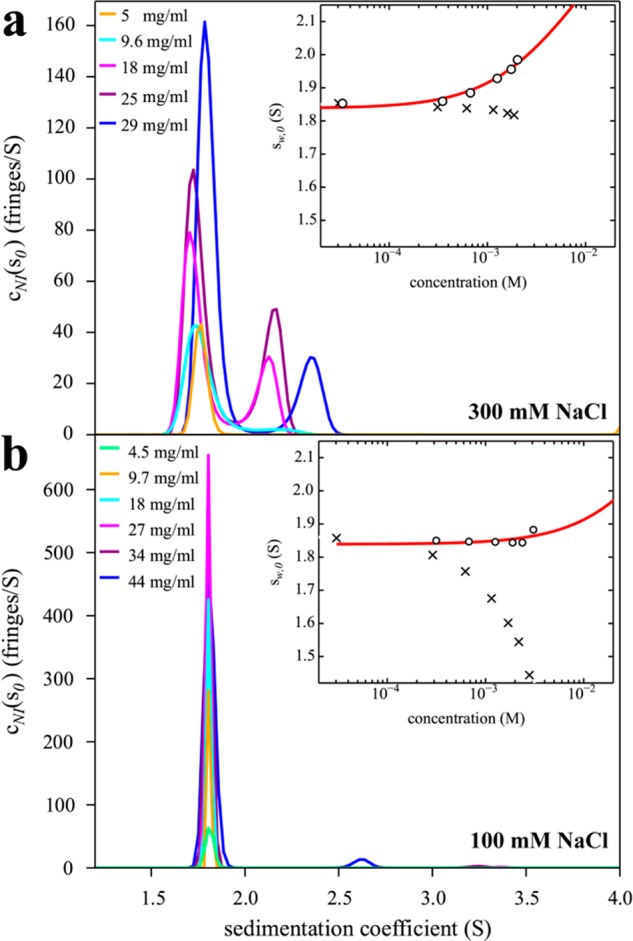
Sedimentation coefficient distributions of HEL in high salt (a) and low salt (b) conditions promoting or suppressing self-association, respectively. Buffer conditions are 10 mM sodium acetate, pH 4.6, with 300 mM NaCl (a) or 100 mM NaCl (b) with HEL concentrations indicated in the legend. The insets show weight-average s-values sw as a function of concentration (corrected to standard conditions) from integration of the cNI(s0) distributions (circles) and best-fit isotherms for a monomer–dimer self-association model (red line). For (a), the best-fit KD is 24 (11–32) mM, with kS = 3.4 mL/g, whereas for (b) the best-fit KD is 260 mM, but only a lower limit KD > 53 mM can be deduced from the data, and kS = 5.7 mL/g. For comparison, conventional analyses not accounting for non-ideality lead to sw-values dominated by repulsive hydrodynamic interactions (crosses), implying apparent non-ideality coefficients for sedimentation kS* = 0.71 mL/g (a) and 6.9 mL/g (b).
Since the sedimentation coefficient distributions cNI(s0) are corrected for colloidal non-ideality and report s-values that would be encountered under conditions of ideal sedimentation,40 they allow conventional interpretation of macromolecular hydrodynamic shapes and/or binding equilibria. In particular, the weight-average s-values (inset in Figure 4) can be interpreted as a binding isotherm, here resulting in an estimate for the monomer–dimer KD = 24 (11–32) mM (red line). As in the case of isotherm analyses of higher affinity interactions, if a majority population of the assembly products cannot be achieved experimentally, the interpretation of the isotherms will require an assembly model. Best-fit binding constants typically correlate to some extent with the properties of the complex, in the present case its s-values, which can be constrained using hydrodynamic shape considerations.33 Previously, experimental weight-average s-values could not be corrected for non-ideality, and therefore the binding isotherm was superimposed by repulsive hydrodynamic interactions, resulting in a net decrease of sedimentation coefficients with increasing concentration (crosses in the insets of Figure 4) from which only an apparent non-ideality coefficient kS* can be obtained.
Since the non-ideal sedimentation coefficient distribution analysis does not make assumptions regarding the number and size of species present in solution, it lends itself to recognize higher-order oligomers and/or aggregates near the solubility limit. For example, data from a significantly more polydisperse sample of HEL can be found in the SI (Figure S1). On the other hand, after having verified the absence of significant populations of other sedimenting species in the data from Figures 3 and 4, an explicit monomer–dimer sedimentation model using coupled LPDEs may be used in a global direct boundary fit to extract association constants (SI, Figure S2). For the dilution series of HEL in 300 mM NaCl this leads to an estimate of KD = 19 (13–24) mM, consistent with the value from isotherm analysis of Figure 4a.
An advantage of HEL as a model system is the ability to tune the affinity by modulating charges and counterions.20 While the data from Figures 3 and 4a are collected at pH 4.6 in high salt (300 mM NaCl), at lower salt (100 mM NaCl) electrostatic repulsion dominates interparticle potential and suppresses binding. A concentration series measured by SV under these conditions leads to cNI(s0) distributions with a constant monomer peak, and only traces of dimer or aggregates at the highest concentration (Figure 4b). Correspondingly, sedimentation equilibrium experiments yield a second virial coefficient of B2 = 4.2 mL/g, consistent with excluded volume and repulsive charge interactions. The isotherm of weight-average sedimentation coefficients from the new cNI(s0) analysis (inset in Figure 4b) allows a lower limit of KD = 53 mM to be determined. (Global boundary modeling with single-component LPDEs leads to a lower limit of 81 mM; data not shown.) By conventional methods, the weight-average s-values only show a strong decrease with concentration from uncorrected hydrodynamic non-ideality.
2.3. Application to Chicken γS-Crystallin
Finally, we apply the new approach to study the solution state of chicken γS-crystallin. γ-Crystallins are a major macromolecular component of the densest regions of vertebrate eye lenses, and without turnover, they must remain soluble for the lifetime of the organism.47 They are among the most compact proteins known48,49 and, across different phyla, have evolved to exhibit high molecular refractive index so as to alleviate high osmotic pressure and chemical activity.50,51 A prerequisite for transparency of the lens is the absence of refractive index fluctuations on the spatial scale greater than half the wavelength of light,52 and crystallin aggregation mechanisms in the development of cataract have been subject of significant research over several decades.53 Furthermore, light scattering is minimized for disordered packing with correlation lengths on the order of the average intermolecular distances.52,54 Weak collective attractive interactions of crystallins have been deduced from dynamic light scattering experiments,23 small angle neutron scattering data,15 and the study of liquid–liquid phase separation in ternary mixtures.23 γ-Crystallins are monomeric in dilute solution, but are structurally closely related to multimeric β-crystallins,55,56 and weak dimerization of γ-crystallins mediated by alignment of molecular dipoles has been proposed.57 Recently, we have reported intermolecular contacts in crystals of chicken γS-crystallin that mimic a conserved dimerization interface in β-crystallins.58,59 However, dimerization could not be detected in solution, as the interpretation of sedimentation boundaries in SV was obscured by obligate hydrodynamic repulsive interactions.58 Therefore, with the expanded dynamic range of SV presented here, and using the new tools to account for colloidal interactions, we reexamine the question of solution self-association of chicken γS-crystallin.
Figure 5 shows Rayleigh interference profiles for a sample of 82 mg/mL γS-crystallin. With ∼6% volume occupancy of protein in solution this is at the limit of the linear approximation for concentration-dependent sedimentation and diffusion coefficients60 underlying the current cNI(s0) analysis. However, in a concentration series self-association can be clearly discerned from both the increasing amplitude of faster-sedimenting boundary component at higher concentrations, and from the increase in the overall weight-average sedimentation coefficient. Analysis of the sw isotherm leads to an estimate of KD = 27 (16–81) mM (Figure 6). In the absence of significant faster-sedimenting contributions, an explicit single-component, monomer–dimer LPDE model (SI, Figure S3) leads to a best-fit KD = 24 (18–36) mM, corresponding to a standard free-energy of binding of −9.2 kJ/mol. It will be interesting in future studies to examine similarly the magnitude of weak self-association of other γ-crystallins, as well as mutual binding among different members of the βγ-crystallin family. Weak interactions between γD and βB1 of similar magnitude as the self-interaction of γD have been observed from measurements of liquid–liquid phase separation in ternary mixtures.23 Interestingly, KD values in the range of tens of mM correspond to protein concentrations at half-saturation comparable to the total protein in the nucleus of the lens, and therefore may play a significant role in maintaining a spatial organization with high packing density with short-range order that ensures transparency while avoiding crystallization, aggregation, and liquid–liquid phase separation.15,52,54,61 In fact, it has been calculated that interaction energies as low as −1.3 kJ/mol between α- and γ-crystallin can already impact lens transparency significantly.15
Figure 5.
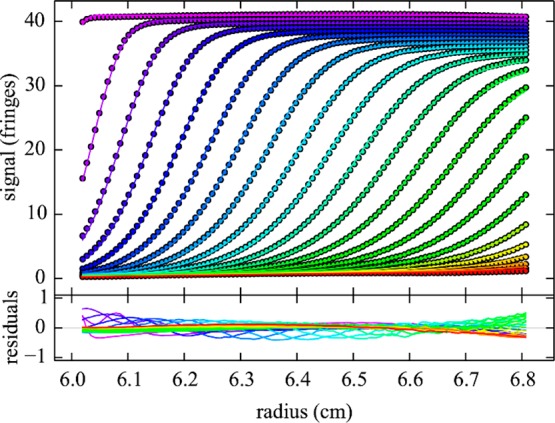
Rayleigh interference optical sedimentation boundaries of 82 mg/mL chicken γS-crystallin in 50 mM Tris-HCl, 25 mM NaCl, 1 mM DTT, pH 7.5, sedimenting at 50 000 rpm in 1.75 mm path length centerpiece. For clarity only every 10th data point of every 3rd scan is shown (circles), and best-fit from the cNI(s0) model (lines). The ratio of rmsd of the residuals (lower panel) to loading signal is 0.0034.
Figure 6.
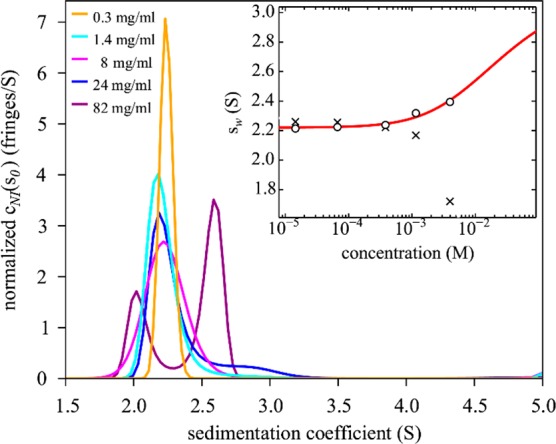
Sedimentation coefficient distributions cNI(s0) of chicken γS-crystallin from 15 μM to 4 mM (0.3–82 mg/mL). The inset shows weight-average s-values as a function of concentration (circles), and the best-fit isotherm for a monomer–dimer self-association model (red line) resulting in an estimate of KD = 27 (16–81) mM. For comparison, the conventional analysis not accounting for non-ideality leads to sw-values shown as crosses.
3. Conclusion
We report a new method to study ultra-weak self-association of proteins which is based on the measurement of non-ideal sedimentation coefficient distributions in SV. It overcomes the correlation and compensation of concentration-dependent effects from repulsive hydrodynamic interactions and attractive interactions from binding, which previously limited the interpretation of SV data at high concentrations. A key advantage over most existing methodology for studying protein interactions is the ability to monitor polydispersity and to exclude signal contributions from aggregates, should they occur, in the subsequent binding isotherm analysis. Thus, SV can well tolerate impurities of macromolecules or particles that are outside the size range of the proteins studied, whereas impurities that cannot be hydrodynamically resolved should be below 5%. Furthermore, measuring the macromolecular sedimentation coefficient distributions can provide a rational motivation for binding models. A significant disadvantage compared to NMR is the lack of structural detail in SV studies, which can provide only macroscopic information on complex sizes and populations. Experimentally, SV does not require any labels, is compatible with a wide range of buffers, requires on the order of 100 μL sample volume, and can be applied to samples as high as 80 mg/mL, which allows the detection of interactions with equilibrium dissociation constants on the order of total intracellular concentrations. For stronger interactions, it offers the potential to saturate complex formation, for example, to populate the largest oligomers and extend conventional binding analyses into the range of non-ideal solutions where self-association has previously been masked by repulsive hydrodynamic interactions. Even though our focus was protein interactions, the method is equally applicable to carbohydrates and other macromolecules.28,62 SV is rapidly developing in the areas of detection technology and sample holders,40,63−67 which in conjunction with recent theoretical advances32 may allow improved precision and higher upper concentration limits in the future.
Acknowledgments
This work was supported by the Intramural Research Programs of the National Institute of Biomedical Imaging and Bioengineering and the National Eye Institute, National Institutes of Health.
Supporting Information Available
The Supporting Information is available free of charge on the ACS Publications website at DOI: 10.1021/jacs.8b11371.
Mathematical methods for cNI(s0) and LPDEs, sw binding isotherm modeling, experimental details, figures of polydisperse samples, and global LPDE fits (PDF)
The authors declare no competing financial interest.
Supplementary Material
References
- Eaton W. A.; Hofrichter J. Sickle Cell Hemoglobin Polymerization. Adv. Protein Chem. 1990, 40, 63–279. 10.1016/S0065-3233(08)60287-9. [DOI] [PubMed] [Google Scholar]
- Tardieu A. Eye Lens Proteins and Transparency: From Light Transmission Theory to Solution X-Ray Structural Analysis. Annu. Rev. Biophys. Biomol. Struct. 1988, 17, 47–70. 10.1146/annurev.biophys.17.1.47. [DOI] [PubMed] [Google Scholar]
- Jaenicke R.; Slingsby C. Lens Crystallins and Their Microbial Homologs: Structure, Stability, and Function. Crit. Rev. Biochem. Mol. Biol. 2001, 36 (5), 435–499. 10.1080/20014091074237. [DOI] [PubMed] [Google Scholar]
- Wu H.; Fuxreiter M. The Structure and Dynamics of Higher-Order Assemblies: Amyloids, Signalosomes, and Granules. Cell 2016, 165 (5), 1055–1066. 10.1016/j.cell.2016.05.004. [DOI] [PMC free article] [PubMed] [Google Scholar]
- Shin Y.; Brangwynne C. P. Liquid Phase Condensation in Cell Physiology and Disease. Science (Washington, DC, U. S.) 2017, 357, eaaf4382. 10.1126/science.aaf4382. [DOI] [PubMed] [Google Scholar]
- Banani S. F.; Rice A. M.; Peeples W. B.; Lin Y.; Jain S.; Parker R.; Rosen M. K. Compositional Control of Phase-Separated Cellular Bodies. Cell 2016, 166 (3), 651–663. 10.1016/j.cell.2016.06.010. [DOI] [PMC free article] [PubMed] [Google Scholar]
- Philo J. S. A Critical Review of Methods for Size Characterization of Non-Particulate Protein Aggregates. Curr. Pharm. Biotechnol. 2009, 10 (4), 359–372. 10.2174/138920109788488815. [DOI] [PubMed] [Google Scholar]
- Uchiyama S.; Noda M.; Krayukhina E. Sedimentation Velocity Analytical Ultracentrifugation for Characterization of Therapeutic Antibodies. Biophys. Rev. 2018, 10 (2), 259–269. 10.1007/s12551-017-0374-3. [DOI] [PMC free article] [PubMed] [Google Scholar]
- Berkowitz S. A.; Engen J. R.; Mazzeo J. R.; Jones G. B. Analytical Tools for Characterizing Biopharmaceuticals and the Implications for Biosimilars. Nat. Rev. Drug Discovery 2012, 11 (7), 527–540. 10.1038/nrd3746. [DOI] [PMC free article] [PubMed] [Google Scholar]
- Jiskoot W.; Kijanka G.; Randolph T. W.; Carpenter J. F.; Koulov A. V.; Mahler H. C.; Joubert M. K.; Jawa V.; Narhi L. O. Mouse Models for Assessing Protein Immunogenicity: Lessons and Challenges. J. Pharm. Sci. 2016, 105 (5), 1567–1575. 10.1016/j.xphs.2016.02.031. [DOI] [PMC free article] [PubMed] [Google Scholar]
- Roberts C. J. Protein Aggregation and Its Impact on Product Quality. Curr. Opin. Biotechnol. 2014, 30, 211–217. 10.1016/j.copbio.2014.08.001. [DOI] [PMC free article] [PubMed] [Google Scholar]
- Stradner A.; Sedgwick H.; Cardinaux F.; Poon W. C. K.; Egelhaaf S. U.; Schurtenberger P. Equilibrium Cluster Formation in Concentrated Protein Solutions and Colloids. Nature 2004, 432 (7016), 492–495. 10.1038/nature03109. [DOI] [PubMed] [Google Scholar]
- Kaieda S.; Lund M.; Plivelic T. S.; Halle B. Weak Self-Interactions of Globular Proteins Studied by Small-Angle X-Ray Scattering and Structure-Based Modeling. J. Phys. Chem. B 2014, 118 (34), 10111–10119. 10.1021/jp505809v. [DOI] [PubMed] [Google Scholar]
- Krueger S.; Chen S. H.; Hofrichter J.; Nossal R. Small Angle Neutron Scattering Studies of HbA in Concentrated Solutions. Biophys. J. 1990, 58 (3), 745–757. 10.1016/S0006-3495(90)82417-6. [DOI] [PMC free article] [PubMed] [Google Scholar]
- Stradner A.; Foffi G.; Dorsaz N.; Thurston G.; Schurtenberger P. New Insight into Cataract Formation: Enhanced Stability through Mutual Attraction. Phys. Rev. Lett. 2007, 99 (19), 198103. 10.1103/PhysRevLett.99.198103. [DOI] [PubMed] [Google Scholar]
- Tang C.; Ghirlando R.; Clore G. M. Visualization of Transient Ultra-Weak Protein Self-Association in Solution Using Paramagnetic Relaxation Enhancement. J. Am. Chem. Soc. 2008, 130 (12), 4048–4056. 10.1021/ja710493m. [DOI] [PubMed] [Google Scholar]
- Vaynberg J.; Qin J. Weak Protein-Protein Interactions as Probed by NMR Spectroscopy. Trends Biotechnol. 2006, 24 (1), 22–27. 10.1016/j.tibtech.2005.09.006. [DOI] [PubMed] [Google Scholar]
- Minton A. P. Static Light Scattering from Concentrated Protein Solutions, I: General Theory for Protein Mixtures and Application to Self-Associating Proteins. Biophys. J. 2007, 93 (4), 1321–1328. 10.1529/biophysj.107.103895. [DOI] [PMC free article] [PubMed] [Google Scholar]
- Schmitz K. S.An Introduction to Dynamic Light Scattering by Macromolecules; Academic Press: Boston, MA, 1990. [Google Scholar]
- Muschol M.; Rosenberger F. Interactions in Undersaturated and Supersaturated Lysozyme Solutions: Static and Dynamic Light Scattering Results. J. Chem. Phys. 1995, 103 (24), 10424–10432. 10.1063/1.469891. [DOI] [Google Scholar]
- Kuehner D. E.; Heyer C.; Rämsch C.; Fornefeld U. M.; Blanch H. W.; Prausnitz J. M. Interactions of Lysozyme in Concentrated Electrolyte Solutions from Dynamic Light-Scattering Measurements. Biophys. J. 1997, 73 (6), 3211–3224. 10.1016/S0006-3495(97)78346-2. [DOI] [PMC free article] [PubMed] [Google Scholar]
- Saluja A.; Fesinmeyer R. M.; Hogan S.; Brems D. N.; Gokarn Y. R. Diffusion and Sedimentation Interaction Parameters for Measuring the Second Virial Coefficient and Their Utility as Predictors of Protein Aggregation. Biophys. J. 2010, 99 (8), 2657–2665. 10.1016/j.bpj.2010.08.020. [DOI] [PMC free article] [PubMed] [Google Scholar]
- Wang Y.; Lomakin A.; McManus J. J.; Ogun O.; Benedek G. B. Phase Behavior of Mixtures of Human Lens Proteins Gamma D and Beta B1. Proc. Natl. Acad. Sci. U. S. A. 2010, 107 (30), 13282–13287. 10.1073/pnas.1008353107. [DOI] [PMC free article] [PubMed] [Google Scholar]
- Chatelier R. C.; Minton A. P. Sedimentation Equilibrium in Macromolecular Solutions of Arbitrary Concentration. II. Two Protein Components. Biopolymers 1987, 26 (7), 1097–1113. 10.1002/bip.360260709. [DOI] [PubMed] [Google Scholar]
- Wills P. R.; Jacobsen M. P.; Winzor D. J. Analysis of Sedimentation Equilibrium Distributions Reflecting Nonideal Macromolecular Associations. Biophys. J. 2000, 79 (4), 2178–2187. 10.1016/S0006-3495(00)76466-6. [DOI] [PMC free article] [PubMed] [Google Scholar]
- Scott D. J.; Winzor D. J. Comparison of Methods for Characterizing Nonideal Solute Self-Association by Sedimentation Equilibrium. Biophys. J. 2009, 97 (3), 886–896. 10.1016/j.bpj.2009.05.028. [DOI] [PMC free article] [PubMed] [Google Scholar]
- Hopkins M. M.; Lambert C. M.; Bee J. S.; Parupudi A.; Bain D. L. Determination of Interaction Parameters for Reversibly Self-Associating Antibodies: A Comparative Analysis. J. Pharm. Sci. 2018, 107 (7), 1820–1830. 10.1016/j.xphs.2018.03.011. [DOI] [PubMed] [Google Scholar]
- Patel T. R.; Harding S. E.; Ebringerova A.; Deszczynski M.; Hromadkova Z.; Togola A.; Paulsen B. S.; Morris G. A.; Rowe A. J. Weak Self-Association in a Carbohydrate System. Biophys. J. 2007, 93 (3), 741–749. 10.1529/biophysj.106.100891. [DOI] [PMC free article] [PubMed] [Google Scholar]
- Rowe A. J. Ultra-Weak Reversible Protein-Protein Interactions. Methods 2011, 54 (1), 157–166. 10.1016/j.ymeth.2011.02.006. [DOI] [PubMed] [Google Scholar]
- Batchelor G. K.; Wen C.-S. Sedimentation in a Dilute Polydisperse System of Interacting Spheres. Part 2. Numerical Results. J. Fluid Mech. 1982, 124, 495–528. 10.1017/S0022112082002602. [DOI] [Google Scholar]
- Lattuada E.; Buzzaccaro S.; Piazza R. Colloidal Swarms Can Settle Faster than Isolated Particles: Enhanced Sedimentation near Phase Separation. Phys. Rev. Lett. 2016, 116 (3), 038301 10.1103/PhysRevLett.116.038301. [DOI] [PubMed] [Google Scholar]
- Fiore A. M.; Wang G.; Swan J. W. From Hindered to Promoted Settling in Dispersions of Attractive Colloids: Simulation, Modeling, and Application to Macromolecular Characterization. Phys. Rev. Fluids 2018, 3 (6), 063302 10.1103/PhysRevFluids.3.063302. [DOI] [Google Scholar]
- Schuck P.; Zhao H.. Sedimentation Velocity Analytical Ultracentrifugation: Interacting Systems; CRC Press: Boca Raton, FL, 2017. [Google Scholar]
- Svedberg T.; Rinde H. The Determination of the Distribution of Size of Particles in Disperse Systems. J. Am. Chem. Soc. 1923, 45 (4), 943–954. 10.1021/ja01657a012. [DOI] [Google Scholar]
- Svedberg T.; Pedersen K. O.. The Ultracentrifuge; Oxford University Press: London, 1940. [Google Scholar]
- Schachman H. K.Ultracentrifugation in Biochemistry; Academic Press: New York, 1959. [Google Scholar]
- Schuck P.; Zhao H.; Brautigam C. A.; Ghirlando R.. Basic Principles of Analytical Ultracentrifugation; CRC Press: Boca Raton, FL, 2015. [Google Scholar]
- Schuck P. Analytical Ultracentrifugation as a Tool for Studying Protein Interactions. Biophys. Rev. 2013, 5 (2), 159–171. 10.1007/s12551-013-0106-2. [DOI] [PMC free article] [PubMed] [Google Scholar]
- Schuck P.Sedimentation Velocity Analytical Ultracentrifugation: Discrete Species and Size-Distributions of Macromolecules and Particles; CRC Press: Boca Raton, FL, 2016. [Google Scholar]
- Chaturvedi S. K.; Ma J.; Brown P. H.; Zhao H.; Schuck P. Measuring Macromolecular Size Distributions and Interactions at High Concentrations by Sedimentation Velocity. Nat. Commun. 2018, 9 (1), 4415. 10.1038/s41467-018-06902-x. [DOI] [PMC free article] [PubMed] [Google Scholar]
- Lamm O. Die Differentialgleichung Der Ultrazentrifugierung. Ark. Mater. Astr. Fys. 1929, 21B (2), 1–4. [Google Scholar]
- Creeth J. M. An Approximate “steady State” Condition in the Ultracentrifuge. Proc. R. Soc. A Math. Phys. Eng. Sci. 1964, 282 (1390), 403–421. [Google Scholar]
- Winzor D. J.; Scott D. J. Allowance for Boundary Sharpening in the Determination of Diffusion Coefficients by Sedimentation Velocity: A Historical Perspective. Biophys. Rev. 2018, 10 (1), 3–13. 10.1007/s12551-017-0384-1. [DOI] [PMC free article] [PubMed] [Google Scholar]
- Schuck P. On the Analysis of Protein Self-Association by Sedimentation Velocity Analytical Ultracentrifugation. Anal. Biochem. 2003, 320 (1), 104–124. 10.1016/S0003-2697(03)00289-6. [DOI] [PubMed] [Google Scholar]
- Gilbert G. A.; Jenkins R. C. L. Sedimentation and Electrophoresis of Interacting Substances. II. Asymptotic Boundary Shape for Two Substances Interacting Reversibly. Proc. R. Soc. London Ser. A 1959, 253 (1274), 420–437. 10.1098/rspa.1959.0204. [DOI] [Google Scholar]
- Le Brun V.; Friess W.; Schultz-Fademrecht T.; Muehlau S.; Garidel P. Lysozyme-Lysozyme Self-Interactions as Assessed by the Osmotic Second Virial Coefficient: Impact for Physical Protein Stabilization. Biotechnol. J. 2009, 4 (9), 1305–1319. 10.1002/biot.200800274. [DOI] [PubMed] [Google Scholar]
- Slingsby C.; Wistow G. J. Functions of Crystallins in and out of Lens: Roles in Elongated and Post-Mitotic Cells. Prog. Biophys. Mol. Biol. 2014, 115 (1), 52–67. 10.1016/j.pbiomolbio.2014.02.006. [DOI] [PMC free article] [PubMed] [Google Scholar]
- Chen Y.; Zhao H.; Schuck P.; Wistow G. Solution Properties of γ-Crystallins: Compact Structure and Low Frictional Ratio Are Conserved Properties of Diverse γ-Crystallins. Protein Sci. 2014, 23 (1), 76–87. 10.1002/pro.2395. [DOI] [PMC free article] [PubMed] [Google Scholar]
- Zhao H.; Chen Y.; Rezabkova L.; Wu Z.; Wistow G.; Schuck P. Solution Properties of γ-Crystallins: Hydration of Fish and Mammal γ-Crystallins. Protein Sci. 2014, 23 (1), 88–99. 10.1002/pro.2394. [DOI] [PMC free article] [PubMed] [Google Scholar]
- Zhao H.; Brown P. H.; Magone M. T.; Schuck P. The Molecular Refractive Function of Lens γ-Crystallins. J. Mol. Biol. 2011, 411 (3), 680–699. 10.1016/j.jmb.2011.06.007. [DOI] [PMC free article] [PubMed] [Google Scholar]
- Zhao H.; Magone M. T.; Schuck P. The Role of Macromolecular Crowding in the Evolution of Lens Crystallins with High Molecular Refractive Index. Phys. Biol. 2011, 8 (4), 046004 10.1088/1478-3975/8/4/046004. [DOI] [PMC free article] [PubMed] [Google Scholar]
- Benedek G. B. Theory of Transparency of the Eye. Appl. Opt. 1971, 10 (3), 459–473. 10.1364/AO.10.000459. [DOI] [PubMed] [Google Scholar]
- Moreau K. L.; King J. A. Protein Misfolding and Aggregation in Cataract Disease and Prospects for Prevention. Trends Mol. Med. 2012, 18 (5), 273–282. 10.1016/j.molmed.2012.03.005. [DOI] [PMC free article] [PubMed] [Google Scholar]
- Delaye M.; Tardieu A. Short-Range Order of Crystallin Proteins Accounts for Eye Lens Transparency. Nature 1983, 302 (5907), 415–417. 10.1038/302415a0. [DOI] [PubMed] [Google Scholar]
- Blundell T. L.; Lindley P. F.; Miller L.; Moss D.; Slingsby C.; Tickle I.; Turnell B.; Wistow G. J. The Molecular Structure and Stability of the Eye Lens: X-Ray Analysis of γ-Crystallin II. Nature 1981, 289 (26), 771–777. 10.1038/289771a0. [DOI] [PubMed] [Google Scholar]
- Slingsby C.; Wistow G. J.; Clark A. R. Evolution of Crystallins for a Role in the Vertebrate Eye Lens. Protein Sci. 2013, 22 (4), 367–380. 10.1002/pro.2229. [DOI] [PMC free article] [PubMed] [Google Scholar]
- Purkiss A. G.; Bateman O. A.; Wyatt K.; Wilmarth P. A.; David L. L.; Wistow G. J.; Slingsby C. Biophysical Properties of GammaC-Crystallin in Human and Mouse Eye Lens: The Role of Molecular Dipoles. J. Mol. Biol. 2007, 372 (1), 205–222. 10.1016/j.jmb.2007.06.049. [DOI] [PMC free article] [PubMed] [Google Scholar]
- Sagar V.; Chaturvedi S. K.; Schuck P.; Wistow G. Crystal Structure of Chicken ΓS-Crystallin Reveals Lattice Contacts with Implications for Function in the Lens and the Evolution of the Βγ-Crystallins. Structure 2017, 25 (7), 1068–1078. 10.1016/j.str.2017.05.015. [DOI] [PMC free article] [PubMed] [Google Scholar]
- Chen Y.; Sagar V.; Len H. S.; Peterson K.; Fan J.; Mishra S.; McMurtry J.; Wilmarth P. A.; David L. L.; Wistow G. γ-Crystallins of the Chicken Lens: Remnants of an Ancient Vertebrate Gene Family in Birds. FEBS J. 2016, 283 (8), 1516–1530. 10.1111/febs.13689. [DOI] [PMC free article] [PubMed] [Google Scholar]
- Batchelor G. K. Sedimentation in a Dilute Dispersion of Spheres. J. Fluid Mech. 1972, 52 (2), 245–268. 10.1017/S0022112072001399. [DOI] [Google Scholar]
- Bell M. M.; Ross D. S.; Bautista M. P.; Shahmohamad H.; Langner A.; Hamilton J. F.; Lahnovych C. N.; Thurston G. M. Statistical-Thermodynamic Model for Light Scattering from Eye Lens Protein Mixtures. J. Chem. Phys. 2017, 146 (5), 055101 10.1063/1.4974155. [DOI] [PMC free article] [PubMed] [Google Scholar]
- Almutairi F. M.; Erten T.; Adams G. G.; Hayes M.; McLoughlin P.; Kök M. S.; Mackie A. R.; Rowe A. J.; Harding S. E. Hydrodynamic Characterisation of Chitosan and Its Interaction with Two Polyanions: DNA and Xanthan. Carbohydr. Polym. 2015, 122, 359–366. 10.1016/j.carbpol.2014.09.090. [DOI] [PubMed] [Google Scholar]
- Desai A.; Krynitsky J.; Pohida T. J.; Zhao H.; Schuck P. 3D-Printing for Analytical Ultracentrifugation. PLoS One 2016, 11 (8), e0155201 10.1371/journal.pone.0155201. [DOI] [PMC free article] [PubMed] [Google Scholar]
- Kroe R. R.; Laue T. M. NUTS and BOLTS: Applications of Fluorescence-Detected Sedimentation. Anal. Biochem. 2009, 390 (1), 1–13. 10.1016/j.ab.2008.11.033. [DOI] [PMC free article] [PubMed] [Google Scholar]
- Schilling K.; Krause F. Analysis of Antibody Aggregate Content at Extremely High Concentrations Using Sedimentation Velocity with a Novel Interference Optics. PLoS One 2015, 10 (3), e0120820 10.1371/journal.pone.0120820. [DOI] [PMC free article] [PubMed] [Google Scholar]
- Pearson J.; Walter J.; Peukert W.; Cölfen H. Advanced Multiwavelength Detection in Analytical Ultracentrifugation. Anal. Chem. 2018, 90, 1280–1291. 10.1021/acs.analchem.7b04056. [DOI] [PubMed] [Google Scholar]
- Pearson J.; Hofstetter M.; Dekorsy T.; Totzeck M.; Cölfen H. Design Concepts in Absorbance Optical Systems for Analytical Ultracentrifugation. Analyst 2018, 143, 4040–4050. 10.1039/C8AN00706C. [DOI] [PubMed] [Google Scholar]
Associated Data
This section collects any data citations, data availability statements, or supplementary materials included in this article.


