 Highly selective and effective formate and acetate production from CO2 electroreduction on cathodized metal–organic framework nanosheets.
Abstract
An efficient and selective Cu catalyst for CO2 electroreduction is highly desirable since current catalysts suffer from poor selectivity towards a series of products, such as alkenes, alcohols, and carboxylic acids. Here, we used copper(ii) paddle wheel cluster-based porphyrinic metal–organic framework (MOF) nanosheets for electrocatalytic CO2 reduction and compared them with CuO, Cu2O, Cu, a porphyrin–Cu(ii) complex and a CuO/complex composite. Among them, the cathodized Cu-MOF nanosheets exhibit significant activity for formate production with a faradaic efficiency (FE) of 68.4% at a potential of –1.55 V versus Ag/Ag+. Moreover, the C–C coupling product acetate is generated from the same catalyst together with formate at a wide voltage range of –1.40 V to –1.65 V with the total liquid product FE from 38.8% to 85.2%. High selectivity and activity are closely related to the cathodized restructuring of Cu-MOF nanosheets. With the combination of X-ray diffraction, X-ray photoelectron spectroscopy, high resolution transmission electron microscopy and Fourier transform infrared spectroscopy, we find that Cu(ii) carboxylate nodes possibly change to CuO, Cu2O and Cu4O3, which significantly catalyze CO2 to formate and acetate with synergistic enhancement from the porphyrin–Cu(ii) complex. This intriguing phenomenon provides a new opportunity for the rational design of high-performance Cu catalysts from pre-designed MOFs.
Introduction
The reduction of CO2 to useful chemicals holds great promise for reducing humanity's enormous carbon footprint.1–5 Electrochemical conversion of CO2 using electricity generated from renewable energy sources could provide a viable solution to the production of carbon-neutral fuels and chemicals.6–8 Current products from the CO2 reduction reaction (CO2RR) include carbon monoxide, alkenes, acids, and alcohols.9 Although many research studies focus on the production of potential fuels, such as C2H4, CH3OH, and C2H5OH,10–12 a recent gross-margin model counterintuitively revealed that HCOOH and CO are the most economically viable products.13 Compared with gaseous CO,14–20 the liquid products HCOOH and CH3COOH are easy to collect and store.21 However, the formate and acetate production from the CO2RR still remains a scientific challenge.22 Major Sn-based catalysts usually suffer from limited reaction selectivity and a narrow range of active voltage,23–25 although a recent Bi-based catalyst has shown high potential for formate generation.26,27 In addition, very few electrocatalysts perform CO2 reduction to acetate due to the low activity of C–C coupling.28 Therefore, it is urgent to develop new catalysts for the transformation of CO2 to formate and acetate. Copper-based CO2RR catalysts are well-known for their capability of producing C2+ products, but they suffer from low selectivity and product diversity.29,30 Recent Cu-based catalysts have demonstrated great potential for the production of formate and acetate,28,29 however, with lower faradaic efficiency (FE).
Metal–organic frameworks (MOFs) with high porosity and designable metal clusters and organic linkers arouse significant research interest in biomedical, energy and environmental applications, such as drug delivery, enzyme inhibition, separation and catalysis.31–34 The atomic-level periodicity of metal complexes or metal clusters in MOFs allows the precise control over the rational design of the active metals as potential electrocatalysts for the CO2RR.15,19,35–38 The successful application of most bulk MOFs as electrocatalysts is largely hindered by their poor electrical conductivity and inevitable gas diffusion barrier,39 which could be significantly improved by adjusting the synthetic method to form nano-MOFs, especially two-dimensional (2-D) MOF nanosheets.40,41 Nevertheless, to the best of our knowledge, 2-D MOF nanosheets have not yet been explored in the CO2 electroreduction.
It is now well accepted that an electrocatalyst undergoes in situ structural transformation under reaction conditions, which has been largely underestimated.42,43 2-D MOF nanosheets under cathodization conditions have not been studied before. Thus, we choose copper(ii)-5,10,15,20-tetrakis(4-carboxyphenyl)porphyrin–Cu(ii) (Cu2(CuTCPP)) nanosheets with two different copper chemical environments as a potential CO2 electrocatalyst. One is the porphyrinic Cu, which has been shown as an electrocatalyst for the formation of CH4.44 The other is the Cu paddle wheel, the cluster in the famous HKUST-1, which is efficient in CH4 and C2H4 production.44,45
Here, we report the efficient and selective electroreduction of CO2 to formate and acetate by a 2-D Cu-MOF nanosheet catalyst. The FE for the formation of two liquid products reached up to 85.2% with a total current density of 4.5 mA cm–2. The turnover frequency (TOF) of the catalyst for formate and acetate formation could reach as high as 2037 h–1 and 148 h–1, respectively. This high efficiency is significantly different from that of common Cu catalysts, such as Cu2O, CuO, Cu and a porphyrin–Cu(ii) complex (CuTCPP). Ex situ powder X-ray diffraction (XRD), scanning electron microscopy (SEM), X-ray photoelectron spectroscopy (XPS), transmission electron microscopy (TEM) and Fourier transform infrared spectroscopy (FT-IR) confirmed the cathodized reconstruction of 2-D MOF nanosheets to the heterostructures of CuO, Cu2O and Cu4O3 through the Cu(HCOO)2 and Cu(OH)2 intermediates. Meanwhile, the CuTCPP complex was still anchored on the catalyst and could enhance the activity of the catalyst. This result reveals the fundamental significance of cathodized restructuring for highly selective production of formate and acetate on pre-designed MOF electrocatalysts.
Results and discussion
Preparation and characterization of Cu2(CuTCPP) nanosheets
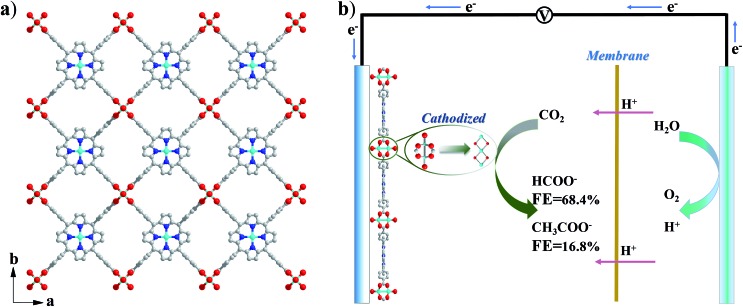
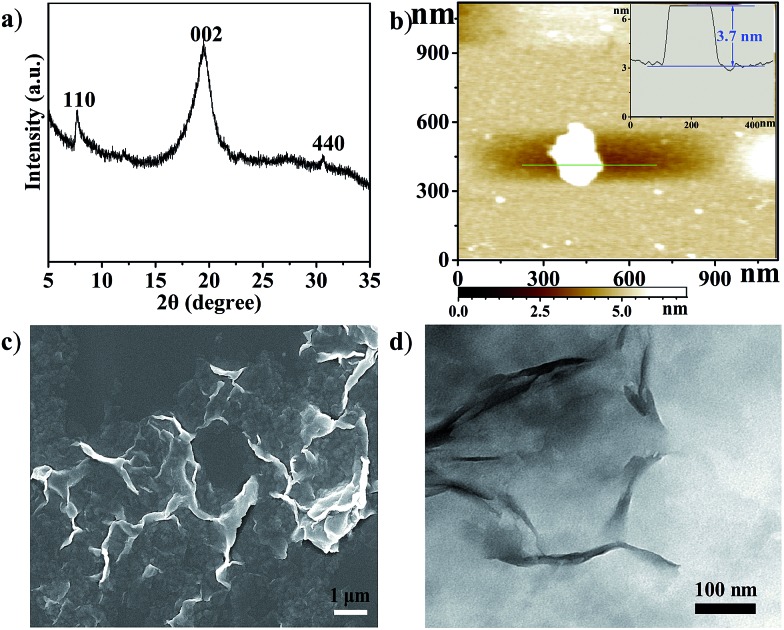
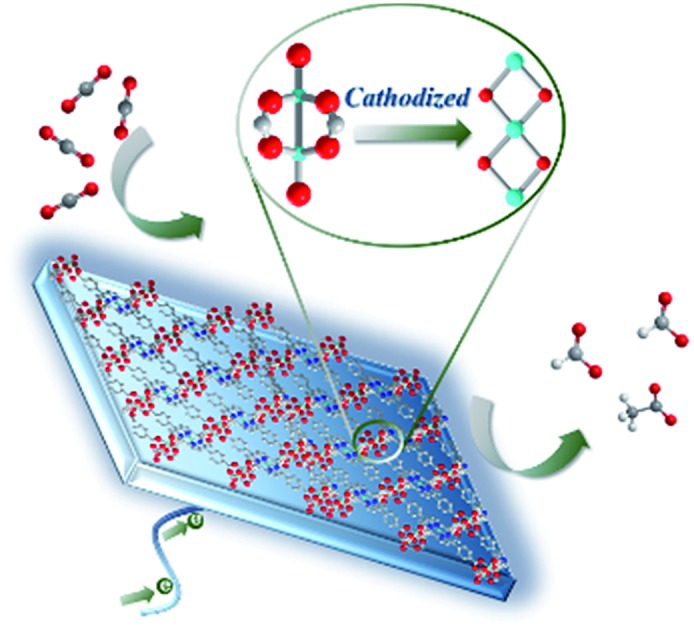
Cu2(CuTCPP) has a porous 2D layered reticular framework structure with Cu porphyrin ligands connected through Cu2(COO)4 paddle wheels (Scheme 1a and Fig. S1†). The adjacent layers stack in parallel, generating vertical 1D channels along the c axis. The XRD pattern of the as-prepared product was consistent with that of Cu2(CuTCPP) (Fig. 1a).46,47 The broad peaks in the XRD pattern were due to the nanosheet feature. After dispersion in ethanol by ultrasonication, these nanosheets showed layered structures with thin thickness in the SEM image (Fig. 1c). The TEM image revealed that the Cu2(CuTCPP) nanosheets had a smooth surface, and uniform and ultrathin thickness with high aspect ratio, which resulted in the partial curling of nanosheet edges (Fig. 1d). Atomic force microscopy (AFM) measurements showed that the nanosheets had a homogeneous thickness of ∼3.7 nm, indicating only 8 layers (Fig. 1b and S1†). Notably, the direct synthesis of few-molecular-layer MOF nanosheets on a large scale is rarely reported,46,47 although this type of flat and high-aspect-ratio nanosheet is very desirable for electrocatalysis because of its advantages over bulk materials in regard to reducing the diffusion kinetics barrier and enhancing the electron transfer.
Scheme 1. (a) Crystal structure of Cu2(CuTCPP) nanosheets along the c axis. Red is O, blue is N, grey is C and cyan is Cu; (b) CO2 electrochemical reduction system with Cu2(CuTCPP) nanosheets as the catalyst.
Fig. 1. (a) XRD pattern of Cu2(CuTCPP) nanosheets; (b) AFM image of the nanosheets, inset: the thickness curve; (c) SEM image of Cu2(CuTCPP) nanosheets; (d) TEM image of Cu2(CuTCPP) nanosheets.
Electrochemical CO2 reduction by Cu2(CuTCPP) nanosheets
The electrocatalytic CO2RR activity of Cu2(CuTCPP) nanosheets on a FTO electrode was evaluated in CH3CN solution with 1 M H2O and 0.5 M ionic liquid 1-ethyl-3-methylimidazolium tetrafluoroborate (EMIMBF4) in a two-compartment electrochemical H-type cell (Scheme 1b).3 The organic electrolyte with water and ionic liquid components was chosen to control proton concentration and enhance CO2 solubility, respectively.48–50 The linear sweep voltammetry (LSV) curves of Cu2(CuTCPP) in N2-saturated and CO2-saturated electrolytes showed different cathodic waves from 0.5 V to –2.0 V versus Ag/Ag+ (Fig. S2†). In the CO2-saturated electrolyte, a steep increase of current density in the negative sweep started from –1.2 V versus Ag/Ag+ indicating significant CO2 reduction (Fig. S2†). Meanwhile, a blank experiment with a FTO electrode was also performed since FTO is F-doped SnO2, which is also the active material for the CO2RR (Fig. S3†). We found that only a small amount of CO (FE < 10%) was produced as the reduction product, ruling out the possible formate generation from the FTO substrate.
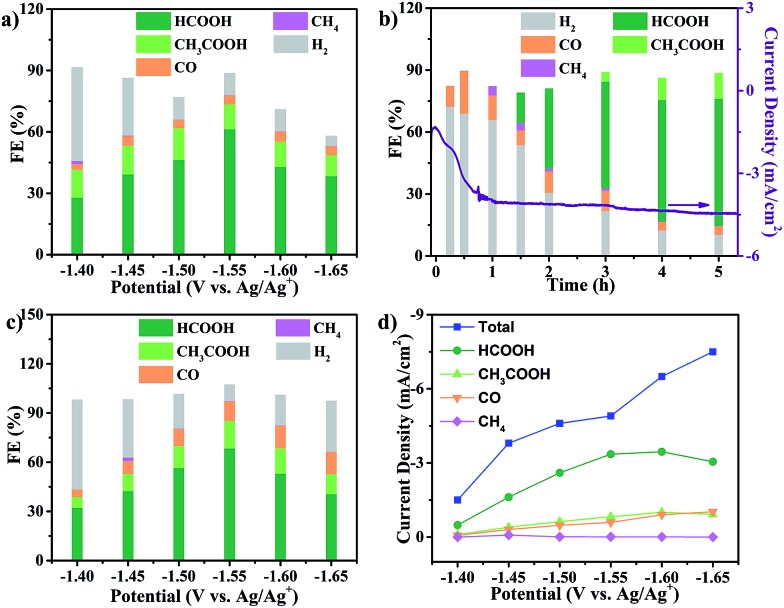
In order to identify and quantify the reduction products, electrolysis was performed at different potentials between –1.40 V and –1.65 V versus Ag/Ag+ for 5 h. Resultant gaseous products were periodically sampled and examined using gas chromatography (GC), while the liquid products were analyzed after electrolysis by nuclear magnetic resonance (NMR) spectroscopy. We found that formate and acetate were the two dominant reduction products, accompanied by a small amount of CO and CH4 from the CO2RR as well as H2 from the HER. The FEs for the formation of different products at various potentials were calculated and are shown in Fig. 2a. Formate and acetate were reliably and reproducibly detected at as positive as –1.40 V versus Ag/Ag+. Initially, the faradaic efficiencies were 28.1% and 11.6%, respectively, which then quickly rose to 61.5% and 12.3% at –1.55 V versus Ag/Ag+. The faradaic efficiency for the formation of the two gaseous products, CO and CH4, remained small (<5%) in this range of potentials. Moreover, H2 production from the competing HER was well controlled from –1.50 V to –1.65 V.
Fig. 2. CO2RR performance in CO2-saturated CH3CN solution with 1 M H2O and 0.5 M EMIMBF4. (a) Faradaic efficiencies of Cu2(CuTCPP) nanosheets; (b) faradaic efficiencies of Cu2(CuTCPP) nanosheets at different times; (c) faradaic efficiencies of pre-electrolyzed Cu2(CuTCPP) nanosheets; and (d) total and partial current densities for CO2RR products on pre-electrolyzed Cu2(CuTCPP).
However, the catalyst delivered a significant decrease of cathodic current density during the first 1 h and then a stable cathodic current density of 4.5 mA cm–2 (Fig. 2b). The first 1 h changes of current density indicated possible chemical restructuring of the catalyst under the cathodization conditions. It is also worth noting that the decrease from a total FE of 100% at –1.60 V and –1.65 V might indicate the hidden consumption of electrons by the side reactions as well (Fig. 2a). The initial increase in i–t curves and the insufficient total FE values both indicated the possible redox-based chemical restructuring of the Cu2(CuTCPP) catalyst. Thus, the production of formate and acetate as a function of electrolysis time was investigated at –1.55 V (Fig. 2b). In the first 1 h, the HER became the dominant cathodic process with a small amount of CO and CH4. Then, after 90 min, formate appeared, while H2 from the HER decreased. After 3 h, acetate appeared. After that, stable production of formate and acetate occurred.
To eliminate the side reactions during the initial process and further confirm the activity of the final cathodized catalyst, Cu2(CuTCPP) nanosheets were pre-electrolyzed at –1.55 V. Then, the CO2RR was performed with fresh electrolyte at various potentials (Fig. 2c). The highest faradaic efficiencies for formate and acetate formation were increased to 68.4% and 16.8% at –1.55 V versus Ag/Ag+, respectively, with a total faradaic efficiency of 85.2%. Furthermore, the partial current densities for CO2RR products on the Cu2(CuTCPP) catalyst were calculated and plotted against the working potentials (Fig. 2d). The maximum values of jformate and jacetate are 3.5 mA cm–2 and 1.0 mA cm–2, respectively, at –1.60 V versus Ag/Ag+. What's more, at –1.55 V versus Ag/Ag+, with a maximum total faradaic efficiency of 85.2% and a surface active site density of 3.16 × 10⁻⁸ mol cm–2 (Fig. S4†), the TOF of the catalyst for formate and acetate production could reach as high as 2037 h–1 and 148 h–1, respectively (Fig. S5†), which outperformed that of most of the reported catalysts.51,52
To confirm the carbon source of the CO2RR process, a control experiment under a N2 atmosphere was performed (Fig. S6†). H2 was the only product, which demonstrated that formate and acetate were produced from the reduction of CO2, but not from the organic part or the impurities in the electrolyte or MOF material. The continual production of formate and acetate as shown by the kinetic data also supports that the carbon source was CO2. Water concentration was also an important factor and was optimized since the competitive HER also uses H2O as the proton source (Fig. S7†). Without H2O, no products could be detected, for both the HER and CO2RR. The CO2RR is significant because of the unusually low FE for the HER at a water concentration of 1.0 M, indicating that H2O is not only the proton source but also important in the cathodization procedure to generate an effective catalyst (Fig. S8†). Since CO is a possible intermediate,53 we explored the direct CO reduction. However, only the HER occurred with Cu2(CuTCPP) as the catalyst for the electrocatalytic CO reduction (Fig. S9†).
Comparison with other Cu catalysts
The restructuring of a Cu catalyst to other active Cu-containing species is not rare in electrocatalyst research.42 Before the elucidation of structural changes of the Cu2(CuTCPP) catalyst, we first surveyed the CO2RR activity of Cu, CuTCPP, Cu2O, and CuO, which are common Cu catalysts (Fig. 3 and S10†). The catalysts were confirmed by XRD (Fig. S11–S14†) and were evaluated as CO2 electrocatalysts under identical conditions compared to those of Cu2(CuTCPP) nanosheets.
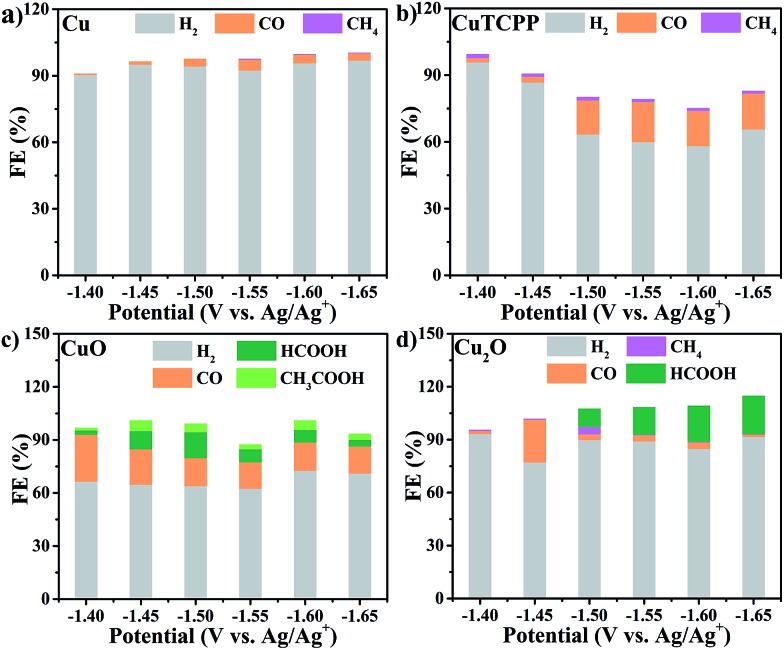
Fig. 3. Faradaic efficiencies for formation of different products in the CO2RR with different catalysts: (a) Cu, (b) CuTCPP, (c) CuO, and (d) Cu2O.
Control experiments with Cu, CuTCPP, CuO, and Cu2O suggested that although in the presence of CO2, the HER became the dominant cathodic process for all four catalysts, accompanied by the co-generation of a small amount of CO, CH4, HCOOH and CH3COOH. The FE and yield of products at different potentials were calculated and are shown in Fig. 3 and Table S1,† respectively. Negligible CO2RR was observed on the Cu catalyst with mainly CO and CH4 as products (FE < 5%) while no formate and acetate were observed. The CuTCPP complex was chosen as the counterpart since it is one of two Cu components in Cu2(CuTCPP). However, although CO was produced with a FE of 20% at potentials from –1.50 V to –1.65 V, H2 from the HER was still the major product. CuO and Cu2O were two common forms of copper oxides for the CO2RR.54 In our results, CuO was significant to generate both HCOOH (an FE of 14.7% at –1.5 V) and CH3COOH (an FE of 5.8% at –1.45 V), while only HCOOH was obtained with Cu2O with an FE up to 21.5% (Table S1†). The above results indicated that the production of formate and acetate on Cu2(CuTCPP) was superior to that on the four individual Cu counterparts. Thus, no single component was possibly responsible for the high activity and selectivity of formate and acetate production, while the functionalities of the porphyrin ligand and copper paddle wheel clusters should be reconsidered.
Cathodized reconstruction of Cu2(CuTCPP) nanosheets
The high selectivity and activity towards formate and acetate production with the reductive formation from Cu2(CuTCPP) encouraged us to pursue the “real catalyst”. These structural changes were explored with ex situ XRD, SEM, TEM, XPS and FT-IR characterization.
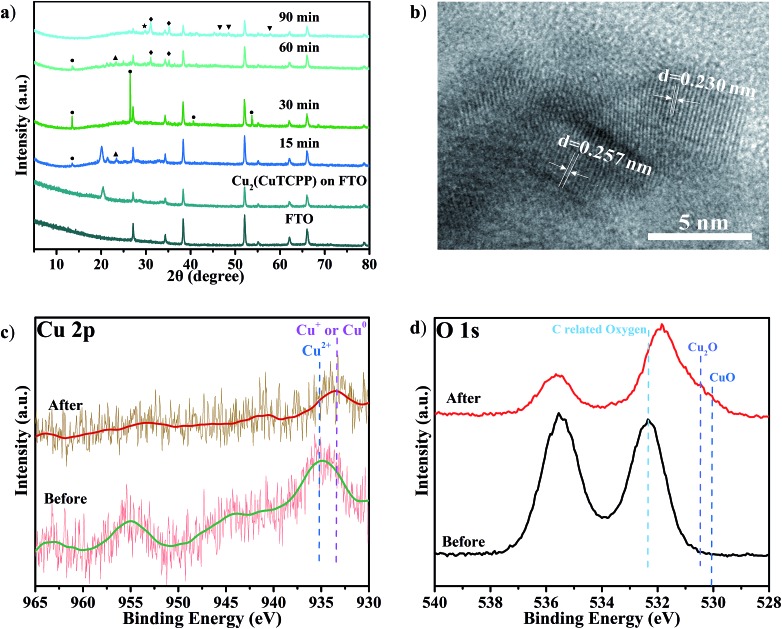
The potential Cu species from the Cu(ii) paddle-wheel nodes during cathodized reconstruction were first revealed at –1.55 V with different reaction times (Fig. 4a and S15†). After the optimal electrocatalysis at –1.55 V for 15 min, the XRD peak of the Cu2(CuTCPP) catalyst on FTO electrodes shifted from 20.39° to a lower value of 20.04° with the appearance of three new peaks (Cu(HCOO)2 at 13.40°, an unassigned peak at 21.37°, and Cu(OH)2 at 23.42°). At 15 min, the morphology changed from well-shaped nanosheets to partially amorphous layered structures (Fig. S16a and S16b†). Then, after 30 min, two XRD peaks disappeared (21.37° and 23.42°), and the peak intensity of Cu(HCOO)2 at 13.40° increased, while three new peaks (Cu(HCOO)2 at 26.55°, 40.68° and 53.74°) appeared. At 30 min, the morphology changed from partially amorphous layered structures to amorphous solid (Fig. S16c†). Next, after 60 min, other XRD peaks of Cu(HCOO)2 disappeared with only one peak at 13.40° remaining, while two peaks at 21.37° and 23.42° were observed again. At the same time, new dendritic structures appeared (Fig. S16d†). Finally, after 90 min, the XRD showed multiple peaks of CuO, Cu2O and Cu4O3, while the amorphous morphology was observed again (Fig. S16e†). These resultant products could be the real active catalysts in regard to the CO2RR results at the same time interval (Fig. 2b).
Fig. 4. (a) XRD of Cu2(CuTCPP) nanosheets on a FTO electrode with different reaction times ([black circle] Cu(HCOO)2; ◆ Cu4O3; ▲ Cu(OH)2; [blacktriangledown] CuO; ★ Cu2O); (b) HRTEM after 5 h reaction; (c) Cu 2p XPS spectra and (d) O 1s XPS spectra of Cu2(CuTCPP) on FTO before and after 5 h reaction. All potentials were set at –1.55 V vs. Ag/Ag+.
Meanwhile, we also performed ex situ XRD and SEM characterization at different voltages (Fig. S17 and S18†). Similar intermediate species, Cu(HCOO)2, and morphology changes were observed with the same confirmed final catalysts CuO, Cu2O and Cu4O3. These continual changes in XRD patterns and SEM pictures at different reaction times and working potentials showed that the Cu2(CuTCPP) catalyst had changed to CuO, Cu2O and Cu4O3 with confirmed intermediates Cu(HCOO)2 and Cu(OH)2. It is worth noting that the above ex situ XRD and SEM monitored cathodization process was fully consistent with the first 1 h current density fluctuation in electrolysis and the CO2RR time course experiment, further confirming the reliability of ex situ characterization techniques in our system.
To further elucidate the final catalyst and active sites of cathodized Cu2(CuTCPP) nanosheets, TEM and XPS were utilized. HRTEM images with d = 0.230 nm for Cu2O (111) and d = 0.257 nm for CuO (111), Cu2O (–111) and/or Cu4O3 (211) were obtained from ex situ cathodized catalysts with a longer electrolysis time of 5 h. Furthermore, the Cu2(CuTCPP) nanosheets and cathodized Cu2(CuTCPP) on FTO electrodes before and after the CO2RR were characterized by XPS (Fig. 4c and d). The spectra of Cu 2p clearly showed that the as-prepared Cu2(CuTCPP) surface has Cu2+ states which are distinct from their lower binding energy states, the Cu+ or Cu0, after 5 h electrocatalysis. Although the binding energies of the Cu+ and Cu0 states were very close in the XPS spectra, Auger spectra could possibly distinguish these two states with overlapped peaks at 569.5 eV and 572.5 eV, which were ascribed to the kinetic energy of Cu+ and Cu2+, respectively.55 Only Cu+ was observed, ruling out the possible existence of metallic copper (Fig. S19†). Meanwhile, XPS O1s spectra also showed that the as-prepared Cu2(CuTCPP) surface has C related oxygen, which was distinctively reduced to the lower binding energy O states associated with Cu2O and CuO after 5 h reaction (Fig. 4d).42 Additional peaks in O 1s spectra were related to chemisorbed oxygen in carboxylic groups or water.56,57
The strong intensity of O 1s XPS peaks indicated the existence of O-containing species. Thus, it is crucial to elucidate the status and possible functionality of the TCPP ligand. First, from the pictures of the electrolyte before and after electrocatalysis, we could exclude the possibility that the porphyrin ligand dissolved in the electrolyte after reaction (Fig. S20†). The NMR spectra further showed no TCPP peaks for the electrolyte samples (Fig. S21†). Second, the peak at 1650 cm–1 in the FT-IR spectrum confirmed that the ligand was still anchored to the surface of the catalyst during the reaction (Fig. S22†).46,47,58 Third, a control experiment in which a physical mixture of CuO and CuTCPP with a molar ratio of 2 : 1 was tested as a catalyst for the CO2RR (Fig. S23†) showed that CuO/CuTCPP was significant to generate both HCOOH (FE of 31.1% at –1.55 V) and CH3COOH (FE of 17.3% at –1.55 V), the FEs being higher than that of individual CuO and CuTCPP (Fig. 3). It is worth noting that our cathodized catalyst was possibly anchored by TCPP through chemical bonds, in which the activity was even better than that of the physical mixture of CuO/CuTCPP. Thus, the inorganic species of the cathodized Cu2(CuTCPP) nanosheets were confirmed as CuO, Cu2O and Cu4O3, while the anchored CuTCPP could synergistically enhance the activity of the final catalyst and result in different selectivities compared to traditional Cu catalysts as well as Cu-MOFs such as HKUST-1.45
Conclusions
This research discovered the high selectivity and efficiency in electrocatalytic CO2 reduction to formate and acetate with cathodized copper porphyrin MOF nanosheets. The comparison with CuO, Cu2O, Cu and CuTCPP counterparts and XRD, XPS, FT-IR and HRTEM studies confirmed the cathodized reconstruction to a mixture of CuO, Cu2O and Cu4O3 anchored with the TCPP ligand. Although inevitable structural changes occurred in the cathodization process, this predesigned feature of 2-D MOF nanosheets will bring precise control over the preparation of electrocatalysts.
Conflicts of interest
There are no conflicts to declare.
Supplementary Material
Acknowledgments
This work is financially supported by the NSFC (No. 21505076), the Young Elite Scholar Support (YESS) Program from CAST, the Program of Jiangsu Specially-Appointed Professor, the NSF of Jiangsu Province of China (No. BK20150967), the Innovation Team Program of Jiangsu Province of China, and the Priority Academic Program Development of Jiangsu Higher Education Institutions.
Footnotes
†Electronic supplementary information (ESI) available: Synthetic experimental details and additional figures (XRD and SEM data). See DOI: 10.1039/c8sc04344b
References
- Takeda H., Ohashi K., Sekine A., Ishitani O. J. Am. Chem. Soc. 2016;138:4354–4357. doi: 10.1021/jacs.6b01970. [DOI] [PubMed] [Google Scholar]
- Bonin J., Robert M., Routier M. J. Am. Chem. Soc. 2014;136:16768–16771. doi: 10.1021/ja510290t. [DOI] [PubMed] [Google Scholar]
- Zhang S., Kang P., Bakir M., Lapides A. M., Dares C. J., Meyer T. J. Proc. Natl. Acad. Sci. U. S. A. 2015;112:15809–15814. doi: 10.1073/pnas.1522496112. [DOI] [PMC free article] [PubMed] [Google Scholar]
- Kang U., Choi S. K., Ham D. J., Ji S. M., Choi W., Han D. S., Abdel-Wahab A., Park H. Energy Environ. Sci. 2015;8:2638–2643. [Google Scholar]
- Yang X., Fugate E. A., Mueanngern Y., Baker L. R. ACS Catal. 2017;7:177–180. [Google Scholar]
- Li F., Chen L., Xue M., Williams T., Zhang Y., MacFarlane D. R., Zhang J. Nano Energy. 2017;31:270–277. [Google Scholar]
- Huo S., Weng Z., Wu Z., Zhong Y., Wu Y., Fang J., Wang H. ACS Appl. Mater. Interfaces. 2017;9:28519–28526. doi: 10.1021/acsami.7b07707. [DOI] [PubMed] [Google Scholar]
- Wu Y., Jiang J., Weng Z., Wang M., Broere D. L. J., Zhong Y., Brudvig G. W., Feng Z., Wang H. ACS Cent. Sci. 2017;3:847–852. doi: 10.1021/acscentsci.7b00160. [DOI] [PMC free article] [PubMed] [Google Scholar]
- Sun Z., Ma T., Tao H., Fan Q., Han B. Chem. 2017;3:560–587. [Google Scholar]
- Huang Y., Handoko A. D., Hirunsit P., Yeo B. S. ACS Catal. 2017;7:1749–1756. [Google Scholar]
- Zhang W., Qin Q., Dai L., Qin R., Zhao X., Chen X., Ou D., Chen J., Chuong T. T., Wu B. Angew. Chem., Int. Ed. 2018;57:9475–9479. doi: 10.1002/anie.201804142. [DOI] [PubMed] [Google Scholar]
- Liu Y., Zhang Y., Cheng K., Quan X., Fan X., Su Y., Chen S., Zhao H., Zhang Y., Yu H. Angew. Chem., Int. Ed. 2017;129:15813–15817. [Google Scholar]
- Verma S., Kim B., Jhong H.-R. M., Ma S., Kenis P. J. A. ChemSusChem. 2016;9:1972–1979. doi: 10.1002/cssc.201600394. [DOI] [PubMed] [Google Scholar]
- Tao H., Sun X., Back S., Han Z., Zhu Q., Robertson A. W., Ma T., Fan Q., Han B., Jung Y., Sun Z. Chem. Sci. 2018;9:483–487. doi: 10.1039/c7sc03018e. [DOI] [PMC free article] [PubMed] [Google Scholar]
- Hod I., Sampson M. D., Deria P., Kubiak C. P., Farha O. K., Hupp J. T. ACS Catal. 2015;5:6302–6309. [Google Scholar]
- Han N., Wang Y., Ma L., Wen J., Li J., Zheng H., Nie K., Wang X., Zhao F., Li Y., Fan J., Zhong J., Wu T., Miller D. J., Lu J., Lee S.-T., Li Y. Chem. 2017;3:652–664. [Google Scholar]
- Zhang X., Wu Z., Zhang X., Li L., Li Y., Xu H., Li X., Yu X., Zhang Z., Liang Y., Wang H. Nat. Commun. 2017;8:14675. doi: 10.1038/ncomms14675. [DOI] [PMC free article] [PubMed] [Google Scholar]
- Costentin C., Drouet S., Robert M., Savéant J.-M. Science. 2012;338:90–94. doi: 10.1126/science.1224581. [DOI] [PubMed] [Google Scholar]
- Kornienko N., Zhao Y., Kley C. S., Zhu C., Kim D., Lin S., Chang C. J., Yaghi O. M., Yang P. J. Am. Chem. Soc. 2015;137:14129–14135. doi: 10.1021/jacs.5b08212. [DOI] [PubMed] [Google Scholar]
- Zhao C., Dai X., Yao T., Chen W., Wang X., Wang J., Yang J., Wei S., Wu Y., Li Y. J. Am. Chem. Soc. 2017;139:8078–8081. doi: 10.1021/jacs.7b02736. [DOI] [PubMed] [Google Scholar]
- Liu Y., Chen S., Quan X., Yu H. J. Am. Chem. Soc. 2015;137:11631–11636. doi: 10.1021/jacs.5b02975. [DOI] [PubMed] [Google Scholar]
- Deng Y., Huang Y., Ren D., Handoko A. D., Seh Z. W., Hirunsit P., Yeo B. S. ACS Appl. Mater. Interfaces. 2018;10:28572–28581. doi: 10.1021/acsami.8b08428. [DOI] [PubMed] [Google Scholar]
- Li F., Chen L., Knowles G. P., MacFarlane D. R., Zhang J. Angew. Chem., Int. Ed. 2017;56:505–509. doi: 10.1002/anie.201608279. [DOI] [PubMed] [Google Scholar]
- Zhang Y., Chen L., Li F., Easton C. D., Li J., Bond A. M., Zhang J. ACS Catal. 2017;7:4846–4853. [Google Scholar]
- Gu J., Héroguel F., Luterbacher J., Hu X. Angew. Chem., Int. Ed. 2018;130:2993–2997. doi: 10.1002/anie.201713003. [DOI] [PubMed] [Google Scholar]
- Sun X., Zhu Q., Kang X., Liu H., Qian Q., Zhang Z., Han B. Angew. Chem., Int. Ed. 2016;55:6771–6775. doi: 10.1002/anie.201603034. [DOI] [PubMed] [Google Scholar]
- Han N., Wang Y., Yang H., Deng J., Wu J., Li Y., Li Y. Nat. Commun. 2018;9:1320. doi: 10.1038/s41467-018-03712-z. [DOI] [PMC free article] [PubMed] [Google Scholar]
- Wang Y., Wang D., Dares C. J., Marquard S. L., Sheridan M. V., Meyer T. J. Proc. Natl. Acad. Sci. U. S. A. 2017:201713962. [Google Scholar]
- Kuhl K. P., Cave E. R., Abram D. N., Jaramillo T. F. Energy Environ. Sci. 2012;5:7050–7059. [Google Scholar]
- Li C. W., Kanan M. W. J. Am. Chem. Soc. 2012;134:7231–7234. doi: 10.1021/ja3010978. [DOI] [PubMed] [Google Scholar]
- Xu M., Yuan S., Chen X.-Y., Chang Y.-J., Day G., Gu Z.-Y., Zhou H.-C. J. Am. Chem. Soc. 2017;139:8312–8319. doi: 10.1021/jacs.7b03450. [DOI] [PubMed] [Google Scholar]
- Rodenas T., Luz I., Prieto G., Seoane B., Miro H., Corma A., Kapteijn F., Llabrés i Xamena F. X., Gascon J. Nat. Mater. 2014;14:48. doi: 10.1038/nmat4113. [DOI] [PMC free article] [PubMed] [Google Scholar]
- Zhu L., Liu X.-Q., Jiang H.-L., Sun L.-B. Chem. Rev. 2017;117:8129–8176. doi: 10.1021/acs.chemrev.7b00091. [DOI] [PubMed] [Google Scholar]
- Zheng H., Zhang Y., Liu L., Wan W., Guo P., Nyström A. M., Zou X. J. Am. Chem. Soc. 2016;138:962–968. doi: 10.1021/jacs.5b11720. [DOI] [PubMed] [Google Scholar]
- Kumar R. S., Kumar S. S., Kulandainathan M. A. Electrochem. Commun. 2012;25:70–73. [Google Scholar]
- Albo J., Vallejo D., Beobide G., Castillo O., Castaño P., Irabien A. ChemSusChem. 2017;10:1100–1109. doi: 10.1002/cssc.201600693. [DOI] [PubMed] [Google Scholar]
- Hinogami R., Yotsuhashi S., Deguchi M., Zenitani Y., Hashiba H., Yamada Y. ECS Electrochem. Lett. 2012;1:H17–H19. [Google Scholar]
- Ye L., Liu J., Gao Y., Gong C., Addicoat M., Heine T., Wöll C., Sun L. J. Mater. Chem. A. 2016;4:15320–15326. [Google Scholar]
- Li W. H., Ding K., Tian H. R., Yao M. S., Nath B., Deng W. H., Wang Y., Xu G. Adv. Funct. Mater. 2017;27:1702067. [Google Scholar]
- Wang Y., Hou P., Wang Z., Kang P. ChemPhysChem. 2017;18:3142–3147. doi: 10.1002/cphc.201700716. [DOI] [PubMed] [Google Scholar]
- Zhao S., Wang Y., Dong J., He C.-T., Yin H., An P., Zhao K., Zhang X., Gao C., Zhang L. Nat. Energy. 2016;1:16184. [Google Scholar]
- Lee S. Y., Jung H., Kim N.-K., Oh H.-S., Min B. K., Hwang Y. J. J. Am. Chem. Soc. 2018;140:8681–8689. doi: 10.1021/jacs.8b02173. [DOI] [PubMed] [Google Scholar]
- Grosse P., Gao D., Scholten F., Sinev I., Mistry H., Roldan Cuenya B. Angew. Chem., Int. Ed. 2018;130:6300–6305. doi: 10.1002/anie.201802083. [DOI] [PubMed] [Google Scholar]
- Weng Z., Wu Y., Wang M., Jiang J., Yang K., Huo S., Wang X.-F., Ma Q., Brudvig G. W., Batista V. S., Liang Y., Feng Z., Wang H. Nat. Commun. 2018;9:415. doi: 10.1038/s41467-018-02819-7. [DOI] [PMC free article] [PubMed] [Google Scholar]
- Nam D.-H., Bushuyev O. S., Li J., De Luna P., Seifitokaldani A., Dinh C.-T., García de Arquer F. P., Wang Y., Liang Z., Proppe A. H., Tan C. S., Todorović P., Shekhah O., Gabardo C. M., Jo J. W., Choi J., Choi M.-J., Baek S.-W., Kim J., Sinton D., Kelley S. O., Eddaoudi M., Sargent E. H. J. Am. Chem. Soc. 2018;140:11378–11386. doi: 10.1021/jacs.8b06407. [DOI] [PubMed] [Google Scholar]
- Xu G., Otsubo K., Yamada T., Sakaida S., Kitagawa H. J. Am. Chem. Soc. 2013;135:7438–7441. doi: 10.1021/ja402727d. [DOI] [PubMed] [Google Scholar]
- Xu G., Yamada T., Otsubo K., Sakaida S., Kitagawa H. J. Am. Chem. Soc. 2012;134:16524–16527. doi: 10.1021/ja307953m. [DOI] [PubMed] [Google Scholar]
- Zhu Q., Ma J., Kang X., Sun X., Liu H., Hu J., Liu Z., Han B. Angew. Chem., Int. Ed. 2016;128:9158–9162. [Google Scholar]
- Rosen B. A., Salehi-Khojin A., Thorson M. R., Zhu W., Whipple D. T., Kenis P. J., Masel R. I. Science. 2011:1209786. doi: 10.1126/science.1209786. [DOI] [PubMed] [Google Scholar]
- Sun X., Kang X., Zhu Q., Ma J., Yang G., Liu Z., Han B. Chem. Sci. 2016;7:2883–2887. doi: 10.1039/c5sc04158a. [DOI] [PMC free article] [PubMed] [Google Scholar]
- Huan T. N., Simon P., Benayad A., Guetaz L., Artero V., Fontecave M. Chem.–Eur. J. 2016;22:14029–14035. doi: 10.1002/chem.201602618. [DOI] [PubMed] [Google Scholar]
- Huan T. N., Andreiadis E. S., Heidkamp J., Simon P., Derat E., Cobo S., Royal G., Bergmann A., Strasser P., Dau H. J. Mater. Chem. A. 2015;3:3901–3907. [Google Scholar]
- Schouten K. J. P., Kwon Y., van der Ham C. J. M., Qin Z., Koper M. T. M. Chem. Sci. 2011;2:1902–1909. [Google Scholar]
- Mistry H., Varela A. S., Bonifacio C. S., Zegkinoglou I., Sinev I., Choi Y.-W., Kisslinger K., Stach E. A., Yang J. C., Strasser P., Cuenya B. R. Nat. Commun. 2016;7:12123. doi: 10.1038/ncomms12123. [DOI] [PMC free article] [PubMed] [Google Scholar]
- Deng F., Li N., Tang S., Liu C., Yue H., Liang B. Chem. Eng. J. 2018;334:1943–1953. [Google Scholar]
- Fan L.-Z., Qiao S., Song W., Wu M., He X., Qu X. Electrochim. Acta. 2013;105:299–304. [Google Scholar]
- Fan L.-Z., Liu J.-L., Ud-Din R., Yan X., Qu X. Carbon. 2012;50:3724–3730. [Google Scholar]
- Tu W., Lei J., Wang P., Ju H. Chem.–Eur. J. 2011;17:9440–9447. doi: 10.1002/chem.201100577. [DOI] [PubMed] [Google Scholar]
Associated Data
This section collects any data citations, data availability statements, or supplementary materials included in this article.


