Abstract
Purpose
To test the hypothesis that high glucose and matrix metalloproteinases (MMPs) contribute to the diabetes-induced loss of platelet endothelial cell adhesion molecule-1 (PECAM-1) in the retinal microvasculature.
Methods
PECAM-1 and MMP protein, activity, and interactions with PECAM-1 were assessed using western blotting, zymography, immunofluorescence, or coimmunoprecipitation assays. These assays were conducted using primary rat retinal microvascular endothelial cells (RRMECs) grown either in normal glucose (5 mM) or high glucose (25 mM) conditions and using retinas collected from streptozotocin-induced diabetic or control rats. The broad-spectrum MMP inhibitor GM6001 was administered in vivo and in vitro to ascertain the role of MMPs in the hyperglycemia-induced loss of PECAM-1.
Results
A dramatic decrease in PECAM-1 (western blotting, immunofluorescence) was observed in both the diabetic retina and in hyperglycemic RRMECs. The decrease in PECAM-1 was accompanied by a significant increase in the presence and activity of matrix metalloproteinase-2 (MMP-2) (but not matrix metalloproteinase-9 [MMP-9]) in the diabetic plasma (P < 0.05) and in hyperglycemic RRMECs (P < 0.05). Moreover, RRMEC PECAM-1 significantly decreased when treated with plasma collected from diabetic rats. Several MMP-2 cleavage sites on PECAM-1 were identified using in silico analysis. Moreover, PECAM-1/MMP-2 interactions were confirmed using coimmunoprecipitation. PECAM-1 was significantly decreased in RRMECs treated with MMP-2 (P < 0.05), but became comparable to controls with the MMP inhibitor GM6001 in both the diabetic retina and hyperglycemic RRMECs.
Conclusions
These results indicate a possible role of MMP-2 in hyperglycemia-induced PECAM-1 loss in retinal endothelial cells.
Keywords: diabetes, retina, PECAM-1, MMPs, endothelial cells
Diabetic retinopathy (DR) is one of the leading causes of blindness among working-age adults, affecting approximately 100 million people worldwide.1 DR is characterized by changes to the retinal microvasculature, primarily as a result of hyperglycemia, such as the formation of microaneurysms, cotton-wool spots, neovascularization, and increased vascular permeability because of the breakdown of the blood–retinal barrier.2,3 In recent years, several therapies and strategies have been developed to manage DR; however, there is still a lack of understanding in the molecular mechanisms leading to DR development in its early stages. The identification of these mechanisms may be able to provide therapeutic targets in managing DR.
A healthy endothelium and microvasculature are essential to ensure adequate function of retinal neurons, and any dysregulation of endothelial cells, such as altered adhesion molecule expression, can have detrimental consequences. Previous studies from the retina have found a diabetes-induced increase in intercellular adhesion molecule-1,4,5 but a decrease in platelet endothelial cell adhesion molecule-1 (PECAM-1),6,7 with the latter playing important roles in maintaining vascular integrity. The decrease in PECAM-1 is not likely to be a result of a change in the number of endothelial cells in the early weeks of diabetes in rodents, as we have found no changes in retinal capillary density in diabetic rats or mice when compared with controls.8,9
PECAM-1 is a cell surface protein that is heavily expressed on the surface of endothelial cells,10 specifically in the cell–cell junction, and has important functions in the endothelium such as cell–cell adhesion, leukocyte transmigration, cell signaling, and barrier function.11–14 The 130-kD protein belongs to the immunoglobulin (Ig) gene superfamily with an immunoreceptor tyrosine inhibitory motif and is composed of six extracellular Ig-like domains (570 aa), a transmembrane domain (22 aa), and a complex cytoplasmic domain (118 aa).11,15 PECAM-1 suppresses programmed cell death in an immunoreceptor tyrosine inhibitory motif–dependent inhibition of pro-apoptotic signaling and transmits prosurvival signals.16 In addition, PECAM-1 is a member of a mechanosensory complex mediating cell responses to fluid shear stress,17 such as the modulation of the shear stress-induced activation of Akt and endothelial nitric oxide synthase (eNOS) by tyrosine phosphorylation.18 One of the hallmarks of DR is the increase in vascular permeability, leading to the leakage of plasma components into the surrounding tissue and resulting in macular edema and eventual vision loss.2,3,19–21 Furthermore, studies have demonstrated that PECAM-1 to PECAM-1 homophilic interactions are required for the maintenance of vascular endothelial cell barrier function.2,13,14,22–24 Thus, if a loss of PECAM-1 occurs, it can affect this interaction and disrupt the blood retinal barrier, with a possible onset of edema. Many factors can influence the expression of cell surface proteins such as PECAM-1, one of which is cleavage by matrix metalloproteinases (MMPs).25
MMPs are calcium-dependent, zinc-containing endopeptidases that have major roles in extracellular matrix remodeling, wound healing, and neovascularization.26 MMPs can be divided into families according to their substrates, which include extracellular matrix proteins such as collagens, gelatins, and fibronectins and non–extracellular matrix proteins such as chemokines, cytokines, membrane proteins, proteoglycans, and receptors.26,27 Studies have demonstrated that PECAM-1 can be cleaved by MMPs such as matrix metalloproteinase-2 (MMP-2) and matrix metalloproteinase-9 (MMP-9).28–31 Furthermore, MMPs have been shown to increase in diabetes,32 but to our knowledge, no studies have been performed to link their activity with the diabetes-induced loss of PECAM-1.
Therefore, the goal of the current study is to test the hypothesis that hyperglycemia induces a loss of PECAM-1 from the retinal microcirculation, with this loss mediated by MMPs.
Materials and Methods
Animals
Wistar rats (100-120 g; Envigo, Indianapolis, IN, USA) were purchased for use in a model of type I diabetes. The experimental protocols were approved by the Institutional Animal Care and Use Committee of Louisiana State University Health Sciences Center-Shreveport (Shreveport, LA, USA) and adhere to the ARVO Statement for the Use of Animals in Ophthalmic and Vision Research.
Experimental Model of Type I Diabetes in Rats
For our animal studies, we injected age-matched male Wistar rats with either vehicle (sodium citrate buffer, control) or streptozotocin (STZ, diabetic), 30 mg/kg/day, for 3 consecutive days to elicit a model of type I diabetes. Rats with a nonfasting glucose level of >300 mg/dl were considered hyperglycemic, with control nonfasting glucose values of ∼150 mg/dl for control rats. The endpoint was eight weeks after the induction of hyperglycemia, at which time the rats were anesthetized with ketamine/pentobarbital (100 and 50 mg/kg, respectively). Blood samples were collected using femoral vein cannulation for plasma collection, the eyes were enucleated, and the retinas were collected to be further analyzed. For inhibitory studies, the broad-spectrum MMP inhibitor GM6001 (Millipore Sigma, Burlington, MA, USA) was used. Sterile eye drops (25 μl/eye; Major Pharmaceuticals, Livonia, MI, USA) containing either GM6001 (4 mM) or vehicle (0.5% dimethyl sulfoxide (DMSO) in sterile water, controls) were administered twice daily for 2 weeks starting at 6 weeks post STZ injections.
Cell Culture and Treatments
Primary rat retinal microvascular endothelial cells (RRMECs; Cell Biologics, Chicago, IL, USA) were cultured in Dulbecco's modified eagle media containing 10% fetal bovine serum under normal glucose conditions (NG; 5 mM) or high glucose conditions (HG; 25 mM) for 6 days to reach confluency. To study the effects of osmolarity on PECAM-1 loss in RRMECs, solutions were added with equivalent osmolarity to high glucose (mannitol and dextran, 20 mM; sodium chloride (NaCl), 10 mM; Sigma-Aldrich, St. Louis, MO, USA) for 6 days. In selected cultures, RRMECs grown under HG or NG conditions were treated for 6 days with 10% plasma collected under sterile conditions from either control or diabetic rats. For inhibitory studies, GM6001 (5 μM) or vehicle were added to RRMECs grown under NG or HG conditions for 24 hours. Prior to the use of MMP-2 (R&D Systems, Minneapolis, MN, USA), the MMP was activated using 4-aminophenylmercuric acetate (APMA; Sigma-Aldrich). Briefly, APMA (10 mM) was dissolved in a 0.1 mM sodium hydroxide (NaOH) solution, then diluted to 2.5 mM APMA using 1 mM calcium chloride (CaCl2) in PBS solution. For MMP-2 activation, APMA was incubated at 37°C for 1 hour with MMP-2 (1:10 dilution) to achieve a stock concentration of 44 μg/ml. Activated MMP-2 was added to the RRMECs (50, 100, 200, 400 ng/ml) for 24 hours.
Western Blotting
Briefly, retinas or RRMECs were collected and lysed in radio immunoprecipitation assay (RIPA) buffer-containing protease inhibitors (Sigma-Aldrich), and a sample buffer under reducing and denaturing conditions was added for western blot analysis. Blood was collected from the rats and centrifuged at 10,000g for 10 minutes at 4°C to obtain plasma, and the platelets were collected as described below. Protein concentrations were determined using the Pierce BCA protein assay (Thermo Fisher Scientific, Waltham, MA, USA). Serial dilutions of total protein were loaded to the gel to ensure that the chosen protein concentration band intensity was not in a saturation region. We tested samples that do not express PECAM-1 (smooth muscle cells) as a negative control. Equal amounts of protein were loaded on 8% to 12% SDS-polyacrylamide gels, and the proteins were transferred to nitrocellulose membranes. After using a blocking buffer, the membranes were immunoblotted with primary antibodies (PECAM-1; Santa Cruz Biotechnology, Dallas, TX, USA; MMP-2 and MMP-9, Abcam, Cambridge, MA, USA) overnight at 4°C followed by horeradish peroxidase (HRP)-conjugated secondary antibody incubation for 1 hour at room temperature (RT). β-actin (Sigma-Aldrich) was used as a loading control to ensure equal loading of protein and proper transfer. For plasma/platelet western blotting, a total protein using Ponceau stain (Sigma-Aldrich) was used as a loading and transfer control. Specific bands were detected with an electrochemiluminescent system (Bio-Rad, Hercules, CA, USA), imaged using the ChemiDoc XRS gel imaging system (Bio-Rad), and quantified by densitometry (ImageJ, National Institutes of Health, Bethesda, MD, USA).
Platelet Collection for Western Blotting
Blood obtained from control or diabetic rats was collected with 1:6 acid-citrate-dextrose buffer (39 mM citric acid, 75 mM sodium citrate, 135 mM dextrose, pH 7.4) and centrifuged at 286g for 8 minutes at RT. The collected platelet-rich plasma was further centrifuged at 286g for 8 minutes to remove any red blood cell contamination. The resultant platelet-rich plasma was centrifuged at 14000g for 10 minutes at RT to collect platelets. The platelet pellet was resuspended in RIPA buffer with a protease inhibitor and stored at −80°C until further analysis.
Immunoprecipitation
RRMECs were washed in cold PBS and lysed in cold lysis buffer (50 mM tris-hydrochloride (HCL) pH 7.6, 150 mM NaCl, 1% Triton X-100, 1% sodium deoxycholate, 0.1% SDS, 1 mM EDTA) containing protease inhibitors (Sigma). Primary antibodies were incubated with SureBeads magnetic beads (Bio-Rad) for 10 minutes at RT. The cellular lysate was added to the antibody–beads complex and incubated for 1 hour at RT. Immunocomplexes were washed and resuspended in 1X Laemmli buffer (Bio-Rad) and were subjected to an SDS-PAGE western blot for coimmunoprecipitation analysis.
Zymography
The MMP activities in the plasma, RRMECs, and media collected from the cell cultures were assessed using gelatin zymography. Briefly, equal amounts of samples were run under nonreducing, nondenaturing conditions on 10% SDS-polyacrylamide gels containing 1% gelatin. After washing in a 2.5% Triton-X100 buffer at RT for 2 hours, the gels were incubated overnight in a 50 mM Tris-HCl, pH 7.5, 200 mM NaCl, 5 mM CaCl2 buffer at 37°C to activate the digestion of gelatin by MMPs. The gels were stained with 0.5% Coomassie brilliant blue R-250 (Sigma) in 30% ethanol and 10% acetic acid–staining solution for 1 hour at RT. The gels were then destained with 2% acetic acid solution to visualize the digested band. The gel images were taken using the ChemiDoc XRS gel imaging system (Bio-Rad), and the unstained bands that represent MMP digestion were inverted and quantified using ImageJ (National Institutes of Health).
In Silico Analysis of MMP Cleavage Sites
A Protease Specificity Prediction Server (PROSPER; Monash University, Victoria, Australia33) was used to confirm PECAM-1 as a substrate of MMPs, and to predict the possible cleavage sites. Rat PECAM-1 amino acid sequence (UniProt Consortium, Wellcome Trust Genome Campus, Hinxton, UK) was used to predict the possible cleavage by MMPs.
Immunofluorescence Staining
The retinas were fixed in ice-cold 80% methanol/20% DMSO and then blocked for 24 hours at 4°C in a solution containing 5% BSA and 1% Triton X-100. The anti-PECAM-1 antibody (Santa Cruz Biotechnology) was incubated for 72 hours at 4°C and followed by fluorescently conjugated secondary antibodies overnight at 4°C. The retinas were flat mounted and viewed with a NIKON E600FN fluorescent microscrope (Nikon Instruments, Melville, NY, USA). Different primary antibody dilutions were used to eliminate oversaturated signals. To test for specific staining, the retinas with secondary antibody only were used as controls to account for any nonspecific staining. For cell culture staining, the RRMECs were fixed then permeabilized with 0.1% Triton-X100 and followed by blocking in 5% BSA, 10% fetal bovine serum for 1 hour at RT. The anti-PECAM-1 antibody (Santa Cruz Biotechnology) was added for overnight incubation at 4°C. Fluorescently conjugated secondary antibodies were added to the cells and left to incubate for 1 hour at RT. Mounting medium-containing 4′,6-diamidino-2-phenylindole (DAPI) (Vector Labs, Burlingame, CA, USA) was added to the cells, and pictures were taken using a NIKON E600FN fluorescent microscope and analyzed using ImageJ (National Institutes of Health). Nonspecific staining was accounted for by using secondary antibodies only, and cell immunostaining intensity was normalized to the number of cells using a DAPI nuclear stain to account for variation in cell numbers.
Statistical Analysis
Statistical analyses were performed using GraphPad (La Jolla, CA, USA) Prism software. Student t-tests or one-way analysis of variance were used to compare the group means, followed by Student-Newman-Keuls post hoc correction. All data are presented as mean ± standard error, with P < 0.05 considered statistically significant.
Results
Decrease of PECAM-1 in the Diabetic Retina
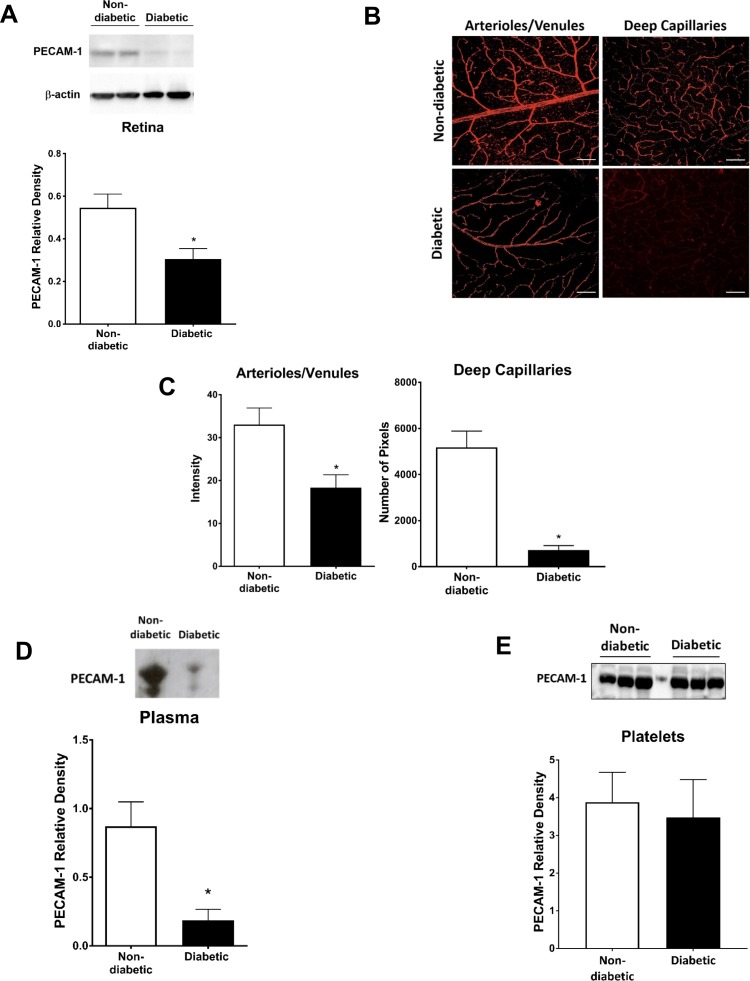
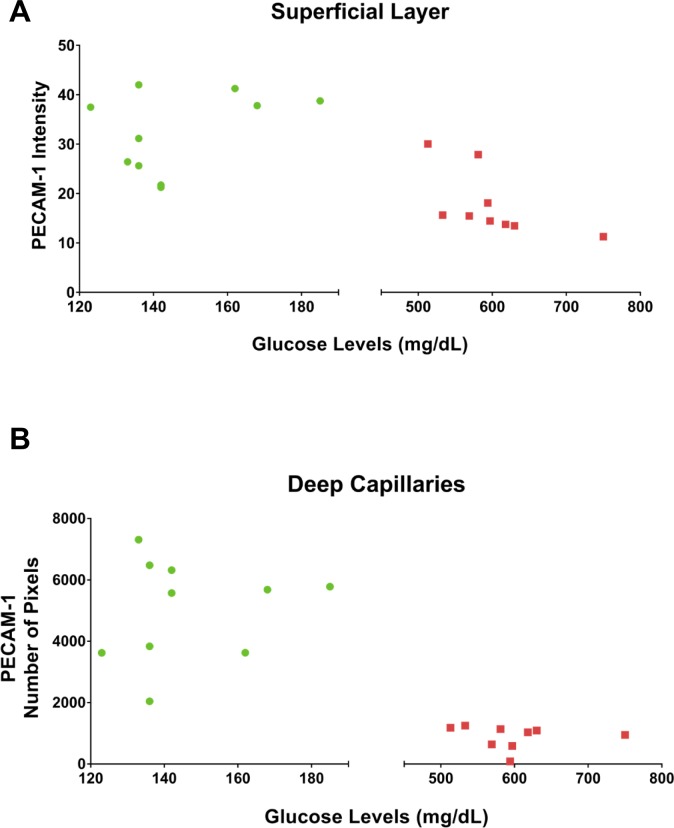
A significant decrease in PECAM-1 in diabetic rats when compared with controls was observed using western blots of retinal tissue (Fig. 1A; P < 0.05) and immunofluorescent staining of retinal flat mounts (Fig. 1B). For the latter, the decrease in the mean staining intensity was ∼50% in the superficial arterioles and venules (P < 0.05), and ∼85% in the deep capillary layer (P < 0.001) as shown in Figure 1C. No differences in central versus peripheral expression of PECAM-1, or its loss in the STZ rats, were noted. Moreover, plasma PECAM-1 was analyzed via western blotting, with a significant decrease of ∼80% in mean band density (P < 0.05) in STZ rats when compared with controls (Fig. 1D). Interestingly, no significant changes were observed in diabetic platelet PECAM-1 mean band density when compared with controls (Fig. 1E). To investigate the effect of disease severity on retinal PECAM-1 levels in the diabetic rats, a comparison between glucose levels and PECAM-1 intensity in the diabetic retina was conducted (Fig. 2). Within the diabetic rat group (glucose values > 500 mg/dl), there was a nonsignificant tendency for less PECAM-1 with higher glucose levels in the superficial vessels (Fig. 2A), but no such tendency in the deep capillaries (Fig. 2B).
Figure 1.
PECAM-1 was significantly decreased in the retina of diabetic rats. The decrease in PECAM-1 was determined via western blotting of retinal tissue (A) and immunostaining of retinal flatmounts (B); scale bar: = 100 μm. Immunostaining intensity is shown in the superficial retina and the number of pixels exceeding background levels in the capillary layer (C). PECAM-1 mean band densities were significantly reduced in the diabetic plasma (D), but not on the diabetic platelets (E). Western blotting data is a comparison of the relative PECAM-1/β-actin (retina) or PECAM-1/total protein (plasma, platelets) band densities. *P < 0.05, N = 5 to 9 per group.
Figure 2.
The effect of glucose levels on retinal PECAM-1 intensity in diabetic rats. Glucose levels versus PECAM-1 intensity in superficial layer vessels (A) and deep capillaries (B) of rat retinas.
Linearity and Specificity of PECAM-1 Staining
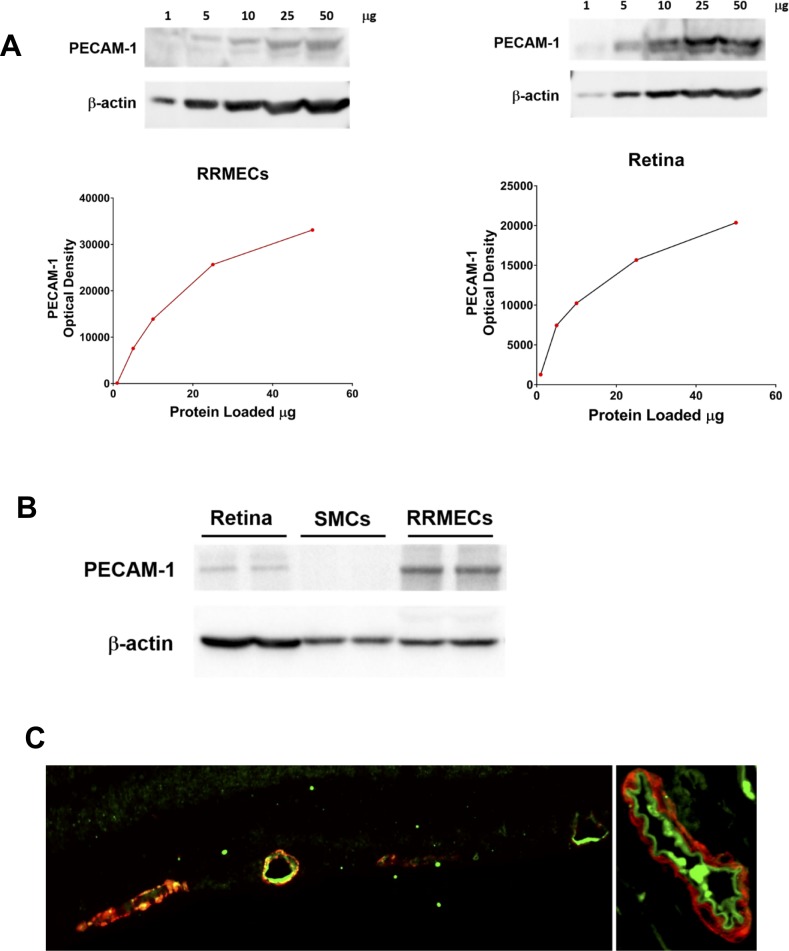
To validate the immunochemical approach, different dilutions of total proteins from RRMECs and retinas were loaded on gels, with the protein load used for this study (10–15 μg) in the area that does not produce a plateau in the signal (Fig. 3A). These data indicate that a decrease in the optical density of the PECAM-1 band (e.g., in hyperglycemia) may underestimate the actual decrease in protein levels if not in the linear range. To validate for specificity, smooth muscle cells that do not express the protein of interest were used as a negative control (Fig. 3B). Similarly, for immunofluorescence imaging, PECAM-1 staining was specific to the luminal side of the vessel, that is, the endothelial cell surface, indicating the specificity of our staining and antibody (Fig. 3C).
Figure 3.
Linearity and specificity of PECAM-1 staining. (A) Optical density of PECAM-1 western blot bands with different amounts of total protein loaded: (left) RRMECs, (right) retinal homogenates. (B) A western blot showing PECAM-1 bands for retinal homogenate, smooth muscle cells (SMCs) and RRMECs. (C) A cross-section of a retinal microvessel (left) and a cross-section of a central retinal artery (right): PECAM-1 (green) and α-smooth muscle actin (red).
Hyperglycemia-Induced PECAM-1 Loss in RRMECs
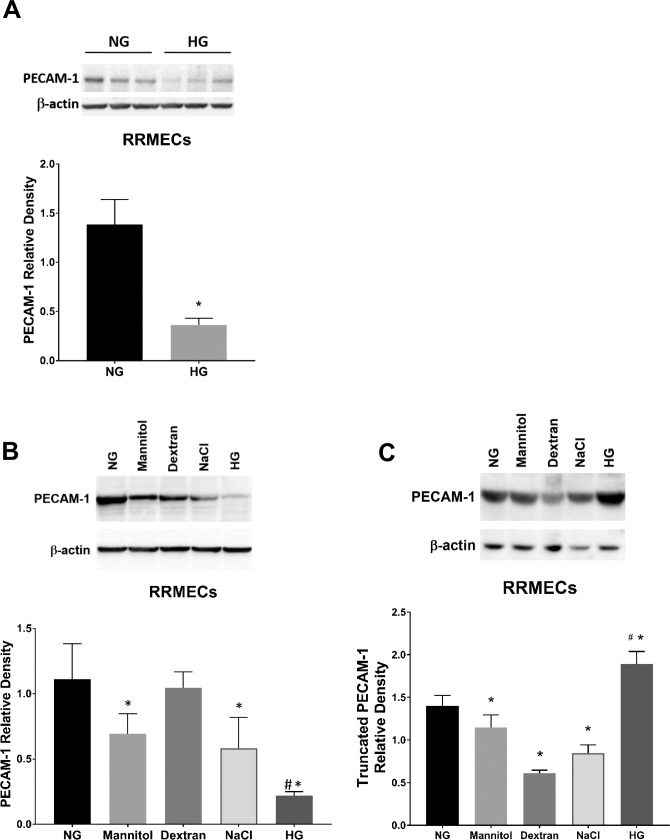
Hyperglycemia is considered the main effector in microvascular damage as a result of diabetes.34 To verify the effects of high glucose on retinal PECAM-1 levels in endothelial cells, we established an in vitro model of hyperglycemia using primary RRMECs. Primary RRMECs between passages 7 to 9 were grown under NG (5 mM) or HG (25 mM) conditions for 6 days to establish confluency. We observed a significant decrease in PECAM-1 mean band density in RRMECs grown under HG conditions (66%–80% decrease, P < 0.05; Figs. 4A, 4B). To determine the possible effects of osmolarity on PECAM-1 loss, we tested various solutions at the same osmolarity as HG media (20 mOsm higher than NG) including mannitol, dextran, and sodium chloride. Although we observed a loss of PECAM-1 mean band density with mannitol (37% decrease, P < 0.05) and sodium chloride (48% decrease, P < 0.05) when compared with controls, the HG had the most significant loss of PECAM-1. These results indicate a role of hyperglycemia in PECAM-1 loss, with osmolarity a possible but not definitive contributor. Interestingly, we found an increase in truncated PECAM-1 fragments (∼20 kD) under hyperglycemic conditions (Fig. 4C), indicating a possible cleavage of PECAM-1 leading to its loss. Moreover, the same mechanism does not seem to be responsible for the loss of PECAM-1 induced by mannitol or NaCl, with decreased rather than increased amounts of truncated PECAM-1.
Figure 4.
Hyperglycemia-induced PECAM-1 loss in RRMECs. (A) PECAM-1 mean band densities were significantly reduced in RRMECs grown under high glucose conditions. (B) PECAM-1 in RRMECs incubated with equal osmolarity to HG media. (C) Truncated PECAM-1 was increased in RRMECs under hyperglycemic conditions. Western blotting data is a comparison of the relative PECAM-1/β-actin band densities. *P < 0.05 versus NG, #P < 0.05 versus NaCl, dextran, and mannitol; N = 3 per group.
Diabetic Plasma Induces PECAM-1 Loss
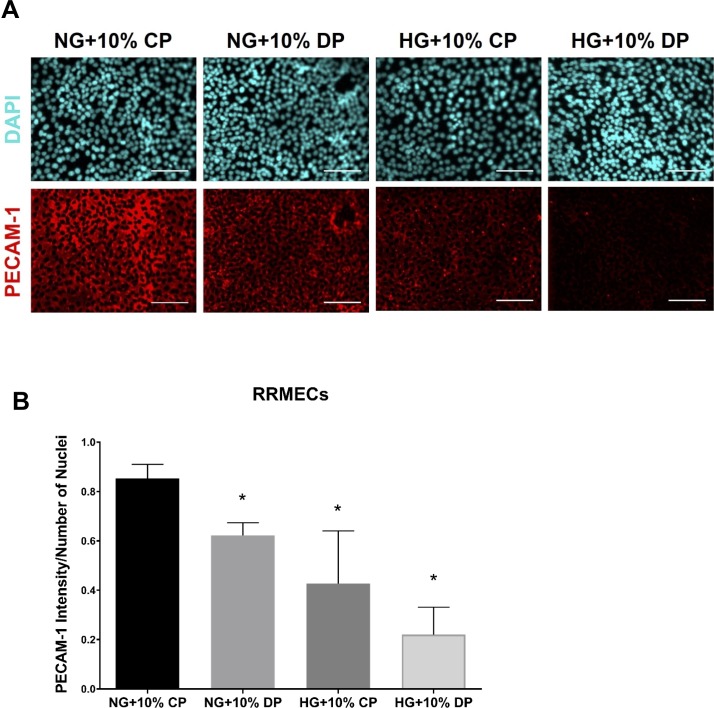
PECAM-1 is a cell surface protein and thus exposed to factors circulating in the plasma. To test the hypothesis that plasma factors may influence endothelial PECAM-1 expression, we treated cells grown under NG or HG conditions with 10% plasma collected from nondiabetic or diabetic rats. RRMECs grown in NG conditions and treated with 10% diabetic plasma had a significantly lower level of PECAM-1 intensity than cells treated with control plasma alone (27% decrease, P < 0.05; Fig. 5). The loss of PECAM-1 mean staining intensity was greatest when cells were grown under HG conditions and treated with diabetic plasma (74% decrease, P < 0.05).
Figure 5.
Diabetic plasma induces PECAM-1 loss. (A) Representative images showing PECAM-1 immunostaining with control (CP) or diabetic (DP) plasma treatments; scale bar: = 50 μm. Quantification of immunostaining intensity in treated RRMECs is shown in panel (B). *P < 0.05, N = 3 per group.
MMP Levels Under Hyperglycemic Conditions
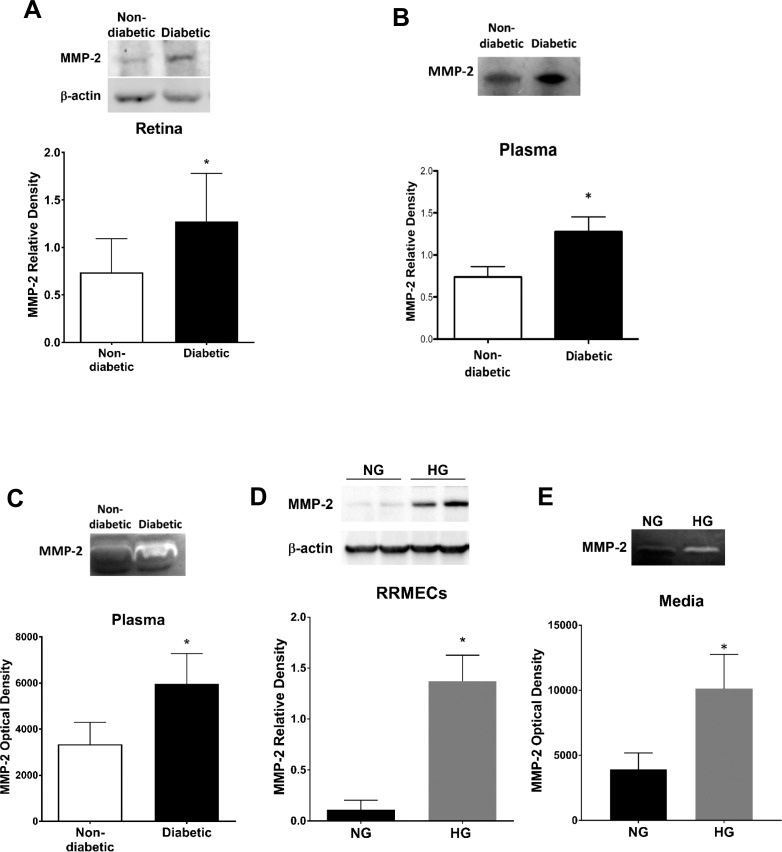
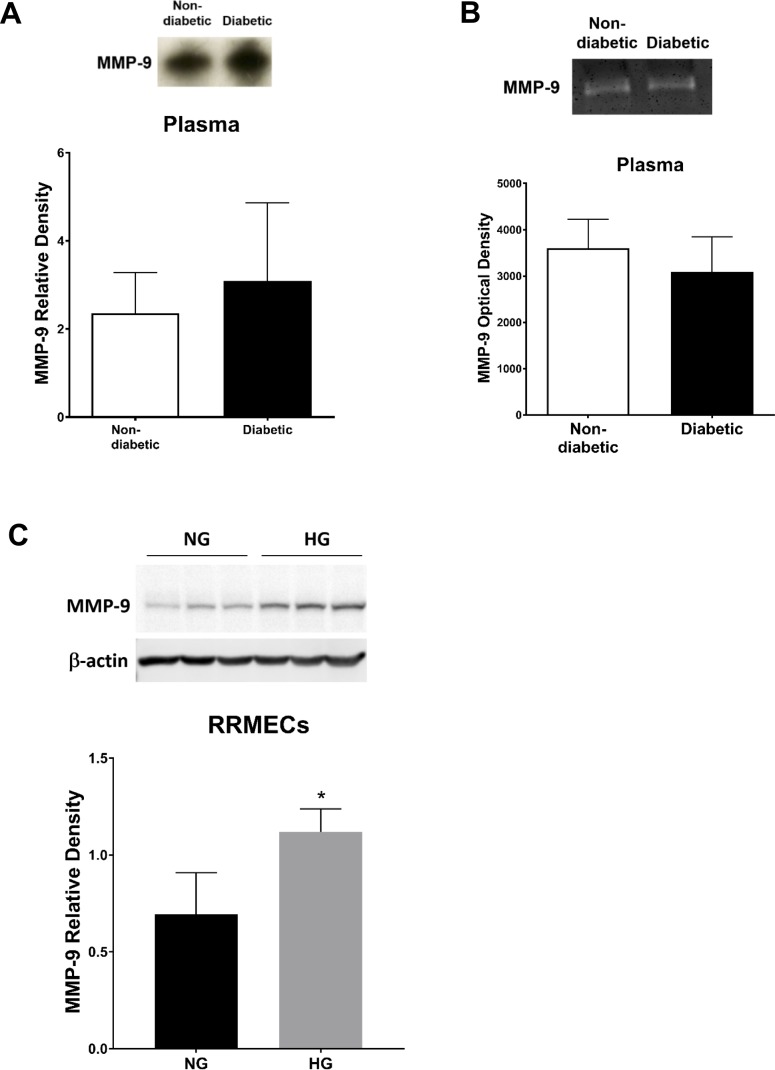
Western blots of plasma and retinal samples from diabetic rats revealed a significant increase in MMP-2 mean band density (∼2-fold increase, P < 0.05; Figs. 6A, 6B), with a significant and roughly equivalent increase in MMP-2 activity in diabetic rat plasma (P < 0.05; Fig. 6C). Moreover, RRMECs showed a significant increase in MMP-2 mean band density (∼12-fold increase, P < 0.05), accompanied by an increase in activity in the collected media (P < 0.05) when grown under high glucose conditions (Figs. 6D, 6E). We found no change in MMP-9 mean band density or activity in diabetic rat plasma (Figs. 7A, 7B). MMP-9 mean band density was significantly increased in RRMECs grown under hyperglycemic conditions when compared with controls (Fig. 7C); however, this 62% increase was far smaller than the 1200% increase in MMP-2 (Fig. 6D).
Figure 6.
MMP-2 levels are significantly increased under hyperglycemic conditions. Western blot analyses of MMP-2 in (A) rat retina and (B) rat plasma. (C) MMP-2 activity (zymography) in rat plasma. (D) MMP-2 western blots from RRMECs grown under NG or HG conditions. (E) MMP-2 supernatant activity in NG or HG RRMECs. Western blotting data is a comparison of the relative MMP-2/β-actin (retina, RRMECs) band densities or MMP-2/total protein (plasma). *P < 0.05 versus NG; N = 5 to 8 per group in vivo and N = 3 per group in vitro.
Figure 7.
MMP-9 in the retina and in RRMECs. (A) MMP-9 western blots and (B) activity in rat plasma. (C) MMP-9 in NG and HG RRMECs. Western blotting data is a comparison of the relative MMP-9/β-actin (RRMECs) or MMP-9/total protein (plasma) band densities. *P < 0.05 versus NG; N = 5 to 8 per group in vivo and N = 3 per group in vitro.
MMP-2 Decreases PECAM-1 Levels in RRMECs
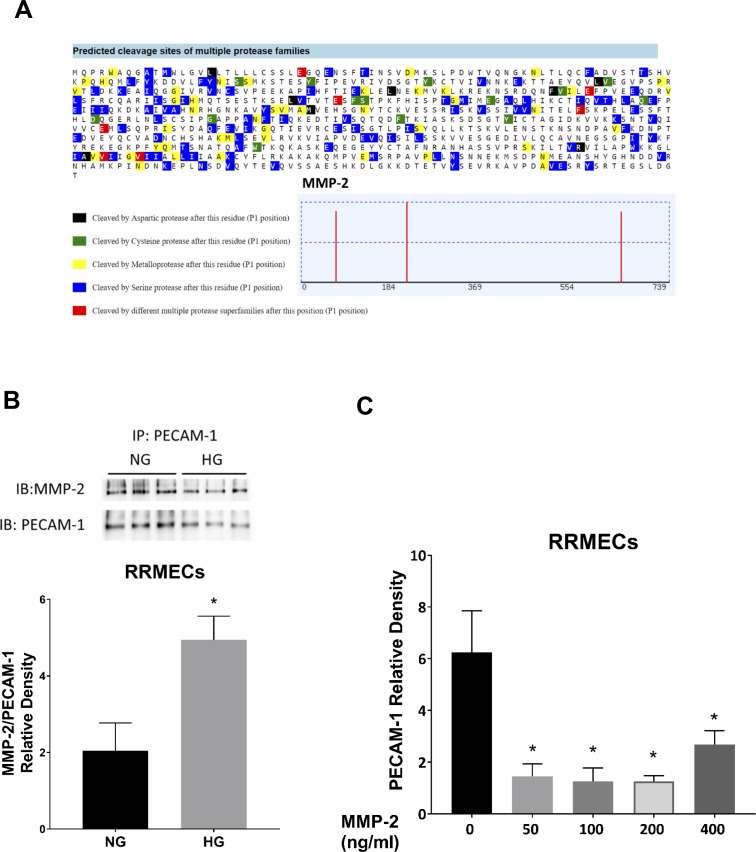
We examined possible cleavage sites by MMP-2 using PROSPER, a webserver used to predict protease cleavage sites and substrates in silico.33 We found three possible cleavage sites on PECAM-1 by MMP-2, generating N-terminus fragments ranging between 25 to 75 kDa and c-terminus fragments ranging between 11 to 61 kDa (Fig. 8A). Furthermore, we verified PECAM-1/MMP-2 interactions using immunoprecipitation in RRMECs (Fig. 8B), with this interaction not only present in NG conditions, but also possibly increased in HG conditions when normalized to the western blot mean densities of PECAM-1. To further investigate a role for MMPs in PECAM-1 loss, we treated confluent RRMECs with MMP-2 (50–400 ng/ml) for 24 hours and observed a significant decrease at all concentrations (Fig. 8C). Together, these data demonstrate a possible role for MMPs in the diabetes-induced loss of PECAM-1 in the retina.
Figure 8.
MMP-2 decreases PECAM-1 levels in RRMECs. (A) In silico analysis using PROSPER showing possible PECAM-1 cleavage sites by MMP-2. (B) RRMEC IP experiments showing an interaction between PECAM-1 and MMP-2 with an increase in the interaction (relative to PECAM-1) under HG conditions. (C) PECAM-1 mean band densities are significantly decreased with MMP-2 treatment. Western blotting data is a comparison of the relative PECAM-1/β-actin band densities. *P < 0.05 versus 0 ng/ml, N = 3 to 6.
Inhibition of MMPs
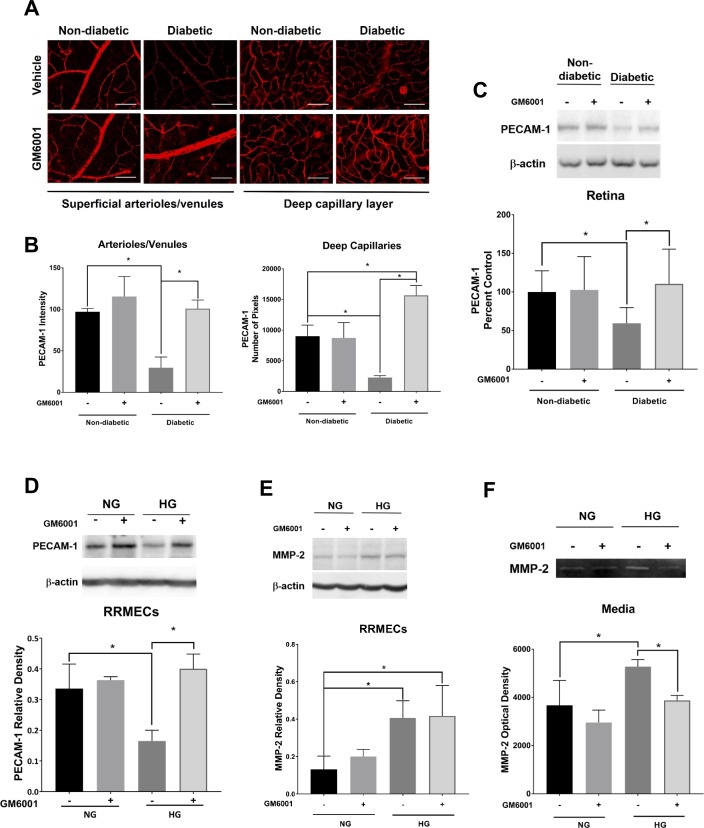
To determine whether MMP inhibition can protect PECAM-1 levels, we used the broad-spectrum MMP inhibitor GM6001 (Ilomastat), which forms a bidentate complex with the active site of MMPs, thus affecting their biological activity. GM6001 eye drops given to diabetic rats helped maintain retinal PECAM-1 staining levels when compared with untreated diabetic rats when using immunofluorescence staining or western blot analysis of retinal tissues (Figs. 9A–C). Moreover, we saw the same effects when we treated RRMECs grown under hyperglycemic conditions with GM6001, where we saw a maintenance in PECAM-1 when compared with nontreated RRMECs (P < 0.05; Fig. 9D). MMP-2 mean band densities did not change with GM6001 treatment in control RRMECs, whereas it significantly increased under hyperglycemic conditions with or without GM6001 (Fig. 9E). However, there was a significant decrease in MMP-2 activity in media collected from cells grown under hyperglycemic conditions when treated with GM6001 (P < 0.05; Fig. 9F).
Figure 9.
The inhibition of MMPs protects PECAM-1 levels under hyperglycemic conditions. (A) Representative immunostaining images of GM6001 treatment in the retina; scale bar = 50 μm. (B) Immunostaining intensity in the superficial retina and the number of pixels exceeding background levels in the capillary layer. (C) Comparable normoglycemic/hyperglycemic western blot intensities of PECAM-1 in the retina with GM6001 treatment. (D) WB analysis showing hyperglycemic PECAM-1 levels comparable to RRMECs grown under NG conditions with GM6001 treatment. (E) MMP-2 mean densities in RRMECs were significantly increased under HG conditions but not altered by GM6001. (F) MMP-2 activity was inhibited with GM6001 treatment under HG. Western blotting data is a comparison of the relative PECAM-1/β-actin or MMP-2/β-actin band densities. *P < 0.05, N = 7 to 9 per group in vivo, and N = 3 to 5 per group in vitro.
Discussion
Some of the clinical retinal manifestations of diabetes include increased vascular permeability, endothelial cell apoptosis, leukocyte plugging, and alteration in endothelial cell signaling, with PECAM-1 loss also associated with increased endothelial permeability and apoptosis, alterations in endothelial signaling, and inhibited leukocyte transmigration.10–12,14,23,35–38 Two previous reports (one in vivo and one in vitro) have indicated that PECAM-1 expression on retinal vascular endothelial cells is reduced in hyperglycemic conditions. In the in vivo study,6 immunostaining of PECAM-1 in retinal cross-sections from type 2 diabetic db/db mice was less than in nondiabetic controls, although this difference was not explored. In the in vitro study, the measures of PECAM-1 mRNA and protein were decreased by more than 50% in human retinal microvascular endothelial cells when incubated with 25 mM glucose for 72 hours.7 Neither of these studies delved into the mechanisms responsible for the hyperglycemia-induced loss of PECAM-1, but given the important roles of PECAM-1 in cell signaling, cell survival, and barrier function, finding the mechanism(s) responsible and methods to avert the loss of PECAM-1 could be of clinical importance in DR.
In the current study, we investigated the decreases in PECAM-1 found in a rat model of type 1 diabetes as well as in cultures of RRMECs grown in hyperglycemic media. In these two models, we obtained the following novel findings: (1) the mediator(s) responsible for the decrease may at least, in part, be circulating in the plasma of diabetic rats; (2) one such potential mediator, MMP-2, is elevated in diabetic plasma (and in cells grown in hyperglycemia); (3) MMP-2 interacts with PECAM-1, has cleavage sites on PECAM-1, and decreases PECAM-1 levels in vitro; and (4) MMP inhibition protects endothelial cells in vivo and in vitro from hyperglycemia-induced loss of PECAM-1. It is possible that other MMPs beside MMP-2 also may play a role in the diabetes-induced loss of retinal PECAM-1; however; we found no increase in plasma MMP-9 protein or activity in diabetic rats, and a more moderate glucose-induced increase in RRMEC MMP-9 when compared with MMP-2.
The increase in MMP-2 may be a consequence of oxidative stress,39 which is known to contribute to DR.40,41 Peroxynitrite, a potent oxidant and nitrating molecule, is able to activate pro-MMPs, independently of the proteolytic cleavage of its inhibitory domain, because of catalytic zinc's sensitivity to the oxidative environment.42–44 When analyzing MMP-2 protein levels using western blotting and enzymatic activity using zymography, we found substantial elevations of the enzyme in both diabetic retinas and plasma as well as in cultured retinal endothelial cells. Therefore, PECAM-1 on the surface of the retinal endothelium could be exposed not only to systemic circulating MMP-2 but also to MMP-2 produced locally by the retinal endothelial cells themselves. Furthermore, the additional experiments confirmed the ability of MMP-2 to interact with and decrease the endothelial expression of PECAM-1, possibly through either proteolysis or shedding.
Despite our results being consistent with a role for MMPs in the hyperglycemia-induced loss of retinal PECAM-1, other mechanisms and mediators contributing in series or in parallel with the actions of MMPs are likely to be important. One such possibility is that osmotic stress may contribute to the loss of PECAM-1, as suggested by our experiments exposing cultured retinal endothelial cells to hyperosmotic media. Although a hyperosmotic solution of dextran had no effect, hyperosmotic mannitol and NaCl partially decreased PECAM-1 levels, but not to the same degree as hyperosmotic glucose. Mannitol and NaCl may have cellular effects that extend beyond their ability to elevate osmolarity, but it should be noted that reports in the literature indicate that MMP production can be stimulated by hyperosmolarity, at least in corneal epithelial cells.45,46 However, the levels of osmolarity required to stimulate MMP production in these studies was much higher (up to 500 mOsm/L) than in our current study (∼320 mOsm/L). Even so, high glucose-induced hyperosmolarity has been implicated in cyclooxygenase-2-mediated inflammation that might contribute to DR.47
A limitation of the current study that will require further investigation is whether the potential MMP-mediated loss of PECAM-1 is the result of proteolytic cleavage, or shedding, or potentially an effect on endothelial production of the glycoprotein itself. Our antibody against PECAM-1 binds the extracellular domain near a possible site of cleavage and may not be appropriate for detecting cleaved fragments of the protein. Therefore, we were not able to quantify the extent to which PECAM-1 fragments were being released into the plasma. However, the decreased levels of full-length PECAM-1 in diabetic plasma mimicked the decrease seen on the retinal vasculature, which could possibly be consistent with less PECAM-1 being produced by the endothelium. Moreover, the observed increase of truncated PECAM-1 levels on RRMECs cultured under hyperglycemic conditions suggests a possible cleavage. One scenario in which MMP-2 could indirectly decrease levels of PECAM-1 in a cleavage-independent mechanism would be through an increase in tumor necrosis factor,25,48 which has previously been found to decrease PECAM-1 mRNA and protein levels36,49,50 in cultured endothelial cells. However, inasmuch as MMP-2 interacts with PECAM-1, a more direct action of the MMP on either shedding or cleavage is a distinct possibility, with previous reports demonstrating the relationship between PECAM-1 shedding and MMPs (although not specifically MMP-2).37,51
To inhibit MMPs, we used the broad-spectrum inhibitor GM6001, which inhibits MMP activity by forming a chelating, bidentate bond with the catalytic zinc molecule at its active site, thus rendering it inactive.52 Given its effectiveness and our results of altered levels of MMP-2 and the effects of MMP-2 on cultured retinal endothelial cells, it is possible that a more specific MMP-2 inhibition strategy could be appropriate. Therefore, we cannot as yet exclude the possibility that other MMPs besides MMP-2 could play a role in the hyperglycemia-induced loss of PECAM-1. In addition, although our data are consistent with a role for MMPs, such as MMP-2, in the diabetes-induced loss of PECAM-1, we are not suggesting that it is the only mediator, but a part of a complex process initiated by hyperglycemia, leading to a disruption in endothelial cell homeostasis and biochemistry that can alter several signaling pathways.53
In conclusion, we found a significant decrease in retinal microvascular PECAM-1 in a type 1 diabetic rat model as well as in cultured retinal endothelial cells in hyperglycemic media. Moreover, we have reported previously no statistical differences in the capillary density between nondiabetic and diabetic rats,8 suggesting that any change in PECAM-1 protein levels are not likely to be because of changes in capillary density. We believe that our results may be consistent with a mechanism whereby MMPs may be released by the endothelium into the plasma and that the MMPs may directly or indirectly be responsible for the decrease in PECAM-1.
Acknowledgments
The authors thank Christopher Pattillo and his lab members for providing the ChemiDoc XRS gel imaging system and for guidance with the system.
Supported by funding from National Institute of Health EY025632 and the American Heart Association predoctoral fellowship.
Disclosure: R.S. Eshaq, None; N.R. Harris, None
References
- 1.Leasher JL, Bourne RR, Flaxman SR, et al. Global estimates on the number of people blind or visually impaired by diabetic retinopathy: a meta-analysis from 1990 to 2010. Diabetes Care. 2016;39:1643–1649. doi: 10.2337/dc15-2171. [DOI] [PubMed] [Google Scholar]
- 2.Duh EJ, Sun JK, Stitt AW. Diabetic retinopathy: current understanding, mechanisms, and treatment strategies. JCI Insight. 2017;2:1–13. doi: 10.1172/jci.insight.93751. [DOI] [PMC free article] [PubMed] [Google Scholar]
- 3.Hendrick AM, Gibson MV, Kulshreshtha A. Diabetic retinopathy. Prim Care. 2015;42:451–464. doi: 10.1016/j.pop.2015.05.005. [DOI] [PubMed] [Google Scholar]
- 4.Meleth AD, Agron E, Chan CC, et al. Serum inflammatory markers in diabetic retinopathy. Invest Ophthalmol Vis Sci. 2005;46:4295–4301. doi: 10.1167/iovs.04-1057. [DOI] [PubMed] [Google Scholar]
- 5.McLeod DS, Lefer DJ, Merges C, Lutty GA. Enhanced expression of intracellular adhesion molecule-1 and P-selectin in the diabetic human retina and choroid. Am J Pathol. 1995;147:642–653. [PMC free article] [PubMed] [Google Scholar]
- 6.Cheung AK, Fung MK, Lo AC, et al. Aldose reductase deficiency prevents diabetes-induced blood-retinal barrier breakdown, apoptosis, and glial reactivation in the retina of db/db mice. Diabetes. 2005;54:3119–3125. doi: 10.2337/diabetes.54.11.3119. [DOI] [PubMed] [Google Scholar]
- 7.Cao Y, Feng B, Chen S, Chu Y, Chakrabarti S. Mechanisms of endothelial to mesenchymal transition in the retina in diabetes. Invest Ophthalmol Vis Sci. 2014;55:7321–7331. doi: 10.1167/iovs.14-15167. [DOI] [PubMed] [Google Scholar]
- 8.Leskova W, Watts MN, Carter PR, Eshaq RS, Harris NR. Measurement of retinal blood flow rate in diabetic rats: disparity between techniques due to redistribution of flow. Invest Ophthalmol Vis Sci. 2013;54:2992–2999. doi: 10.1167/iovs.13-11915. [DOI] [PMC free article] [PubMed] [Google Scholar]
- 9.Wang Z, Yadav AS, Leskova W, Harris NR. Attenuation of streptozotocin-induced microvascular changes in the mouse retina with the endothelin receptor A antagonist atrasentan. Exp Eye Res. 2010;91:670–675. doi: 10.1016/j.exer.2010.08.008. [DOI] [PMC free article] [PubMed] [Google Scholar]
- 10.Newman PJ. The role of PECAM-1 in vascular cell biology. Ann N Y Acad Sci. 1994;714:165–174. doi: 10.1111/j.1749-6632.1994.tb12041.x. [DOI] [PubMed] [Google Scholar]
- 11.Newman PJ, Albelda SM. Cellular and molecular aspects of PECAM-1. Nouv Rev Fr Hematol. 1992;34(suppl):S9–S13. [PubMed] [Google Scholar]
- 12.Newman PJ, Newman DK. Signal transduction pathways mediated by PECAM-1: new roles for an old molecule in platelet and vascular cell biology. Arterioscler Thromb Vasc Biol. 2003;(23):953–964. doi: 10.1161/01.ATV.0000071347.69358.D9. [DOI] [PubMed] [Google Scholar]
- 13.Privratsky JR, Paddock CM, Florey O, Newman DK, Muller WA, Newman PJ. Relative contribution of PECAM-1 adhesion and signaling to the maintenance of vascular integrity. J Cell Sci. 2011;(124):1477–1485. doi: 10.1242/jcs.082271. [DOI] [PMC free article] [PubMed] [Google Scholar]
- 14.Graesser D, Solowiej A, Bruckner M, et al. Altered vascular permeability and early onset of experimental autoimmune encephalomyelitis in PECAM-1-deficient mice. J Clin Invest. 2002;109:383–392. doi: 10.1172/JCI13595. [DOI] [PMC free article] [PubMed] [Google Scholar]
- 15.Fujiwara K. Platelet endothelial cell adhesion molecule-1 and mechanotransduction in vascular endothelial cells. J Intern Med. 2006;259:373–380. doi: 10.1111/j.1365-2796.2006.01623.x. [DOI] [PubMed] [Google Scholar]
- 16.Gao C, Sun W, Christofidou-Solomidou M, et al. PECAM-1 functions as a specific and potent inhibitor of mitochondrial-dependent apoptosis. Blood. 2003;102:169–179. doi: 10.1182/blood-2003-01-0003. [DOI] [PubMed] [Google Scholar]
- 17.Tzima E, Irani-Tehrani M, Kiosses WB, et al. A mechanosensory complex that mediates the endothelial cell response to fluid shear stress. Nature. 2005;437:426–431. doi: 10.1038/nature03952. [DOI] [PubMed] [Google Scholar]
- 18.Fleming I, Fisslthaler B, Dixit M, Busse R. Role of PECAM-1 in the shear-stress-induced activation of Akt and the endothelial nitric oxide synthase (eNOS) in endothelial cells. J Cell Sci. 2005;118:4103–4111. doi: 10.1242/jcs.02541. [DOI] [PubMed] [Google Scholar]
- 19.Adamis AP. Is diabetic retinopathy an inflammatory disease? Br J Ophthalmol. 2002;86:363–365. doi: 10.1136/bjo.86.4.363. [DOI] [PMC free article] [PubMed] [Google Scholar]
- 20.Cai J, Boulton M. The pathogenesis of diabetic retinopathy: old concepts and new questions. Eye (Lond) 2002;16:242–260. doi: 10.1038/sj.eye.6700133. [DOI] [PubMed] [Google Scholar]
- 21.Ciulla TA, Amador AG, Zinman B. Diabetic retinopathy and diabetic macular edema: pathophysiology, screening, and novel therapies. Diabetes Care. 2003;26:2653–2664. doi: 10.2337/diacare.26.9.2653. [DOI] [PubMed] [Google Scholar]
- 22.Biswas P, Canosa S, Schoenfeld D, et al. PECAM-1 affects GSK-3beta-mediated beta-catenin phosphorylation and degradation. Am J Pathol. 2006;(169):314–324. doi: 10.2353/ajpath.2006.051112. [DOI] [PMC free article] [PubMed] [Google Scholar]
- 23.Fernandez-Martin L, Marcos-Ramiro B, Bigarella CL, et al. Crosstalk between reticular adherens junctions and platelet endothelial cell adhesion molecule-1 regulates endothelial barrier function. Arterioscler Thromb Vasc Biol. 2012;32:e90–e102. doi: 10.1161/ATVBAHA.112.252080. [DOI] [PubMed] [Google Scholar]
- 24.Kakei Y, Akashi M, Shigeta T, Hasegawa T, Komori T. Alteration of cell-cell junctions in cultured human lymphatic endothelial cells with inflammatory cytokine stimulation. Lymphat Res Biol. 2014;12:136–143. doi: 10.1089/lrb.2013.0035. [DOI] [PMC free article] [PubMed] [Google Scholar]
- 25.Sternlicht MD, Werb Z. How matrix metalloproteinases regulate cell behavior. Annu Rev Cell Dev Biol. 2001;17:463–516. doi: 10.1146/annurev.cellbio.17.1.463. [DOI] [PMC free article] [PubMed] [Google Scholar]
- 26.Page-McCaw A, Ewald AJ, Werb Z. Matrix metalloproteinases and the regulation of tissue remodelling. Nat Rev Mol Cell Biol. 2007;8:221–233. doi: 10.1038/nrm2125. [DOI] [PMC free article] [PubMed] [Google Scholar]
- 27.Tocchi A, Parks WC. Functional interactions between matrix metalloproteinases and glycosaminoglycans. FEBS J. 2013;280:2332–2341. doi: 10.1111/febs.12198. [DOI] [PubMed] [Google Scholar]
- 28.Naganuma Y, Satoh K, Yi Q, Asazuma N, Yatomi Y, Ozaki Y. Cleavage of platelet endothelial cell adhesion molecule-1 (PECAM-1) in platelets exposed to high shear stress. J Thromb Haemost. 2004;2:1998–2008. doi: 10.1111/j.1538-7836.2004.00954.x. [DOI] [PubMed] [Google Scholar]
- 29.Kato H, Kuriyama N, Duarte S, Clavien PA, Busuttil RW, Coito AJ. MMP-9 deficiency shelters endothelial PECAM-1 expression and enhances regeneration of steatotic livers after ischemia and reperfusion injury. J Hepatol. 2014;60:1032–1039. doi: 10.1016/j.jhep.2013.12.022. [DOI] [PMC free article] [PubMed] [Google Scholar]
- 30.Kowluru RA, Zhong Q, Santos JM. Matrix metalloproteinases in diabetic retinopathy: potential role of MMP-9. Expert Opin Investig Drugs. 2012;21:797–805. doi: 10.1517/13543784.2012.681043. [DOI] [PMC free article] [PubMed] [Google Scholar]
- 31.Nelissen I, Gveric D, van Noort JM, Cuzner ML, Opdenakker G. PECAM-1 and gelatinase B coexist in vascular cuffs of multiple sclerosis lesions. Neuropathol Appl Neurobiol. 2006;32:15–22. doi: 10.1111/j.1365-2990.2006.00677.x. [DOI] [PubMed] [Google Scholar]
- 32.Uemura S, Matsushita H, Li W, et al. Diabetes mellitus enhances vascular matrix metalloproteinase activity: role of oxidative stress. Circ Res. 2001;88:1291–1298. doi: 10.1161/hh1201.092042. [DOI] [PubMed] [Google Scholar]
- 33.Song J, Tan H, Perry AJ, et al. PROSPER: an integrated feature-based tool for predicting protease substrate cleavage sites. PLoS One. 2012;7:e50300–e50323. doi: 10.1371/journal.pone.0050300. [DOI] [PMC free article] [PubMed] [Google Scholar]
- 34.Brownlee M. The pathobiology of diabetic complications: a unifying mechanism. Diabetes. 2005;(54):1615–1625. doi: 10.2337/diabetes.54.6.1615. [DOI] [PubMed] [Google Scholar]
- 35.Barot M, Gokulgandhi MR, Patel S, Mitra AK. Microvascular complications and diabetic retinopathy: recent advances and future implications. Future Med Chem. 2013;5:301–314. doi: 10.4155/fmc.12.206. [DOI] [PMC free article] [PubMed] [Google Scholar]
- 36.Rival Y, Del Maschio A, Rabiet MJ, Dejana E, Duperray A. Inhibition of platelet endothelial cell adhesion molecule-1 synthesis and leukocyte transmigration in endothelial cells by the combined action of TNF-alpha and IFN-gamma. J Immunol. 1996;157:1233–1241. [PubMed] [Google Scholar]
- 37.Ilan N, Mohsenin A, Cheung L, Madri JA. PECAM-1 shedding during apoptosis generates a membrane-anchored truncated molecule with unique signaling characteristics. FASEB J. 2001;15:362–372. doi: 10.1096/fj.00-0372com. [DOI] [PubMed] [Google Scholar]
- 38.Schenkel AR, Chew TW, Muller WA. Platelet endothelial cell adhesion molecule deficiency or blockade significantly reduces leukocyte emigration in a majority of mouse strains. J Immunol. 2004;(173):6403–6408. doi: 10.4049/jimmunol.173.10.6403. [DOI] [PubMed] [Google Scholar]
- 39.Gencer S, Cebeci A, Irmak-Yazicioglu MB. Matrix metalloproteinase gene expressions might be oxidative stress targets in gastric cancer cell lines. Chin J Cancer Res. 2013;25:322–333. doi: 10.3978/j.issn.1000-9604.2013.06.05. [DOI] [PMC free article] [PubMed] [Google Scholar]
- 40.Eshaq RS, Wright WS, Harris NR. Oxygen delivery, consumption, and conversion to reactive oxygen species in experimental models of diabetic retinopathy. Redox Biol. 2014;2:661–666. doi: 10.1016/j.redox.2014.04.006. [DOI] [PMC free article] [PubMed] [Google Scholar]
- 41.Kowluru RA, Chan PS. Oxidative stress and diabetic retinopathy. Exp Diabetes Res. 2007;2007:43603–43612. doi: 10.1155/2007/43603. [DOI] [PMC free article] [PubMed] [Google Scholar]
- 42.Okamoto T, Akaike T, Sawa T, Miyamoto Y, van der Vliet A, Maeda H. Activation of matrix metalloproteinases by peroxynitrite-induced protein S-glutathiolation via disulfide S-oxide formation. J Biol Chem. 2001;276:29596–29602. doi: 10.1074/jbc.M102417200. [DOI] [PubMed] [Google Scholar]
- 43.Giles NM, Watts AB, Giles GI, Fry FH, Littlechild JA, Jacob C. Metal and redox modulation of cysteine protein function. Chemistry Biol. 2003;10:677–693. doi: 10.1016/s1074-5521(03)00174-1. [DOI] [PubMed] [Google Scholar]
- 44.Wang W, Sawicki G, Schulz R. Peroxynitrite-induced myocardial injury is mediated through matrix metalloproteinase-2. Cardiovasc Res. 2002;53:165–174. doi: 10.1016/s0008-6363(01)00445-x. [DOI] [PubMed] [Google Scholar]
- 45.Li DQ, Chen Z, Song XJ, Luo L, Pflugfelder SC. Stimulation of matrix metalloproteinases by hyperosmolarity via a JNK pathway in human corneal epithelial cells. Invest Ophthalmol Vis Sci. 2004;45:4302–4311. doi: 10.1167/iovs.04-0299. [DOI] [PubMed] [Google Scholar]
- 46.Luo L, Li DQ, Corrales RM, Pflugfelder SC. Hyperosmolar saline is a proinflammatory stress on the mouse ocular surface. Eye Contact Lens. 2005;31:186–193. doi: 10.1097/01.icl.0000162759.79740.46. [DOI] [PubMed] [Google Scholar]
- 47.Madonna R, Giovannelli G, Confalone P, Renna FV, Geng YJ, De Caterina R. High glucose-induced hyperosmolarity contributes to COX-2 expression and angiogenesis: implications for diabetic retinopathy. Cardiovasc Diabetol. 2016;15:18. doi: 10.1186/s12933-016-0342-4. [DOI] [PMC free article] [PubMed] [Google Scholar]
- 48.Gearing AJ, Beckett P, Christodoulou M, et al. Matrix metalloproteinases and processing of pro-TNF-alpha. J Leukoc Biol. 1995;57:774–777. doi: 10.1002/jlb.57.5.774. [DOI] [PubMed] [Google Scholar]
- 49.Stewart RJ, Kashour TS, Marsden PA. Vascular endothelial platelet endothelial adhesion molecule-1 (PECAM-1) expression is decreased by TNF-alpha and IFN-gamma. Evidence for cytokine-induced destabilization of messenger ribonucleic acid transcripts in bovine endothelial cells. J Immunol. 1996;156:1221–1228. [PubMed] [Google Scholar]
- 50.Sawa Y, Sugimoto Y, Ueki T, et al. Effects of TNF-alpha on leukocyte adhesion molecule expressions in cultured human lymphatic endothelium. J Histochem Cytochem. 2007;55:721–733. doi: 10.1369/jhc.6A7171.2007. [DOI] [PubMed] [Google Scholar]
- 51.Wong MX, Harbour SN, Wee JL, Lau LM, Andrews RK, Jackson DE. Proteolytic cleavage of platelet endothelial cell adhesion molecule-1 (PECAM-1/CD31) is regulated by a calmodulin-binding motif. FEBS Lett. 2004;568:70–78. doi: 10.1016/j.febslet.2004.04.094. [DOI] [PubMed] [Google Scholar]
- 52.Grobelny D, Poncz L, Galardy RE. Inhibition of human skin fibroblast collagenase, thermolysin, and Pseudomonas aeruginosa elastase by peptide hydroxamic acids. Biochemistry. 1992;31:7152–7154. doi: 10.1021/bi00146a017. [DOI] [PubMed] [Google Scholar]
- 53.Popov D. Endothelial cell dysfunction in hyperglycemia: phenotypic change, intracellular signaling modification, ultrastructural alteration, and potential clinical outcomes. Int J Diabetes Mellit. 2010;2:189–195. [Google Scholar]


