

Abstract
OBJECTIVE
Genetic risk scores (GRS) have been developed that differentiate individuals with type 1 diabetes from those with other forms of diabetes and are starting to be used for population screening; however, most studies were conducted in European-ancestry populations. This study identifies novel genetic variants associated with type 1 diabetes risk in African-ancestry participants and develops an African-specific GRS.
RESEARCH DESIGN AND METHODS
We generated single nucleotide polymorphism (SNP) data with the ImmunoChip on 1,021 African-ancestry participants with type 1 diabetes and 2,928 control participants. HLA class I and class II alleles were imputed using SNP2HLA. Logistic regression models were used to identify genome-wide significant (P < 5.0 × 10⁻⁸) SNPs associated with type 1 diabetes in the African-ancestry samples and validate SNPs associated with risk in known European-ancestry loci (P < 2.79 × 10⁻⁵).
RESULTS
African-specific (HLA-DQA1*03:01-HLA-DQB1*02:01) and known European-ancestry HLA haplotypes (HLA-DRB1*03:01-HLA-DQA1*05:01-HLA-DQB1*02:01, HLA-DRB1*04:01-HLA-DQA1*03:01-HLA-DQB1*03:02) were significantly associated with type 1 diabetes risk. Among European-ancestry defined non-HLA risk loci, six risk loci were significantly associated with type 1 diabetes in subjects of African ancestry. An African-specific GRS provided strong prediction of type 1 diabetes risk (area under the curve 0.871), performing significantly better than a European-based GRS and two polygenic risk scores in independent discovery and validation cohorts.
CONCLUSIONS
Genetic risk of type 1 diabetes includes ancestry-specific, disease-associated variants. The GRS developed here provides improved prediction of type 1 diabetes in African-ancestry subjects and a means to identify groups of individuals who would benefit from immune monitoring for early detection of islet autoimmunity.
Introduction
Type 1 diabetes results from the autoimmune destruction of the pancreatic β-cells, leading to absolute dependence on exogenous insulin to regulate blood glucose levels (1). The incomplete concordance for type 1 diabetes in monozygotic (MZ, sharing 100% of DNA) twin pairs suggests that heritable factors account for ∼50% of risk for type 1 diabetes, with the remainder due to unrecognized but likely nongenetic causes. On average, the incidence of type 1 diabetes is increasing ∼2% per year in the U.S., suggesting a growing disease burden due to changing environment/lifestyle factors on a genetically susceptible background. Although European-ancestry populations have historically high rates of type 1 diabetes, in the U.S. individuals of African and Hispanic ancestry exhibit the most rapidly increasing rates of type 1 diabetes; thus, type 1 diabetes impacts all ethnic groups with regard to quality of life and increased health care costs (2,3).
To date, studies of the genetics of type 1 diabetes have largely focused on European-ancestry populations, where type 1 diabetes has high prevalence and large sample sizes of individual cases or multiple case families can be obtained. Genome-wide association studies (GWAS) have identified more than 50 type 1 diabetes risk loci (4,5). Using the ImmunoChip, the Type 1 Diabetes Genetics Consortium (T1DGC) genotyped over 25,000 European-ancestry subjects with type 1 diabetes and control subjects, revising the list of most-associated single nucleotide polymorphisms (SNPs) from GWAS and reducing the median number of putatively causal SNPs in each locus from 28 to 8 (6). These SNPs have recently been used to create genetic risk scores (GRS) that can identify individuals for which immune monitoring for early detection of islet autoimmunity is warranted (7–9) and differentiate those individuals from subjects with other forms of diabetes. A major limitation of the current GRS, however, is that they are based solely on results from European-ancestry populations (10). The prevalence of type 1 diabetes is increasing in ethnic minorities (11), and type 2 diabetes is now more frequently diagnosed in youth (11), making it difficult to differentiate between type 1 diabetes and type 2 diabetes on clinical phenotype alone. While islet autoantibodies and fasting or stimulated C-peptide levels along with GRS are useful tools to augment a clinical diagnosis, the absence of genetic information on risk in non-European populations is a limitation that may affect the accuracy and utility of these tools in such populations.
Prior genetic analyses of type 1 diabetes risk in African-ancestry populations have suffered from small sample size, with the only significant associations observed with HLA genes (12–14). Here, we performed a comprehensive analysis of ImmunoChip SNPs in African-ancestry case and control subjects to discover novel loci as well as novel variation within known loci and develop an African-ancestry type 1 diabetes GRS, with comparison with the European-ancestry GRS.
Research Design and Methods
Study Samples
We obtained DNA samples and data from 666 type 1 diabetes case subjects and 596 control subjects of African ancestry ascertained by the T1DGC (15), 255 case subjects from the SEARCH for Diabetes in Youth study (SEARCH) (16), 41 case subjects from the Genetics of Kidneys in Diabetes (GoKinD) study (17), and 59 case subjects and 42 control subjects from the Barbara Davis Center (BDC) (18). Samples were obtained from an additional 368 African-ancestry control subjects from the Consortium for the Longitudinal Evaluation of African Americans with Early Rheumatoid Arthritis (CLEAR) (19), 801 control subjects from the New York Control Population (NYCP) from the Feinstein Institute for Medical Research (20), 659 control subjects from the University of Alabama at Birmingham (UAB) (21), and 462 control subjects from the University of California, San Francisco (UCSF) (22). A summary of study participants is provided in Supplementary Table 1. DNA for the independent replication group was obtained from the University of Florida (type 1 diabetes = 61, control = 54, type 2 diabetes = 30). DNA from study participants was obtained after receiving approval from relevant institutional research ethics committees and informed consent.
Genotyping and Data Quality Control
Genotyping was performed using the ImmunoChip (Illumina), according to the manufacturer’s protocols. The T1DGC, SEARCH, GoKinD, NYCP, BDC, and UCSF samples were genotyped at the Center for Public Health Genomics, University of Virginia, Charlottesville, VA. The CLEAR and UAB control samples were genotyped at the Feinstein Institute for Medical Research, Manhasset, NY. All genotyping files were assembled at the University of Virginia to cluster genotypes using the Illumina Gentrain2 algorithm. All SNP genome positions used human reference genome GRCh37. Genotyping of the replication set of samples was performed at the University of Florida Genetics Institute using a custom Affymetrix array combining genome-wide coverage with full SNP content of the ImmunoChip array.
Sample quality control measures included call rate, heterozygosity, and concordance between reported and genotype-inferred sex. SNP quality control measures included restricting analysis to genotyping call rates ≥95%, Hardy-Weinberg equilibrium in controls (P > 10−10), and removal of monomorphic SNPs. To avoid cryptic relatedness that can confound association analyses, the relationship inference method implemented in KING (23) estimated kinship coefficients between every pair of study subjects based on ImmunoChip genotypes. In those pairs of subjects found to be related, one subject was randomly removed to avoid bias.
Population Structure
All participants included in our study self-reported as being of African ancestry. Reference samples from the International HapMap Project representing African, Asian, and European populations were used to validate self-reported ancestry via the principal component (PC) projection method implemented in KING (23). Prior to PC analysis, autosomal SNPs were linkage disequilibrium (LD) pruned (r2 < 0.2) to reduce allelic correlations between adjacent SNPs. PC analysis was performed on HapMap control samples, followed by projection of our study population onto the HapMap control PC space (Supplementary Fig. 1). Study participants that self-identified as being of African ancestry and aligned with African-ancestry HapMap samples in the control space were analyzed. To control for study differences and ensure we matched case-control samples appropriately, after the initial quality control steps with HapMap samples, we removed MHC region SNPs (chr6: 25,294–34,665 kb). PC analysis was performed on 2,928 control (unaffected) individuals, followed by projection of 1,021 individuals with type 1 diabetes (affected) onto the control PC space. The first two PCs (PC1 and PC2) explained the majority of variance in the African-ancestry genotyping data and were included as covariates in logistic regression models.
Imputation
Prior to imputation, we aligned the genotyped ImmunoChip SNPs to the 1000 Genomes Project reference panel (phase 3, version 5) using flipping and removing rules previously described (6). After genotyped SNPs were aligned to the reference panel, SHAPEIT (v2 r837) was used to construct haplotype phasing. Minimac3 (version 2.0.1) was used to impute 49 million 1000 Genomes SNPs into the ImmunoChip African-ancestry data set.
Single SNP Association Analysis
Association analyses of SNPs with type 1 diabetes status were performed using PLINK (24), with a logistic regression model for each SNP as primary predictor, adjusting for sex and two PCs (PC1 and PC2) to control for biases of population structure. A minor allele frequency (MAF) threshold of 5% (MAF ≥0.05) was used to assess the impact of common SNPs. Statistical significance was considered at a Bonferroni-corrected significance threshold based upon the number of SNPs analyzed, either genome-wide (P ≤ 5.0 × 10⁻⁸) or in “known loci” (P < 2.79 × 10⁻⁵). Association results for each SNP within a locus were plotted using LocusZoom (25) with the custom annotation option to mark the European-ancestry 99% credible SNPs (6). The genomic inflation factor, defined by the ratio of the median of the empirically observed distribution of the test statistic to the expected median, was calculated for an equivalent study of 1,000 case subjects and 1,000 control subjects (λ1000) (26). There was little evidence of systematic bias (λ1000 = 1.08) after excluding SNPs in the 4-Mb MHC region and in the INS locus.
Imputation of Classical HLA Alleles
Classical HLA alleles for all eight MHC class I and II genes (HLA-A, HLA-B, HLA-C, HLA-DRB1, HLA-DQA1, HLA-DQB1, HLA-DPA1, and HLA-DPB1) were available only in a subset of African-ancestry participants, although some collections had more limited HLA genotyping (e.g., only HLA-DRB1 was available). We obtained most probable HLA genotypes from the high-density ImmunoChip SNP data in the MHC from imputation using SNP2HLA (27). Imputation was based on the T1DGC SNP reference panel that included 5,196 unrelated subjects of diverse ancestry (4,323 European, 251 African, 608 Asian, and 14 “other”) with both ImmunoChip and classical HLA genotypes (28).
Imputation accuracy was assessed using a subset of subjects previously HLA-typed with a PCR-based sequence-specific oligonucleotide probe system (29,30). Fifty T1DGC participants were selected, 92 of their relatives were removed from the reference panel, and HLA alleles were imputed in the 50 using SNP2HLA and the reference panel of the remaining 5,104 individuals (that included 159 African-ancestry individuals). Imputed HLA genotypes at each of the eight classical HLA loci in these 50 subjects were compared with their known HLA genotypes. Imputation accuracy (ρ) for a given locus was calculated as previously described (27). Briefly, dosage of each genotyped (known) HLA allele was summed across all individuals and the summed genotype-dosage was divided by the total number of observations (chromosomes), as defined by
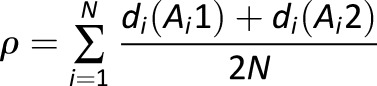 |
where di is the imputed dosage of an allele in person i, and alleles Ai1 and Ai2 at a given locus (e.g., HLA-DRB1) are the genotyped (true) HLA types for subject i. A completely accurate imputation would have a dosage of 1.0 for that allele. The correlation between imputed and genotyped dosages at each HLA locus provided the estimate of imputation performance.
HLA Association Analyses
The most probable classical HLA genotypes (dosages) were used in all association analyses. Subjects were excluded from analysis of a given locus if the total allele count across all possible alleles at that locus was not equal to two alleles. We defined rare HLA alleles as those that occur fewer than 30 times in the combined sample of case and control subjects (MAF <2.5%). Imputation generated high-quality HLA allele genotypes at 2-field accuracy; thus, statistical analyses of HLA alleles were performed on 2-field imputation calls. When multiple, rare 2-field alleles (allele count <30) were observed within the same 1-field allelic stratum, the set of rare alleles were combined and analyzed as a single 1-field allele. Association analysis of type 1 diabetes with alleles for each of the eight classical HLA genes was conducted using logistic regression, adjusting for sex and two PCs as previously described.
Conditional Analysis of Type 1 Diabetes–Associated HLA Class II Haplotypes
HLA class II haplotypes (DRB1-DQA1-DQB1) were inferred using phased genotypes (27). Each haplotype was coded as a biallelic variant, and association analyses were conducted on “common” haplotypes. Odds ratios (ORs) for haplotypes were calculated in a logistic regression model adjusting for sex and two PCs, defined by
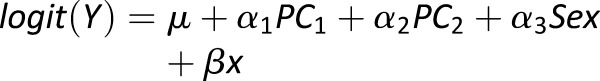 |
where x is the allele count for the haplotype being tested and β is the additive effect of the haplotype. Statistical significance was determined using a likelihood ratio test, comparing the HLA inclusive model with a reference model containing only sex and two PCs.
Independent associations of HLA class II haplotypes with type 1 diabetes status were conducted by iteratively conditioning on the most significant haplotype until no remaining haplotype met the significance threshold (forward selection). Statistical significance was considered at a Bonferroni-corrected P value with a family-wise error rate α = 0.05 and correcting for the total number of haplotypes at each round of conditional analysis. All statistical analyses for association in the MHC region were performed using R 3.3.1 (31).
SNP Selection That Defines the African-Ancestry Type 1 Diabetes GRS
The African-ancestry GRS was based upon SNPs significantly associated with type 1 diabetes risk. Seven SNPs in the GRS, including five that significantly capture the genetic contribution of the HLA region and two from 11p15.5 (INS locus) and 17q12 (IKZF3-ORMDL3-GSDMB locus), exhibited genome-wide significant evidence of association (P < 5.0 × 10⁻⁸). The regression coefficients at each of the seven SNPs were used as individual SNP weights. A GRS for each individual was computed as the weighted sum of allele counts. Supplementary Table 7 provides the SNPs, the effect allele and its frequency, and weights (log(OR)) for the seven SNPs to compute an African-ancestry GRS for type 1 diabetes. We have recently implemented this GRS prediction procedure in the software package KING (23).
The area under the curve (AUC) from receiver operating characteristic (ROC) analysis was computed for the African-ancestry GRS by comparing the observed type 1 diabetes status (case-control) with that predicted from the GRS. To validate performance of the African-ancestry GRS, the data were randomly divided into two subsets, 80% representing a training set and the remaining 20% as the test set; this process was repeated 1,000 times to generate empirical performance metrics to provide a more accurate cross-validation. Considering there may be bias in performance of the African-ancestry GRS as it is being tested on the data that were used to develop the GRS, we also tested it on an independent set of African-ancestry samples.
To assess the new GRS model, performance of a European-ancestry GRS to predict type 1 diabetes in the African-ancestry population was compared to the African-ancestry GRS. The European-ancestry GRS is based upon our previous report (6) that forms the basis of a recently implemented type 1 diabetes GRS (7). The DeLong test was used to compare the AUC difference between the two GRS models (32).
Performance of the GRS on prediction of type 1 diabetes risk in the African-ancestry population was also compared with two polygenic risk score (PRS) models in a cross-validation procedure: a PRS model that was generated using the actual genotype data, and a PRS model that was generated using the GWAS scan summary statistics. Similar to the evaluation of the GRS, the cross-validation data sets included a training subset consisting of 80% of the samples and a test subset consisting of the remaining 20% of samples. We used the software package GCTA to build the PRS model in the training set. For the summary-statistics-based PRS, we first ran a logistic regression adjusting for sex and two PCs of ancestry (four PCs were also investigated for sensitivity analysis), and regression coefficients at filtered SNPs (P value cutoff varies at 1.0, 0.5, 0.05, 5 × 10⁻⁴, 5 × 10⁻⁶, and 5 × 10⁻⁸ and LD r2 varies at 0.2, 0.4, 0.6, and 0.8) were used to weight the genotype at the corresponding SNP. For both PRS models, a PRS was generated for each of the samples in the test set using the PRS model.
Results
After data cleaning and quality control, genotypes for 114,874 ImmunoChip SNPs in 3,949 African-ancestry participants, consisting of 1,021 participants with type 1 diabetes and 2,928 control subjects, were available for analysis. This study represents the largest study of genetics of type 1 diabetes in African-ancestry populations, with greater than 80% power to detect a SNP with OR >2.00 for common variants (MAF >0.05) at genome-wide significance (P < 5.0 × 10⁻⁸), a SNP with OR >1.90 with ImmunoChip-wide significance (P < 4.3 × 10⁻⁷), or a SNP with OR >1.60 within known European-ancestry loci (P < 0.001).
Impact of European-Ancestry SNPs Associated with Type 1 Diabetes in African-Ancestry Populations
Recent analyses in populations of European ancestry (6) identified 2,021 SNPs in 50 regions of the genome significantly associated with type 1 diabetes. In the African-ancestry sample, 1,788 of these SNPs were available for analysis. SNPs in five of the European-ancestry regions, chromosomes 2q33.2 (CTLA4), 6q22.32 (CENPW), 11p15.5 (INS), 12q13.2 (IKZF4-RPS26-ERBB3), and 17q12 (IKZF3-ORMDL3-GSDMB), attained significance at P ≤ 2.79 × 10⁻⁵ (Bonferroni-corrected P < 0.05) in African-ancestry participants (Table 1 and Supplementary Table 2). It should be noted that for majority of the regions, the most significant SNP in the African-ancestry population is not the same as that identified in populations of European-ancestry (6). As shown in Fig. 1, the most significantly associated SNP in European ancestry (denoted by a star) is often distant from the most associated African-ancestry SNP and of minimal significance in association with type 1 diabetes status in African-ancestry populations. However, a subset of the European-ancestry type 1 diabetes credible SNPs (denoted by triangles) also shows strong evidence of association in the African-ancestry population, allowing us to further reduce the number of candidate causal SNPs (Supplementary Table 2).
Table 1.
African-ancestry ImmunoChip SNP associations in European-ancestry type 1 diabetes loci
| Chr | Position (bp) | Marker | Candidate gene(s) | Allele | Allele frequency |
OR (95% CI) | P | EUR credible SNP (OR; allele) (6) | |
|---|---|---|---|---|---|---|---|---|---|
| Case | Control | ||||||||
| 2q33.2 | 204722752 | rs926169 | CTLA4 | T | 0.41 | 0.36 | 1.28 (1.15–1.42) | 8.96 × 10−06 | rs231775 (1.19; G) |
| 6p21.32 | 32626272 | rs9273363 | MHC | A | 0.49 | 0.13 | 5.48 (4.80–6.27) | 4.61 × 10−138 | rs9273363 (5.37; A) |
| 6q22.32 | 126712247 | rs1578060 | CENPW | C | 0.19 | 0.13 | 1.42 (1.23–1.64) | 2.16 × 10−06 | rs1538171 (1.12; G) |
| 10q23.31 | 90187924 | rs10788599 | RNLS | G | 0.14 | 0.17 | 0.69 (0.59–0.80) | 1.07 × 10−06 | rs12416116 (0.85; A) |
| 11p15.5 | 2184848 | rs3842727 | INS | T | 0.39 | 0.26 | 1.53 (1.37–1.72) | 9.48 × 10⁻¹⁴ | rs689 (1.18; T) |
| 12q13.2 | 56435504 | rs705705 | IKZF4 | C | 0.18 | 0.12 | 1.38 (1.19–1.60) | 1.35 × 10−05 | rs705705 (1.25; C) |
| 17q12 | 38066372 | rs56380902 | IKZF3, ORMDL3, GSDMB | C | 0.52 | 0.44 | 1.35 (1.22–1.50) | 1.44 × 10−08 | rs12453507 (1.11; G) |
bp, base pair; Chr, chromosome.
Figure 1.

Regional type 1 diabetes association plots for non-HLA risk loci identified in African Americans. LocusZoom plots for 2q33.2 (A); 6q22.32 (B); 10q23.31, observed association (rs10788599) is in close proximity (∼152 kb) but independent from reported intronic SNP (rs12416116) in European-ancestry populations (C); 11p15.5 (D); 12q13.2 (E); and 17q12 (F) (25). The most significant type 1 diabetes–associated SNP at each locus is plotted (purple). Each symbol on the plot represents a single SNP included in the type 1 diabetes association test (African-ancestry participants); the symbol color corresponds to the degree of LD, with the most significant SNP colored purple. The most significant type 1 diabetes–associated SNP reported in the study by Onengut-Gumuscu et al. (6) is indicated with a yellow-colored star with the exception of 12q13.2, where rs705705 is the index SNP for both populations, indicated with a purple diamond. Type 1 diabetes 99% credible SNPs identified in European-ancestry populations that passed quality control in African-ancestry data are marked with triangles, and all other SNPs are marked with a circle.
In African-ancestry populations, rs3842727 in the INS locus is the most significantly associated non-HLA region SNP (OR 1.53, P = 9.48 × 10⁻¹⁴, 95% CI 1.37–1.72) (Table 1 and Fig. 1D). In European-ancestry populations, the INS promoter VNTR (variable number of tandem repeats) polymorphism is recognized as the non-HLA genetic feature with the largest effect size on type 1 diabetes risk, with the rs689 SNP perfectly “tagging” the INS VNTR. However, in African-ancestry populations, the most associated SNP is rs3842727, and it is strongly correlated (r2 > 0.8) with rs689 in both European-ancestry and African-ancestry populations. The direction of the observed allelic effect of rs3842727 with increased type 1 diabetes risk is consistent in both European- and African-ancestry populations.
The 12q13.2 locus is a complex region with several plausible candidates for type 1 diabetes susceptibility genes (IKZF4, RPS26, and ERBB3) (4). A prior GWAS in European-ancestry subjects supported ERBB3, while subsequent fine-mapping (6) supported the IKZF4-RPS26 region. In the African-ancestry samples, the rs705705 SNP near RPS26 has the strongest association with type 1 diabetes in 12q13.2 (OR 1.38, P = 1.35 × 10⁻⁵, 95% CI 1.19–1.60). In contrast, the rs2292239 SNP in ERBB3 that is strongly supported in European-ancestry populations is not significantly associated with type 1 diabetes (P = 0.83) in African-ancestry samples. Of 22 SNPs in the 12q13.2 region strongly associated with type 1 diabetes in European-ancestry populations, only 14 were nominally significant (P < 1.0 × 10⁻⁴) in African-ancestry population, and none of these 14 SNPs were located in ERBB3 (Fig. 1E and Supplementary Table 2).
The 17q12 locus has numerous SNPs associated with type 1 diabetes in European-ancestry populations and contains a cluster of plausible candidates for association with type 1 diabetes (IKZF3, ORMDL3, and GSDMB) (6). In African-ancestry participants, the rs56380902 SNP (intronic in GSDMB) is significantly associated with type 1 diabetes (OR 1.35, P = 1.44 × 10⁻⁸, 95% CI 1.22–1.50), while the most significantly associated SNP in this region in European-ancestry populations (rs12453507) provides no evidence for association (P = 0.11). Of the 111 SNPs in the region that are associated with type 1 diabetes in European-ancestry populations, only 7 are significantly associated (P < 2.79 × 10⁻⁵) in African-ancestry participants. These results reduce the type 1 diabetes risk region from ∼210 kb to a 14.63-kb interval centered on GSDMB (Fig. 1F and Supplementary Table 2).
HLA Association With African-Ancestry Type 1 Diabetes
Imputation to obtain most likely HLA alleles from the ImmunoChip in participants of African-ancestry yielded uniformly high imputation accuracy (ρ) for 1-field (2-digit) classical HLA alleles (ranging from ρ = 0.93 for HLA-DPB1 to ρ > 0.99 for HLA-DQA1, HLA-DQB1, HLA-DPA1, and HLA-C) (Supplementary Tables 3 and 4). None of the eight HLA loci deviated significantly from Hardy-Weinberg equilibrium expectations in controls.
HLA haplotypes significantly associated with type 1 diabetes in the African-ancestry population are HLA-DRB1*03:01-HLA-DQA1*05:01-HLA-DQB1*02:01 (OR 3.91, P = 2.6 × 10−78), HLA-DRB1*04:01-HLA-DQA1*03:01-HLA-DQB1*03:02 (OR 5.36, P = 2.4 × 10⁻²⁹), HLA-DRB1*04:05-HLA-DQA1*03:01-HLA-DQB1*03:02 (OR 6.75, P = 1.8 × 10−40), and African-specific haplotypes HLA-DRB1*03:02-HLA-DQA1*04:01-HLA-DQB1*04:02 (OR 0.14, P = 4.4 × 10⁻²⁶) and HLA-DRB1*15:03-HLA-DQA1*01:02-HLA-DQB1*06:02 (OR 0.13, P = 7.1 × 10−47). For all common, imputed HLA classical alleles and haplotypes, their associations with type 1 diabetes are provided in Table 2 and Supplementary Table 5.
Table 2.
Association of MHC class II haplotypes with type 1 diabetes in unrelated African-ancestry individuals contrasted with Caucasian families from the T1DGC
| DRB1 | DQA1 | DQB1 | Count | Control AF | Case AF | Unadjusted OR | OR | P | Erlich et al. 2008 (29) |
||
|---|---|---|---|---|---|---|---|---|---|---|---|
| Control EU | Case EU | OR | |||||||||
| 01:01 |
01:01 |
05:01 |
218 |
0.026 |
0.032 |
1.24 |
1.15 |
0.37 |
0.09 |
0.066 |
0.71 |
| 01:02 |
01:01 |
05:01 |
288 |
0.040 |
0.026 |
0.65 |
0.66 |
6.7 × 10⁻³ |
0.01 |
0.007 |
0.66 |
| 03:01 |
05:01 |
02:01 |
984 |
0.075 |
0.268 |
4.5 |
3.91 |
2.6 × 10−78 |
0.125 |
0.341 |
3.64 |
| 03:02 |
04:01 |
04:02 |
378 |
0.062 |
0.008 |
0.13 |
0.14 |
4.4 × 10⁻²⁶** |
— |
— |
— |
| 04:01 |
03:01 |
03:01 |
83 |
0.010 |
0.012 |
1.16 |
0.84 |
0.50 |
0.039 |
0.014 |
0.35 |
| 04:01 |
03:01 |
03:02 |
215 |
0.012 |
0.072 |
6.4 |
5.36 |
2.4 × 10⁻²⁹ |
0.045 |
0.281 |
8.39 |
| 04:04 |
03:01 |
03:02 |
122 |
0.010 |
0.031 |
3.1 |
2.60 |
1.1 × 10⁻⁶ |
0.032 |
0.05 |
1.59 |
| 04:05 |
03:01 |
03:02 |
231 |
0.013 |
0.076 |
6.07 |
6.75 |
1.8 × 10−40 |
0.002 |
0.025 |
11.37 |
| 07:01 |
02:01 |
02:02 |
584 |
0.081 |
0.056 |
0.68 |
0.66 |
1.5 × 10⁻⁴ |
— |
— |
— |
| 07:01 |
03:01 |
02:01 |
155 |
0.012 |
0.043 |
3.86 |
4.41 |
7.4 × 10⁻¹⁸** |
— |
— |
— |
| 08:04 |
04:01 |
03:01 |
229 |
0.037 |
0.008 |
0.22 |
0.25 |
7 × 10⁻¹¹** |
— |
— |
— |
| 08:04 |
05:01 |
03:01 |
61 |
0.010 |
0.002 |
0.2 |
0.23 |
5.9 × 10⁻⁴ |
— |
— |
— |
| 09:01 |
03:01 |
02:01 |
326 |
0.024 |
0.092 |
4.17 |
4.87 |
3.4 × 10−39** |
0 |
0.002 |
— |
| 10:01 |
01:01 |
05:01 |
144 |
0.023 |
0.006 |
0.28 |
0.29 |
1.0 × 10⁻⁶ |
0.007 |
0.003 |
0.49 |
| 11:01 |
01:02 |
05:02 |
67 |
0.010 |
0.005 |
0.5 |
0.54 |
0.06 |
— |
— |
— |
| 11:01 |
01:02 |
06:02 |
228 |
0.038 |
0.003 |
0.09 |
0.096 |
5.7 × 10⁻¹⁹ |
— |
— |
— |
| 11:01 |
05:01 |
03:01 |
295 |
0.047 |
0.010 |
0.2 |
0.18 |
7.5 × 10⁻¹⁹ |
0.065 |
0.012 |
0.18 |
| 11:02 |
05:01 |
03:01 |
292 |
0.044 |
0.017 |
0.38 |
0.42 |
2.3 × 10⁻⁷ |
0.004 |
0.002 |
0.37 |
| 12:01 |
01:01 |
05:01 |
221 |
0.033 |
0.015 |
0.44 |
0.49 |
1.4 × 10⁻⁴ |
— |
— |
— |
| 13:01 |
01:03 |
06:03 |
241 |
0.037 |
0.014 |
0.37 |
0.35 |
7.2 × 10⁻⁹ |
0.059 |
0.008 |
0.13 |
| 13:02 |
01:02 |
05:01 |
178 |
0.026 |
0.014 |
0.52 |
0.57 |
5.6 × 10⁻³ |
— |
— |
— |
| 13:02 |
01:02 |
06:04 |
140 |
0.016 |
0.024 |
1.5 |
1.43 |
0.06 |
0.026 |
0.022 |
0.87 |
| 13:02 |
01:02 |
06:09 |
224 |
0.031 |
0.023 |
0.75 |
0.79 |
0.17 |
0.003 |
0 |
0 |
| 13:03 |
02:01 |
02:01 |
63 |
0.010 |
0.003 |
0.3 |
0.35 |
4.3 × 10⁻³** |
— |
— |
— |
| 13:03 |
05:01 |
03:01 |
94 |
0.014 |
0.005 |
0.37 |
0.36 |
4.8 × 10⁻⁴ |
0.01 |
0.001 |
0.08 |
| 15:01 |
01:02 |
06:02 |
167 |
0.028 |
0.002 |
0.07 |
0.055 |
9.9 × 10⁻²⁰ |
0.12 |
0.004 |
0.03 |
| 15:03 |
01:02 |
06:02 |
699 |
0.115 |
0.015 |
0.11 |
0.13 |
7.1 × 10−47** |
— |
— |
— |
| 16:02 | 01:02 | 05:02 | 82 | 0.011 | 0.009 | 0.8 | 0.93 | 0.80 | 0.001 | 0.001 | 0.74 |
Only haplotypes with total allele count >60, and allele frequency (AF) in case or control groups at least 1% or higher, are presented. OR estimates and P values generated by logistic regression, adjusting for two PCs and sex. Control AF, African-ancestry HLA haplotype frequency in subjects without type 1 diabetes. Case AF, African-ancestry HLA haplotype frequency in subjects with type 1 diabetes. Control EU, control HLA haplotype frequency from affected family-based control (AFBAC) method based upon haplotypes not transmitted to an affected child in families. Case EU, case HLA haplotype frequency from the AFBAC method based upon transmitted haplotype from a parent to a child with type 1 diabetes in families.
**African ancestry–specific association with type 1 diabetes.
The region containing HLA genes is known for extensive LD, such that specific alleles at multiple loci are frequently coinherited, making it difficult to assess independent contributions of alleles and haplotypes to type 1 diabetes risk. Conditional analyses identified 15 HLA class II haplotypes associated independently with type 1 diabetes (Supplementary Table 6), including the African-derived risk haplotypes HLA-DRB1*09:01-HLA-DQA1*03:01-HLA-DQB1*02:01 (OR 5.75, P = 2.5 × 10⁻³⁴) and HLA-DRB1*07:01-HLA-DQA1*03:01-HLA-DQB1*02:01 (OR 4.69, P = 6.4 × 10⁻¹⁵).
HLA class I alleles significantly associated with risk of type 1 diabetes are HLA-A*24:02 (OR 2.17, P = 9.8 × 10⁻⁹), HLA-B*15:10 (OR 2.21, P = 7.8 × 10⁻¹⁰), and HLA-C*03:04 (OR 1.87, P = 1.2 × 10⁻¹⁰). The African-specific allele, HLA-B*57:03, was protective against risk of type 1 diabetes (OR 0.44, P = 1.3 × 10⁻⁵) (Supplementary Table 5).
Type 1 Diabetes GRS in African-Ancestry Populations
We assessed the performance of a previously described European-ancestry type 1 diabetes GRS (7) in the African-ancestry population. The European-ancestry GRS model consisted of 30 SNPs derived from the T1DGC (6,33) that were most associated with type 1 diabetes in European populations and were polymorphic in African-ancestry populations (5 in the HLA region and 25 others). The European-ancestry GRS applied to African-ancestry samples had an AUC of 0.798, reflecting the overlap (even if not statistically significant) in regions of the genome associated with type 1 diabetes risk. The African-ancestry type 1 diabetes GRS included only seven SNPs (five in HLA region, one for INS, and one in the IKZF3-ORMDL3-GSDMB region) yet had an AUC of 0.871 (Fig. 2), providing a significant (P < 2.2 × 10⁻¹⁶) improvement in prediction of type 1 diabetes from the European-ancestry GRS based upon the two AUCs. The AUC of 0.871 is equivalent to the AUC from a more rigorous validation procedure in the African-ancestry samples, where 80% of the data are used for training the GRS model and the other 20% for predicting type 1 diabetes risk, which results in an average AUC of 0.870 with 1,000 rounds of cross-validation. To validate the GRS, we applied it to an independent African-ancestry cohort consisting of 61 type 1 diabetes case subjects and 54 control subjects. The AUC for type 1 diabetes risk prediction was 0.779. We further showed discrimination of subjects with type 1 diabetes (n = 63) from subjects with type 2 diabetes (n = 30) with AUC = 0.787.
Figure 2.

Type 1 diabetes risk prediction in African-ancestry subjects using a GRS. The red curve is for the prediction using an African-ancestry GRS (AA GRS), and the black curve is for the prediction using a European-ancestry GRS (EUR GRS) (7).
Type 1 Diabetes GRS Versus PRS
We compared the performance of our proposed type 1 diabetes GRS and two PRSs in the African-ancestry population using the exact training and testing data sets in a cross-validation procedure. The average AUC for the GRS in 100 cross-validations is 0.867, the average AUC for the genotype-based PRS is 0.808, and the average AUC for the summary-statistics-based PRS ranges from 0.797 to 0.837 (AUC is maximized at P value cutoff 5 × 10⁻⁸ and r2 = 0.2). The maximum PRS AUC of 0.837 is not particularly sensitive to our logistic regression model; e.g., when we adjusted four PCs instead of two PCs, the maximum AUC changed to 0.838. The ROC curves of GRS, genotype-based PRS, minimal PRS, and maximal PRS in one cross-validation data set are shown in Supplementary Fig. 2.
Conclusions
Identification of individuals at increased genetic risk for type 1 diabetes can enhance diagnostic and management practices by targeting at-risk children that could benefit from screening for presence of islet autoantibodies that are highly predictive of disease onset. This strategy has been implemented in the Fr1da study (34) and the prospective TEDDY (The Environmental Determinants of Diabetes in the Young) cohort (9). A critical component of understanding who is at high genetic risk for type 1 diabetes is the application of a GRS with high sensitivity and specificity (the predictive values will always be low, given the low population prevalence of type 1 diabetes). The majority of individuals who develop type 1 diabetes that have been characterized, to date, are children of European ancestry, but it is now apparent that individuals of other ancestries (2) as well as adults (35) are developing or being better ascertained as having type 1 diabetes at an increasing rate. A critical question is whether a type 1 diabetes GRS developed in European-ancestry populations, with age at onset <16 years, performs well in other populations.
Despite extensive genetic research in type 1 diabetes, data from populations of non-European ancestry and adult-onset disease remain limited. In this report, we have assembled and genotyped the largest collection of African-ancestry type 1 diabetes cases studied to date, conducted association analyses at autoimmune disease loci using the ImmunoChip, developed an African-ancestry type 1 diabetes GRS, and compared its prediction with an European-ancestry type 1 diabetes GRS. The African-ancestry population provided concordant findings for some loci (e.g., HLA), revealed alternative risk alleles at other loci (e.g., RNLS) (Fig. 1C), and reduced the number of candidate causal variants for functional studies at other, disease-associated but genetically complex regions (12q13.2 and 17q12). At loci implicated in type 1 diabetes risk in European-ancestry populations, there was consistency in effect size and direction of effect of associated SNPs in African-ancestry populations, even when the smaller sample size in African-ancestry population did not achieve statistical significance (Table 1). Our large collection of African-ancestry case and control subjects supports the impact of HLA class II–associated risk alleles and haplotypes on type 1 diabetes risk that parallels those observed in European-ancestry populations (29). In addition to HLA class II genes, we identified new significant associations for HLA-A, HLA-B, and HLA-C alleles with type 1 diabetes in African-ancestry populations (Table 2). We note that, as is the case with SNP imputation, common HLA alleles will be imputed at a greater accuracy and caution is necessary in interpreting results from less common HLA alleles and haplotypes.
GRS, an emerging approach to integrating the complex genetic architecture of human disease risk, are typically created through the summation of genome-wide significant SNP genotypes and their effect sizes into a single number that differentiates case from control status. Performance of a GRS depends upon the proportion of the SNPs included in the score to the total genetic risk, as well as any population-specific content. Type 1 diabetes, with ∼50% of risk attributed to genetic factors, is unique among complex human genetic diseases in that the majority of genetic risk is now known (6) in European-ancestry populations, suggesting that a type 1 diabetes GRS can be used in clinical practice to improve classification and treatment in those with overlapping features of type 1 diabetes and monogenic or type 2 diabetes, as has been demonstrated for a European-ancestry GRS (7,8). However, in the current study we found that such a European-ancestry type 1 diabetes GRS performs significantly less well than an African-ancestry type 1 diabetes GRS when applied to African-ancestry populations. A recent report on the performance of an African-ancestry GRS in type 2 diabetes, composed of 22 SNPs related to β-cell dysfunction and insulin resistance, provides an increased (although not significant) risk prediction for disease (36), perhaps due to the relatively small amount of genetic variation in type 2 diabetes risk captured by the SNPs chosen. In the context of type 1 diabetes, the identification of individuals at high genetic risk can be used to offer targeted population screening for the presence of islet autoantibodies (9). While no current intervention is available to slow or stop progression of islet autoimmunity to clinical type 1 diabetes, this information can improve surveillance, management, and education of individuals and families and provide protection from diabetic ketoacidosis (37).
In conclusion, genetic analyses of type 1 diabetes in African-ancestry participants highlights the consistency of regional genomic associations with disease risk across populations, and yet the population-specific nature of SNP associations within these chromosomal regions influences the performance of genetic risk models. These results suggest that population-specific GRS can provide significantly improved prediction and opportunities for targeted interventions in individuals at risk for type 1 diabetes.
Supplementary Material
Article Information
Acknowledgments. The tutorial on risk prediction using KING (23) and access to the tool set can be found at http://people.virginia.edu/∼wc9c/KING/riskprediction.html. The authors thank the following groups and individuals who provided biological samples or data for this study. DNA samples were obtained from SEARCH, GoKinD, BDC, UCSF, UAB, CLEAR, and NYCP. The authors thank the following CLEAR investigators who performed recruiting: Drs. Doyt Conn (Grady Hospital and Emory University, Atlanta, GA), Beth Jonas and Leigh Callahan (University of North Carolina at Chapel Hill, Chapel Hill, NC), Edwin Smith (Medical University of South Carolina, Charleston, SC), Richard Brasington (Washington University, St. Louis, MO), and Larry W. Moreland (University of Pittsburgh). DNA samples from UAB were recruited, in part, with the support of P01-AR49084 (R.P.K., principal investigator [PI]) and of UL1-TR001417 (R.P.K., PI). The authors thank Dr. Daniel Perry and Kieran McGrail for their efforts in sample ascertainment at the Diabetes Institute, University of Florida. The SEARCH for Diabetes in Youth Study is indebted to the many youth and their families, as well as their health care providers, whose participation made this study possible.
Funding. This research utilizes resources provided by the T1DGC, a collaborative clinical study sponsored by the National Institute of Diabetes and Digestive and Kidney Diseases (NIDDK), National Institute of Allergy and Infectious Diseases, National Human Genome Research Institute, National Institute of Child Health and Human Development, and JDRF and supported by U01 DK062418. Further support was provided by grants from the NIDDK (DK096926 to S.S.R., DK46635 and DK085678 to P.C.), a grant from the National Human Genome Research Institute (5R01HG008965) to W.-M.C., a grant from the National Institute of Allergy and Infectious Diseases (P01AI042288) to M.A.A., and a training grant from the U.S. National Library of Medicine (5T32LM012416). The CLEAR Registry and Repository was funded by National Institutes of Health (NIH) Office of the Director grants N01-AR-0-2247 (9/30/2000–9/29/2006) and N01 AR-6-2278 (9/30/2006–3/31/2012) (S.L.B., PI). SEARCH for Diabetes in Youth is funded by the Centers for Disease Control and Prevention (PA numbers 00097, DP-05-069, and DP-10-001) and supported by the NIDDK. SEARCH Site Contract Numbers: Kaiser Permanente Southern California (U48/CCU919219, U01 DP000246, and U18DP002714), University of Colorado Denver (U48/CCU819241-3, U01 DP000247, and U18DP000247-06A1), Children’s Hospital Medical Center (Cincinnati) (U48/CCU519239, U01 DP000248, and 1U18DP002709), University of North Carolina at Chapel Hill (U48/CCU419249, U01 DP000254, and U18DP002708), University of Washington School of Medicine (U58/CCU019235-4, U01 DP000244, and U18DP002710-01), Wake Forest University School of Medicine (U48/CCU919219, U01 DP000250, and 200-2010-35171). The authors wish to acknowledge the involvement of the South Carolina Clinical & Translational Research Institute at the Medical University of South Carolina (NIH/National Center for Advancing Translational Sciences [NCATS] grant number UL1 TR000062), Seattle Children’s Hospital and the University of Washington (NIH/NCATS grant number UL1 TR00423), University of Colorado Pediatric Clinical and Translational Research Center (NIH/NCATS grant number UL1 TR000154), the Barbara Davis Center at the University of Colorado Denver (DERC NIH grant number P30 DK57516), the University of Cincinnati (NIH/NCATS grant number UL1 TR000077), and the Children with Medical Handicaps program managed by the Ohio Department of Health. This study includes data provided by the Ohio Department of Health, which should not be considered an endorsement of this study or its conclusions.
The findings and conclusions in this report are those of the authors and do not necessarily represent the official position of the Centers for Disease Control and Prevention and the National Institute of Diabetes and Digestive and Kidney Diseases.
Duality of Interest. No potential conflicts of interest relevant to this article were reported.
Author Contributions. The study was conceptually designed by S.O.-G., P.C., and S.S.R. The study was implemented by S.O.-G., E.F., T1DGC, P.C., and S.S.R. DNA samples were provided by J.R.O., S.L.B., J.C.E., R.P.K., P.K.G., M.J.R., A.K.S., J.D., R.A.B., and S.S.R. Genotype data for CLEAR were provided by S.L.B., and UAB controls were provided by J.C.E. and R.P.K. CLEAR and UAB samples were genotyped at the Feinstein Institute for Medical Research under supervision of P.K.G. Genotype data for samples from the University of Florida were provided by M.A.A. and P.C. DNA samples processed at the University of Virginia were managed and genotyped by S.O.-G. and E.F. Genotype clusters and laboratory quality control were conducted by S.O.-G. and E.F. Statistical quality control methods were implemented by W.-M.C., C.C.R., and J.K.B. Statistical analyses were performed by W.-M.C., C.C.R., and J.K.B. The paper was written by S.O.-G., W.-M.C., H.A.E., P.C., and S.S.R. All authors reviewed and contributed to the final paper. S.O.-G., W.-M.C., and S.S.R. are the guarantors of this work and, as such, had full access to all the data in the study and take responsibility for the integrity of the data and the accuracy of the data analysis.
Prior Presentation. Parts of this study were presented in abstract form at the American Society of Human Genetics 2016 Annual Meeting in Vancouver, British Columbia, Canada, 18–22 October 2016, and 2017 Annual Meeting in Orlando, FL, 17–21 October 2017.
Footnotes
This article contains Supplementary Data online at http://care.diabetesjournals.org/lookup/suppl/doi:10.2337/dc18-1727/-/DC1.
S.O.-G. and W.-M.C. contributed equally to this work.
P.C. and S.S.R. contributed equally to this work.
R.A.B. is currently affiliated with Department of Public Health, East Carolina University, Greenville, NC.
P.C. is currently affiliated with University of Florida Genetics Institute and Department of Pathology, Immunology and Laboratory Medicine, University of Florida, Gainesville, FL.
A complete list of the members of SEARCH for Diabetes in Youth and the Type 1 Diabetes Genetics Consortium can be found in the Supplementary Data online.
References
- 1.Genuth S, Alberti KG, Bennett P, et al.; Expert Committee on the Diagnosis and Classification of Diabetes Mellitus . Follow-up report on the diagnosis of diabetes mellitus. Diabetes Care 2003;26:3160–3167 [DOI] [PubMed] [Google Scholar]
- 2.Mayer-Davis EJ, Lawrence JM, Dabelea D, et al.; SEARCH for Diabetes in Youth Study . Incidence trends of type 1 and type 2 diabetes among youths, 2002-2012. N Engl J Med 2017;376:1419–1429 [DOI] [PMC free article] [PubMed] [Google Scholar]
- 3.Dabelea D, Stafford JM, Mayer-Davis EJ, et al.; SEARCH for Diabetes in Youth Research Group . Association of type 1 diabetes vs type 2 diabetes diagnosed during childhood and adolescence with complications during teenage years and young adulthood. JAMA 2017;317:825–835 [DOI] [PMC free article] [PubMed] [Google Scholar]
- 4.Barrett JC, Clayton DG, Concannon P, et al.; Type 1 Diabetes Genetics Consortium . Genome-wide association study and meta-analysis find that over 40 loci affect risk of type 1 diabetes. Nat Genet 2009;41:703–707 [DOI] [PMC free article] [PubMed] [Google Scholar]
- 5.Bradfield JP, Qu HQ, Wang K, et al. . A genome-wide meta-analysis of six type 1 diabetes cohorts identifies multiple associated loci. PLoS Genet 2011;7:e1002293. [DOI] [PMC free article] [PubMed] [Google Scholar]
- 6.Onengut-Gumuscu S, Chen WM, Burren O, et al.; Type 1 Diabetes Genetics Consortium . Fine mapping of type 1 diabetes susceptibility loci and evidence for colocalization of causal variants with lymphoid gene enhancers. Nat Genet 2015;47:381–386 [DOI] [PMC free article] [PubMed] [Google Scholar]
- 7.Oram RA, Patel K, Hill A, et al. . A type 1 diabetes genetic risk score can aid discrimination between type 1 and type 2 diabetes in young adults. Diabetes Care 2016;39:337–344 [DOI] [PMC free article] [PubMed] [Google Scholar]
- 8.Patel KA, Oram RA, Flanagan SE, et al. . Type 1 diabetes genetic risk score: a novel tool to discriminate monogenic and type 1 diabetes. Diabetes 2016;65:2094–2099 [DOI] [PMC free article] [PubMed] [Google Scholar]
- 9.Bonifacio E, Beyerlein A, Hippich M, et al.; TEDDY Study Group . Genetic scores to stratify risk of developing multiple islet autoantibodies and type 1 diabetes: a prospective study in children. PLoS Med 2018;15:e1002548. [DOI] [PMC free article] [PubMed] [Google Scholar]
- 10.Perry DJ, Wasserfall CH, Oram RA, et al. . Application of a genetic risk score to racially diverse type 1 diabetes populations demonstrates the need for diversity in risk-modeling. Sci Rep 2018;8:4529. [DOI] [PMC free article] [PubMed] [Google Scholar]
- 11.Dabelea D, Mayer-Davis EJ, Saydah S, et al.; SEARCH for Diabetes in Youth Study . Prevalence of type 1 and type 2 diabetes among children and adolescents from 2001 to 2009. JAMA 2014;311:1778–1786 [DOI] [PMC free article] [PubMed] [Google Scholar]
- 12.Noble JA, Johnson J, Lane JA, Valdes AM. HLA class II genotyping of African American type 1 diabetic patients reveals associations unique to African haplotypes. Diabetes 2013;62:3292–3299 [DOI] [PMC free article] [PubMed] [Google Scholar]
- 13.Howson JM, Roy MS, Zeitels L, Stevens H, Todd JA. HLA class II gene associations in African American type 1 diabetes reveal a protective HLA-DRB1*03 haplotype. Diabet Med 2013;30:710–716 [DOI] [PMC free article] [PubMed] [Google Scholar]
- 14.Sunni M, Noble JA, Yu L, et al. . Predominance of DR3 in Somali children with type 1 diabetes in the twin cities, Minnesota. Pediatr Diabetes 2017;18:136–142 [DOI] [PubMed] [Google Scholar]
- 15.Rich SS, Concannon P, Erlich H, et al. . The Type 1 Diabetes Genetics Consortium. Ann N Y Acad Sci 2006;1079:1–8 [DOI] [PubMed] [Google Scholar]
- 16.SEARCH Study Group SEARCH for Diabetes in Youth: a multicenter study of the prevalence, incidence and classification of diabetes mellitus in youth. Control Clin Trials 2004;25:458–471 [DOI] [PubMed] [Google Scholar]
- 17.Mueller PW, Rogus JJ, Cleary PA, et al. . Genetics of Kidneys in Diabetes (GoKinD) study: a genetics collection available for identifying genetic susceptibility factors for diabetic nephropathy in type 1 diabetes. J Am Soc Nephrol 2006;17:1782–1790 [DOI] [PMC free article] [PubMed] [Google Scholar]
- 18.Rewers M, Bugawan TL, Norris JM, et al. . Newborn screening for HLA markers associated with IDDM: Diabetes Autoimmunity Study in the Young (DAISY). Diabetologia 1996;39:807–812 [DOI] [PubMed] [Google Scholar]
- 19.Danila MI, Laufer VA, Reynolds RJ, et al. . Dense genotyping of immune-related regions identifies loci for rheumatoid arthritis risk and damage in African Americans. Mol Med 2017;23:177–187 [DOI] [PMC free article] [PubMed] [Google Scholar]
- 20.Mitchell MK, Gregersen PK, Johnson S, Parsons R, Vlahov D; New York Cancer Project . The New York Cancer Project: rationale, organization, design, and baseline characteristics. J Urban Health 2004;81:301–310 [DOI] [PMC free article] [PubMed] [Google Scholar]
- 21.Li X, Wu J, Ptacek T, et al. . Allelic-dependent expression of an activating Fc receptor on B cells enhances humoral immune responses. Sci Transl Med 2013;5:216ra175. [DOI] [PMC free article] [PubMed] [Google Scholar]
- 22.Isobe N, Madireddy L, Khankhanian P, et al.; International Multiple Sclerosis Genetics Consortium . An ImmunoChip study of multiple sclerosis risk in African Americans. Brain 2015;138:1518–1530 [DOI] [PMC free article] [PubMed] [Google Scholar]
- 23.Manichaikul A, Mychaleckyj JC, Rich SS, Daly K, Sale M, Chen WM. Robust relationship inference in genome-wide association studies. Bioinformatics 2010;26:2867–2873 [DOI] [PMC free article] [PubMed] [Google Scholar]
- 24.Purcell S, Neale B, Todd-Brown K, et al. . PLINK: a tool set for whole-genome association and population-based linkage analyses. Am J Hum Genet 2007;81:559–575 [DOI] [PMC free article] [PubMed] [Google Scholar]
- 25.Pruim RJ, Welch RP, Sanna S, et al. . LocusZoom: regional visualization of genome-wide association scan results. Bioinformatics 2010;26:2336–2337 [DOI] [PMC free article] [PubMed] [Google Scholar]
- 26.de Bakker PI, Ferreira MA, Jia X, Neale BM, Raychaudhuri S, Voight BF. Practical aspects of imputation-driven meta-analysis of genome-wide association studies. Hum Mol Genet 2008;17:R122–R128 [DOI] [PMC free article] [PubMed] [Google Scholar]
- 27.Jia X, Han B, Onengut-Gumuscu S, et al. . Imputing amino acid polymorphisms in human leukocyte antigens. PLoS One 2013;8:e64683. [DOI] [PMC free article] [PubMed] [Google Scholar]
- 28.Hilner JE, Perdue LH, Sides EG, et al.; T1DGC . Designing and implementing sample and data collection for an international genetics study: the Type 1 Diabetes Genetics Consortium (T1DGC). Clin Trials 2010;7(Suppl.):S5–S32 [DOI] [PMC free article] [PubMed] [Google Scholar]
- 29.Erlich H, Valdes AM, Noble J, et al.; Type 1 Diabetes Genetics Consortium . HLA DR-DQ haplotypes and genotypes and type 1 diabetes risk: analysis of the Type 1 Diabetes Genetics Consortium families. Diabetes 2008;57:1084–1092 [DOI] [PMC free article] [PubMed] [Google Scholar]
- 30.Mychaleckyj JC, Noble JA, Moonsamy PV, et al.; T1DGC . HLA genotyping in the international Type 1 Diabetes Genetics Consortium. Clin Trials 2010;7(Suppl.):S75–S87 [DOI] [PMC free article] [PubMed] [Google Scholar]
- 31.R Core Team. R: a language and environment for statistical computing (Internet). Vienna, Austria, R Foundation for Statistical Computing. Available from http://www.r-project.org/. Accessed 19 October 2016
- 32.DeLong ER, DeLong DM, Clarke-Pearson DL. Comparing the areas under two or more correlated receiver operating characteristic curves: a nonparametric approach. Biometrics 1988;44:837–845 [PubMed] [Google Scholar]
- 33.Noble JA, Valdes AM, Varney MD, et al.; Type 1 Diabetes Genetics Consortium . HLA class I and genetic susceptibility to type 1 diabetes: results from the Type 1 Diabetes Genetics Consortium. Diabetes 2010;59:2972–2979 [DOI] [PMC free article] [PubMed] [Google Scholar]
- 34.Raab J, Haupt F, Scholz M, et al.; Fr1da Study Group . Capillary blood islet autoantibody screening for identifying pre-type 1 diabetes in the general population: design and initial results of the Fr1da study. BMJ Open 2016;6:e011144. [DOI] [PMC free article] [PubMed] [Google Scholar]
- 35.Thomas NJ, Jones SE, Weedon MN, Shields BM, Oram RA, Hattersley AT. Frequency and phenotype of type 1 diabetes in the first six decades of life: a cross-sectional, genetically stratified survival analysis from UK Biobank. Lancet Diabetes Endocrinol 2018;6:122–129 [DOI] [PMC free article] [PubMed] [Google Scholar]
- 36.Layton J, Li X, Shen C, et al. . Type 2 diabetes genetic risk scores are associated with increased type 2 diabetes risk among African Americans by cardiometabolic status. Clin Med Insights Endocrinol Diabetes 2018;11:1179551417748942. [DOI] [PMC free article] [PubMed] [Google Scholar]
- 37.Steck AK, Larsson HE, Liu X, et al.; TEDDY Study Group . Residual beta-cell function in diabetes children followed and diagnosed in the TEDDY study compared to community controls. Pediatr Diabetes 2017;18:794–802 [DOI] [PMC free article] [PubMed] [Google Scholar]
Associated Data
This section collects any data citations, data availability statements, or supplementary materials included in this article.