Abstract
Spectral information in CT maybe used for material decomposition to produce accurate reconstructions of material density and to separate materials with similar overall attenuation. Traditional methods separate the reconstruction and decomposition steps, often resulting in undesirable trade-offs (e.g. sampling constraints, a simplified spectral model). In this work, we present a model-based material decomposition algorithm which performs the reconstruction and decomposition simultaneously using a multienergy forward model. In a kV-switching simulation study, the presented method is capable of reconstructing iodine at 0.5 mg ml−1 with a contrast-to-noise ratio greater than two, as compared to 3.0 mg ml−1 for image domain decomposition. The presented method also enables novel acquisition methods, which was demonstrated in this work with a combined kV-switching/split-filter acquisition explored in simulation and physical test bench studies. This novel design used four spectral channels to decompose three materials: water, iodine, and gadolinium. In simulation, the presented method accurately reconstructed concentration value estimates with RMSE values of 4.86 mg ml−1 for water, 0.108 mg ml−1 for iodine and 0.170 mg ml−1 for gadolinium. In test-bench data, the RMSE values were 134 mg ml−1,5.26 mg ml−1 and 1.85 mg ml−1, respectively. These studies demonstrate the ability of model-based material decomposition to produce accurate concentration estimates in challenging spatial/spectral sampling acquisitions.
Keywords: contrast, iodine, gadolinium, split filter, kV-switching, multi-energy, spectral
1. Introduction
Spectral CT has found clinical application in a number of imaging scenarios, including contrast enhanced applications such as anthrography (Chai et al 2014, Zbijewski et al 2014), angiography (Tran et al 2009), and lung ventilation (Chae et al 2008),as well as urinary stone classification (Stolzmann et al 2010) and bone marrow lesion detection (Pache et al 2010). Spectral CT permits separation of different materials (material decomposition) which may have similar attenuation values by exploiting differences in their spectral properties. For example, while iodinated contrast agents and calcified plaques can appear similar in traditional CT angiography, they can be distinguished in spectral CT (Tran et al 2009). Additionally, material decomposition results in density estimates for each material, as compared to overall attenuation in traditional CT, which are often more physiologically relevant than attenuation—e.g. in bone mineral density studies (Cann 1988). Finally, spectral CT facilitates reduction of beam hardening artifacts, which are caused by monoenergetic model assumptions in traditional CT.
Material decomposition utilizes multiple types, or channels, of measurements with different spectral properties. Such channels can be obtained in many ways. Strategies include multiple energy bins in photon counting detectors (Wang et al 2011) and data acquired with different incident x-ray spectra, either via different tube voltages (Grasruck et al 2009, Huh et al 2009, Xu et al 2009) or differential filtering (Ritchings and Pullan 1979, Rutt and Fenster 1980, Taschereau et al 2009, Long et al 2011). Combining this multi-channel data with knowledge of the x-ray spectra and the attenuation properties of the materials being imaged enables reconstruction of individual material density images.
Traditionally, material decomposition is performed separately from the reconstruction. In projection domain decomposition (PDD) (Alvarez and Macovski 1976) material specific line integrals are estimated from the measurements using a polyenergetic forward model. Because this is done independently for each integration path (i.e. each ‘ray’ through the object from source to detector), this method requires multiple channels for each ray. In other words, the different energy channels need to be geometrically matched so they correspond to the same integration paths through the object. This is the case in photon counting detectors, where each detector element has multiple energy bins. However, other approaches may not meet this criteria—e.g. kV switching (Huh et al 2009)—or only meet this criteria after re-binning—e.g. split filter with sufficient sampling (Rutt and Fenster 1980). In image domain decomposition (IDD), the spectral channels are reconstructed independently, and material density images are estimated from the reconstructions (Brooks 1977, Goodsitt et al 1987, Maaß et al 2009). The IDD method is capable of using unmatched measurements, but because the channels are reconstructed separately, each channel needs sufficient sampling. Additionally, IDD may require separate correction for spectral effects such as beam-hardening (Joseph and Spital 1978).
Model-based material decomposition (MBMD) techniques perform the decomposition and the reconstruction simultaneously. MBMD is a form of model-based iterative reconstruction (MBIR), which minimizes an objective function derived from a physical and statistical model of the measurement process. MBMD includes a polyenergetic forward model which relates material densities to the measurement data, allowing direct estimation of the material image volumes. Such a direct approach has many advantages as compared to traditional methods. MBMD does not require matched data as in PDD, and does not necessarily require each channel to be sufficiently sampled as in IDD (because the densities are reconstructed from all channels simultaneously). Because MBMD uses a polyenergetic forward model, beam hardening effects can be eliminated (in contrast to traditional IDD, where removing beam-hardening artifacts requires a pre-correction). Lastly, regularization in MBMD acts jointly on both the decomposition and reconstruction, as opposed to traditional methods which either only regularize the reconstruction (potentially resulting in noisy decomposition) or require separate regularization for each step (increasing the number of free parameters). Multiple MBMD methods have been developed (Huh et al 2009, Long et al 2011, Long and Fessler 2014, Barber et al 2016, Weidinger et al 2016, Chen et al 2017, Mechlem et al 2017, Shen et al 2018b). Additionally, Zhang et al (2014) have developed a hybrid approach, in which the noise properties of the initial PDD (e.g. correlation between material line integrals) are modeled in the subsequent MBIR reconstruction.
In Tilley et al (2017a) we presented a MBIR method with a general nonlinear forward model and Gaussian noise model, which is capable of modeling a wide range of physical effects. The objective function is minimized using an optimization transfer approach with optional ordered subsets (Hudson and Larkin 1994) and momentum acceleration (Nesterov 2005, Kim et al 2015). We have used this method to model shift-invariant scintillator and focal spot blur (Tilley et al 2017a) shift-variant focal spot blur (Tilley et al 2017b), gantry motion, and detector lag (Tilley et al 2018a). The mathematical model used in these studies is sufficiently general to accommodate a polyenergetic forward model, and can therefore be used for MBMD. Because this MBMD approach has the same general forward model, it uses the existing optimization algorithm derived in Tilley et al (2017a). This approach differs from the aforementioned MBMD methods in that it is the only penalized weighted least-squares MBMD method (Gaussian noise model) utilizing optimization transfer and operating on pre-log data. Preliminary studies demonstrated using this method for material decomposition using unmatched measurement data to decompose water and calcium or K2HPO4 (a bone mimicking compound (Goodsitt et al 1987)) in both simulation and bench studies with kV switching (Tilley et al 2018b). This method was also applied in initial investigations of a novel, simulated system using tiled spectral filters capable of an arbitrary number of spectral channels (Stayman and Tilley 2018).
In this work we provide an in-depth description on how to apply the general MBIR method in Tilley et al (2017a) to material decomposition, resulting in the proposed MBMD method. We compare this MBMD method to IDD in a simulated cone-beam CT (CBCT) kV-switching scenario with water-iodine decomposition, focusing on the sensitivity of each method to iodine concentration. (While this work uses CBCT systems, all reconstructions are at or near the central plane, so cone beam artifacts are minimal.) Additionally, we use MBMD to decompose water, iodine, and gadolinium in both a CBCT simulation study and in a CBCT test bench study with a unique acquisition protocol: combining a split filter with kV-switching to obtain four spectral channels.
2. Methods
2.1. Reconstruction algorithm
All MBIR methods generally consist of a forward model, which is a mathematical description of the measurement process and associated statistical properties, and a corresponding objective function, which is a goodness-of-fit measure between the measurements and an image volume estimate. The reconstruction process seeks to find an optimal volume estimate for this objective function. In this section we summarize the general MBIR approach described in Tilley et al (2017a) and develop a MBMD forward model that fits this framework. Throughout this paper, matrices are denoted in upright bold uppercase, and vectors in italic bold lowercase. Elements of matrices and vectors are indicated by corresponding non-bold variables with subscripts. For example, Aij is the element at the ith row and jth column of matrix A. Additionally, the exponential function is always applied element-wise.
In Tilley et al (2017a), we presented a general algorithm for image estimation with the following forward model:
| (1a) |
| (1b) |
where y denotes a vector of measurements and x is the (image) vector to be estimated. Measurements (y) are modeled as a multivariate Gaussian random variable with mean ȳ and covariance matrix K. The matrices B and M are arbitrary (with the condition that the sum of each row of BTK−1B is non-negative and all elements of M are non-negative) and maybe chosen to model different physical aspects of the measurement process. The corresponding penalized weighted least-squares objective function is
| (2) |
where R (x) is a regularizer (e.g. a roughness penalty). The algorithm in Tilley et al (2017a) (pseudocode below in algorithm 1) minimizes this objective function using separable surrogates. The approach has options to use tomography-specific enhancements like ordered subsets (Hudson and Larkin 1994) as well as more general methods like momentum-based acceleration (Nesterov 2005, Kim et al 2015) to improve the convergence rate.
The forward model in (1) may be used to model a wide range of physical effects. For example, if x denotes a typical vector of attenuation values, M is the system matrix, and B is a diagonal matrix (e.g. which multiplies each measurement by a gain associated with the photon flux), then one obtains a traditional monoenergetic forward model for computed tomography. A more sophisticated forward model can use a modified B to model focal spot blur and scintillator blur (Tilley et al 2017a). Moreover, both B and M may be modified to model shift-variant focal spot blur using a sourcelets model, or gantry motion using angular oversampling (Tilley et al 2018a). In this paper we leverage the same mathematical framework to perform simultaneous reconstruction and material decomposition by incorporating a spectral model into (1a).
To accommodate the MBMD objective, one must relate densities of specific materials to the tomographic measurements. Moreover, since material decomposition relies on energy-dependent attenuation differences between materials, the forward model must encompass the polyenergetic nature of the measurement process and the mechanisms of spectral discrimination. Towards this end, we define the following data model. For simplicity, we present the mean model in terms of an individual measurement, ȳi:
| (3) |
This forward model presumes the object is composed of Nm basis materials. For each material (m), a (image volume) vector of material density values is forward projected using a system matrix (A). For each energy (E), line integrals for that basis material are multiplied by the material-specific mass attenuation coefficient (μ(m) (E)) to obtain material- and energy-dependent line integrals. After summing over basis materials, Beer’s law is applied to the energy-dependent line integrals, and the result is scaled by the energy-dependent system response (S(i)(E)). The expected value of each measurement is obtained by integrating over energy. The system response is a general function that permits modeling of both source spectra (including filtration) as well as detector response. Note that S(i)(E) is also indexed by the measurement (i), which allows modeling of a wide variety of spectral CT strategies including multiple spectral filters, view-dependent energies (e.g. kV switching), and energy-discriminating detector bins. The number of spectral channels of an acquisition is the number of unique normalized spectral responses. For example, in a simple kV-switching acquisition, all the S(i) for even numbered projections would be equal, and likewise for odd numbered projections, resulting in two spectral channels. All of the pertinent variables of this forward model are summarized in table 1. In this paper we adopt a version of (3) that is discretized in energy:
| (4) |
where NE is the number of energy bins and ΔE is the width of each bin (in this work 1 kV). One may also scale by mass attenuation coefficients and sum over materials prior to the forward projection, but this would result in Ne forward projections as opposed to Nm forward projections. In this work NE is much larger than Nm, so performing projection operations first is more efficient.
Table 1.
Notation summary.
| Variable | Description | Units | Size |
|---|---|---|---|
| Nj | Number of voxels in the image | — | — |
| Ni | Number of measurements | — | — |
| Nm | Number of materials | — | — |
| NE | Number of energies | — | — |
| A | System matrix | mm | Ni × Nj |
| p(m) | Vector of densities for material m | g mm−3 | Nj × 1 |
| μ(m) (E) | Mass attenuation coefficient of material m at energy E | mm2g−1 | |
| S(i) (E) | System spectral response of measurement i at energy E | photon kV−1 | |
| x | Concatenated density vectors of all materials | g mm−3 | (Nm · Nj) × 1 |
| M | mm3 g−1 | (NE · Ni) × (Nm · Nj) | |
| B | photon | Ni × (NE · Ni) |
Equation (4) can be written in the form of (1a ), permitting use of the previously developed MBIR algorithm. Denoting I(n) as an n × n identity matrix, we may write the terms in (1a ) as
| (5) |
| (6) |
| (7) |
The outputs of the MBMD algorithm with these substitutions are images of the local density of each base material , as opposed to images of attenuation values as in traditional methods. While some multienergy methods produce images of attenuation values at different energies (e.g. monoenergetic reconstructions), the MBMD approach estimates material density values directly.
Note that explicit formation of these matrices is not required, nor desirable for implementation due to their size. For computational implementation, a functional approach is adopted—computing the result of each matrix multiplication without explicitly creating the matrix. For example, to apply B, each element of the input is scaled by the appropriate term in S, and then the result is summed over energy.
Though the noise model is general, in this work, we presume uncorrelated measurement noise such that
| (8) |
where D {·} forms a diagonal matrix with its argument on the diagonal, and σr0 is the equivalent readout noise standard deviation in photons. In order to utilize existing penalty functions, the penalty is applied separately for each material density image
| (9) |
where β(m) is the penalty strength for material m and Rp is a penalty function for an individual material density image.
2.2. Image domain decomposition
We used the following IDD approach for comparison with MBMD. Each energy channel is reconstructed with standard MBIR with system matrix M = A and a simple B = D {I0} that accommodates a gain due to photon flux (I0 photons per pixel). These assumptions are typical for MBIR, and implicitly assume a monoenergetic spectrum. IDD is then applied to these reconstructions. Traditionally, IDD is applied to analytical reconstructions (e.g. FDK). However, in this work MBIR is used as a more fair comparison to MBMD. A comparison between different reconstruction methods with IDD can be found in Zbijewski et al (2014). We used the following model for each voxel in the reconstructions of Nc spectral channels:
| (10) |
where Û is a Nc × Nm matrix of effective attenuation values, r is a Nc × 1 vector of voxel attenuation values from each spectral channel reconstruction, and is a Nm × 1 vector of material densities for that voxel. (In this work only two materials were estimated using IDD from two spectral channels, so there was no need to incorporate a volume constraint.) Each effective attenuation value is defined as the average mass attenuation value weighted by energy (Brooks 1977)
| (11) |
where S(c) is the system spectral response of channel c. The normal equations are used to find a least squares estimate for
| (12) |
This estimation process is applied to each voxel separately.
2.3. Iodine sensitivity simulation study
We compared the sensitivity of IDD and MBMD to iodine concentration using the digital phantom in figure 1. Data were generated using a kV-switching scheme (Zou and Silver 2008, Grasruck et al 2009, Huh et al 2009, Xu et al 2009) with 80 kVp and 140 kVp spectra alternating every frame. This experiment investigates whether MBMD offers improvements over traditional methods with standard acquisition schemes.
Figure 1.
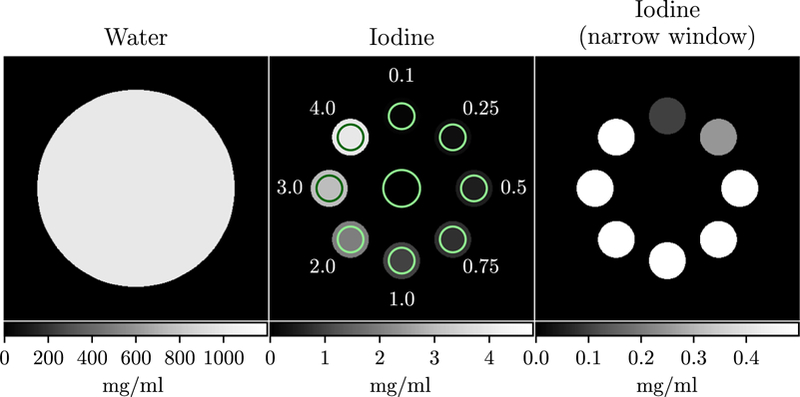
Iodine sensitivity phantom. The numbers indicate the iodine concentration in each adjacent region of interest (ROI) in mg ml-1. ROI specific contrast-to-noise ratio (CNR) was calculated as the ratio of the mean in the regions indicated by the circles along the edge of the phantom to the standard deviation in the inner circle.
The phantom was created with 0.25 mm × 0.25 mm voxels. Data were generated according to (1a) with a 60 cm source-to-isocenter distance, a 120 cm source-to-detector distance, a 0.278 mm pixel pitch and 360 projections in 1º increments. The data were binned to 0.556 mm pixels to model nonlinear partial volume effects. The bare-beam intensity was 104 photons/pixel after binning. Lastly, Poisson noise and readout noise (σro = 7.109 photons/pixel) were added to the data.
Mass attenuation coefficients were obtained from NIST (Hubbell and Seltzer 2004), and emitted x-ray spectra were calculated using Spektr (Punnoose et al 2016) with an inherent filtration of 1.6 mm of aluminum. Mass attenuation curves were interpolated to match the energy sampling of the spectra (one sample per kV from 5 kV to 140kV). Emitted spectra had peak kVs of 80 and 140 and were modified by filtration with 2.0 mm of aluminum and 0.2 mm of copper. PeakkV was switched every projection (1°). The Csl scintillator in the indirect detector was modeled with 0.6 mm thickness.
Data were reconstructed with both MBMD and MBIR with the monoenergetic model (for IDD) with 0.5 mm × 0.5 mm voxels, 2000 iterations, nine ordered subsets, and momentum-based acceleration (Nesterov 2005, Kim et al 2015). Monoenergetic MBIR for IDD was initialized with a FDK reconstruction (Feldkamp et al 1984). MBMD reconstructions also used a FDK reconstruction, which was segmented to determine the support of the object. The support was assumed to be uniformly water with constant density. MBMD was initialized with this water-only image. (Even though FDK may have cone beam artifacts, it’s still a reasonable initializer for MBIR, providing a computationally fast estimate whose artifacts are (generally) resolved with MBIR.)
A quadratic regularizer was used for all reconstructions. Specifically,
| (13) |
where Ni is the set of the indices corresponding to the six nearest neighbors (four nearest neighbors in 2D) of the voxel at index i. Both IDD and MBMD require two regularization strengths (either for each energy reconstruction or for each material density image, respectively). A two-dimensional sweep was performed for each method, and the optimal reconstruction was determined as the one with the minimum root mean squared error (RMSE) over the entire reconstruction (x in (1a)). The CNR for each ROI from these optimal reconstructions was calculated as the average value in the ROI divided by the standard deviation in the center of the image (ROI locations are indicated in figure 1). CNR values were compared to evaluate the sensitivity of each method to iodine concentration.
2.4. Kilovolt-switching with split-filtration simulation studies
We evaluate the application of this MBMD approach in another simulated spectral CT scenario that uses a combination of kV-switching and split-filters to obtain different spectral channels (illustrated in figure 2). Kilovolt-switching (Zou and Silver 2008, Grasruck et al 2009, Huh et al 2009,Xu et al 2009) and split-filters (Rutt and Fenster 1980, Euler et al 2016, Fung et al 2016) maybe used to acquire multiple channels of spectral data by altering the incident spectra temporally or spatial, respectively. Each technique presents different sampling trade-offs, either reducing angular sampling (kV-switching) or spatial sampling (split-filters). Both techniques result in non-coincident rays, precluding PDD (without interpolation/re-binning). By combining both techniques, both the number of spectral channels and the sampling challenges are compounded, providing a unique scenario with which to evaluate the MBMD method.
Figure 2.
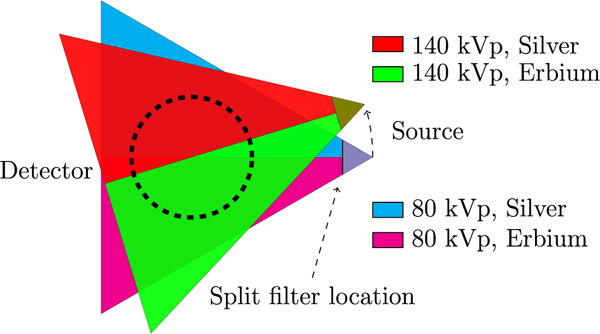
Schematic of the kV-switching/split-filter acquisition protocol. The kVp was switched every projection (i.e. every 1°).
Two filters and two kVp settings were used to produce four spectral channels, from which three basis materials were reconstructed. Data were generated as in the previous study, but used a different, three-material phantom (figure 3) and the additional split filter. The phantom contains ROIs with different concentrations and mixtures of iodine and gadolinium. Half of the beam was filtered with 0.25 mm of erbium, and the other half was filtered with 0.254 mm of silver. The spectra were normalized such that the bare beam intensity after the erbium filter was 5 × 10⁵ photons/pixel (2.5 × 10⁵photons/pixel bare beam before binning). Mass attenuation curves for the different materials and spectral responses for each channel are shown in figure 4.
Figure 3.
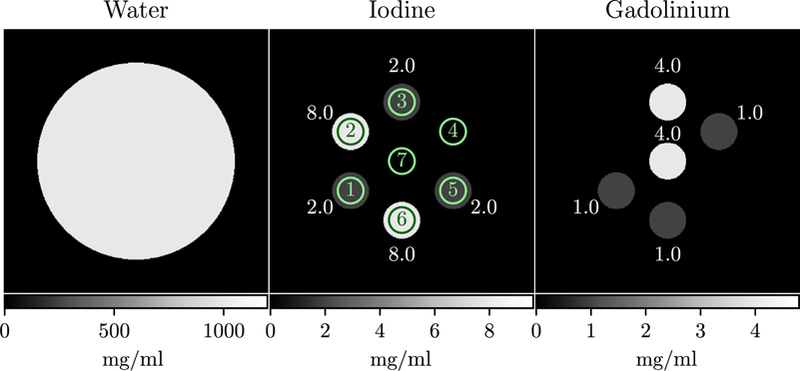
Digital water, iodine, and gadolinium phantom. Inserts are numbered in the iodine image, and corresponding ROIs for metric evaluation are indicated with circles. Iodine and gadolinium concentrations are next to each ROI in mg ml-1.
Figure 4.
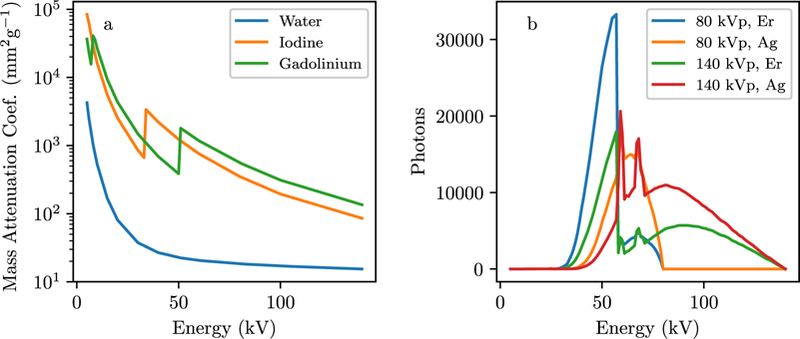
(a) Mass attenuation coefficients, (b) Spectral responses (S) for the kV-switching/split-filter simulation study.
Data were reconstructed using MBMD as in the previous study. However, simplifying assumptions were made to avoid a three-dimensional parameter sweep in penalty strengths. Specifically the ratio of regularization strength for each material image (β(m) in (9)) to the regularization strength for the water image was set to the (approximate) ratio of the density of water to the maximum density of that material: 100 for iodine and 200 for gadolinium. For example, if the regularization strength for water was 103, it was 105 for iodine and 2 × 10⁵ for gadolinium. Therefore, the reconstruction method had only one degree of freedom, which was varied to select a reconstruction with an acceptable level of noise. Reconstructions were initialized as in the previous study.
2.5. Kilovolt-switching with split filtration physical test bench studies
The proposed MBMD algorithm was also evaluated in physical data. Specifically, we conducted spectral CT data acquisitions using a CBCT test bench emulating a setup similar to the kV-switching/split-filter simulation study. The phantom (figure 5) consisted of four vials of different mixtures of iodine (0 mg ml−1−75 mg ml−1) and gadolinium (Omg ml−1−20mg ml−1). Iodine and gadolinium solutions were obtained by diluting Omnipaque (300 mg ml−1 iodine, GE Healthcare, Chicago, IL.) and Magnevist (469.01 mg ml−1 gadopentetate dimeglumine, Bayer, Leverkusen, Germany), respectively. The vials were placed in a 10 cm plastic cylinder. Data were acquired with a Varian (Salt Lake City, UT) PaxScan 4343CB detector (0.278 mm pixel pitch, 0.6 mm Csl scintillator), 120 cm source-to-detector distance, and 72.7 cm source-to-axis distance. The x-ray beam was filtered with 0.25 mm erbium and 0.254 mm silver, at both 80 kVp and 130 kVp. These four data sets were acquired separately, and then combined in post-processing to emulate the kV-switching/split-filter protocol. The data were reconstructed as in the previous study, using a quadratic penalty and the same material penalty strength ratios. The reconstructions were initialized with a segmented FDK reconstruction as in the previous studies. Readout noise was estimated from dark scans for each channel and averaged. Data were reconstructed at multiple penalty strengths, and a reconstruction with an acceptable noise level was chosen for further analysis.
Figure 5.
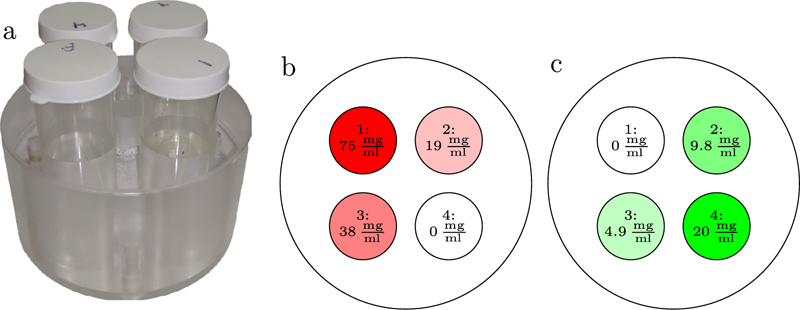
(a) Iodine/gadolinium phantom. Each vial contains different mixtures of iodine- and gadolinium-based contrast agents. In (b) and (c) we show a schematic of the phantom identifying insert/ROI labels. The concentration of iodine in each vial is indicated in (b), and the concentration of gadolinium in each vial is in (c).
We developed a spectral response model of the test bench by fitting to the transmissivity of each vial from the phantom in figure 5. Specifically, we obtained projections of the vials (without the plastic cylinder) arranged such that each ray only passed through one vial. We used spectra from Spektr modified with aluminum, copper, tungsten, and glass filters. CMA-ES (Hansen and Ostermeier 2001) was used to estimate the thicknesses of these filters by matching simulated transmissivities with physical transmissivities through the center of each vial.
3. Results
3.1. Iodine sensitivity simulation study
A two-dimensional penalty-strength sweep was performed for each reconstruction method to find the optimal reconstruction (in terms of RMSE) and examine the relationship between penalty strengths. The RMSEs for each method are shown in figure 6. For IDD, the penalty strengths resulting in the lowest RMSE were 106 for the 80 kVp channel and 106 for the 140 kVp channel (indicated by the star in figure 6(a)). For MBMD, to optimal penalty strengths were 108 for the water image and 1012 for the iodine image.
Figure 6.
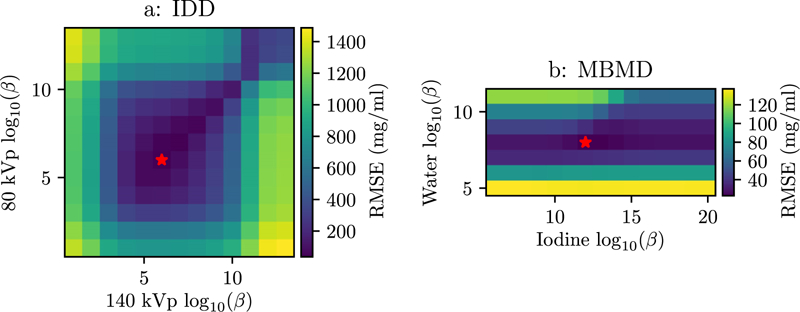
RMSE for each penalty strength combination for the (a) IDD and (b) MBMD methods. The minimum RMSE in each plot is indicated with a star.
Figure 6(a) has a line of low RMSE values along the diagonal, indicating that the two penalty strengths should be equal for IDD in this scenario. In MBMD the optimal iodine image penalty strength is 104 times the water image penalty strength. This is the ratio of the density of water to the density of iodine in the lowest concentration ROI. Because the density of the water image is much greater than the densities in the iodine image, changing the water image penalty strength has a more dramatic effect on RMSE than changing the iodine penalty strength by the same amount.
Figure 7 shows the minimum RMSE reconstructions for each method. The IDD reconstructions contain more noise than the MBMD reconstructions. The noise difference may be explained by the fact that MBMD regularizes the material density images (the values of interest), while IDD regularizes the intermediate individual-channel attenuation images, prior to an unregularized decomposition step which can amplify noise in the density estimates. Low concentration regions are more discernible in the MBMD reconstruction, although concentrations below 0.5 mg ml−1 cannot be visualized with either reconstruction method. Differences between the MBMD and IDD reconstructions also include the presence of a ring in the MBMD iodine image and biases in the MBMD water image at the high iodine concentration ROIs. These differences are likely due to the quadratic penalty smoothing objects in one material image, and the MBMD algorithm compensating by changing the density of the other material at that location. For example, the smoothed edge in the water image results in less overall attenuation due to water, which is compensated for with the ring in the iodine image.
Figure 7.
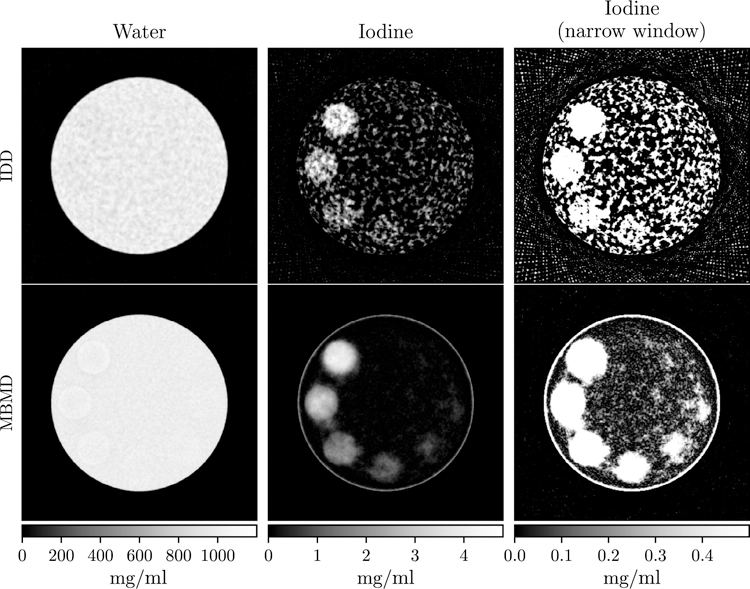
IDD (top) and MBMD (bottom) reconstructions of water (left) and iodine (middle and right) concentrations. The right column is the same as the center but with a tighter window to better visualize the low concentration ROIs.
The CNR values in each ROI are plotted in figure 8. MBMD has higher CNR at all concentrations. If we define a detectable concentration as having a CNR of at least two (indicated by the black line), then MBMD is sensitive to iodine concentrations as low as 0.5 mg ml−1, while IDD is only sensitive to concentrations as low as 3 mg ml-1. This result is specific to comparing the minimum RMSE reconstructions, and choosing the reconstructions from each method using a different metric might improve the relative performance of IDD. For example, noise-matching the reconstructions would likely increase IDD CNR relative to MBMD but reduce resolution. We chose minimum RMSE because it captures both resolution and noise effects and is straightforward to apply to the two-dimensional parameter sweeps.
Figure 8.
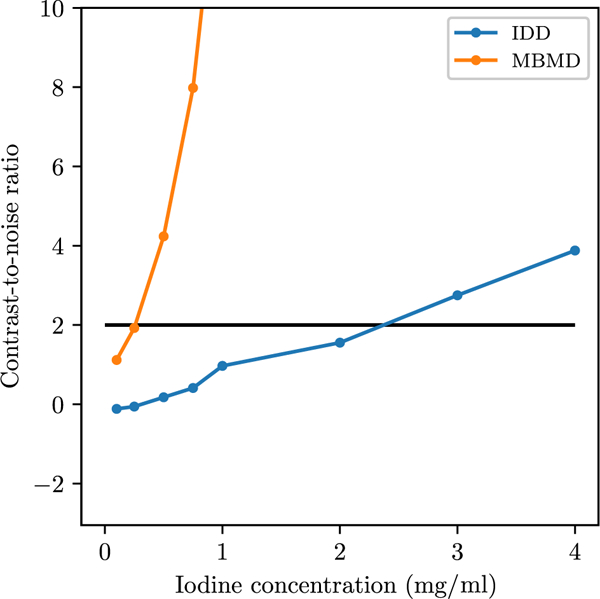
CNR values in each ROI from the optimal reconstruction with each method.
3.2. Kilovolt-switching with split-filtration simulation studies
The reconstruction from the kV-switching/split-filter simulation study is shown in figure 9. The reconstruction appears similar to the true phantom in figure 3, with accurate relative iodine and gadolinium concentration estimates. The gadolinium image contains a ring at the edge of the phantom as in the iodine image in the previous study.
Figure 9.
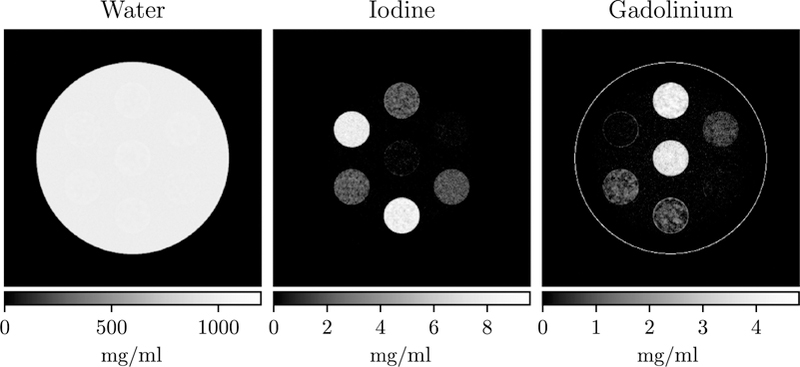
Digital iodine/gadolinium phantom reconstructions. Each column is a different material density image.
Estimated concentration values are presented in figure 10. These estimates are fairly accurate, although gadolinium is slightly underestimated and water is slightly overestimated. RMSE concentration values for each material are 4.86 mg ml−1,0.108 mg ml−1 and 0.170 mg ml−1 for water, iodine and gadolinium, respectively.
Figure 10.
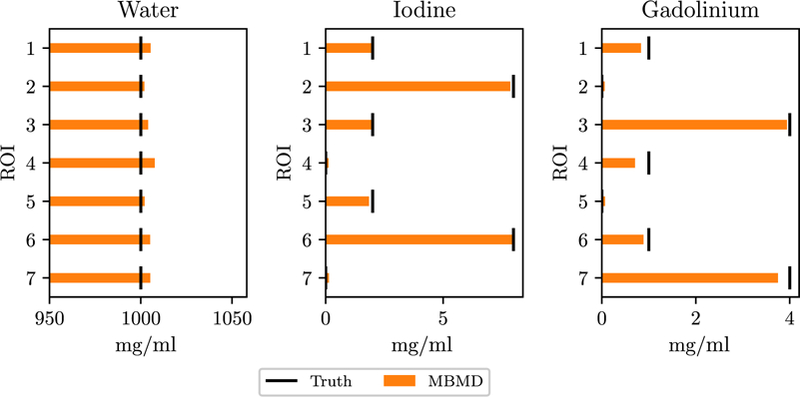
Concentrations of each material (columns) and ROI in the digital iodine/gadolinium phantom. The true concentrations are indicated by vertical lines. ROI numbers correspond to those in figure 3.
3.3. Kilovolt-switching with split filtration physical test bench studies
Figure 11 shows the reconstruction for the physical iodine/gadolinium phantom in figure 5. The results are similar to the simulation study results, although the gadolinium image contains strong ring artifacts around ROIs 1 and 3, and does not contain a ring artifact at the boundary of the phantom.
Figure 11.
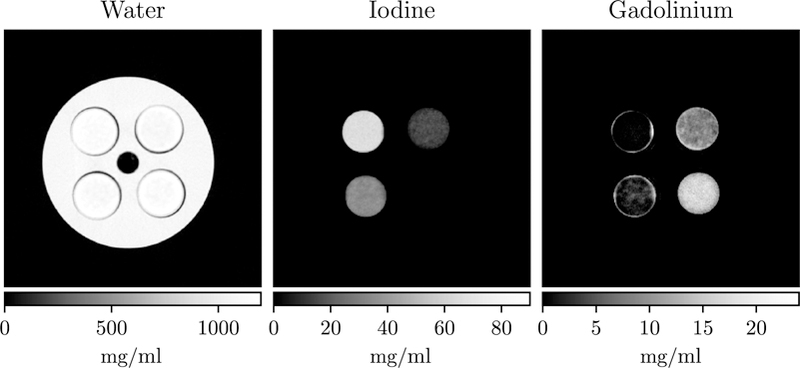
Iodine and gadolinium estimates for the physical test bench experiment.
The concentration values from the physical phantom reconstruction are shown in figure 12. Iodine and gadolinium concentration values are slightly underestimated while water concentration is slightly overestimated, although the relative concentrations among ROIs for each material is preserved. The RMSE for each material is 134 mg ml−1, 5.26 mg ml−1 and 1.85 mg ml−1 for water, iodine and gadolinium, respectively.
Figure 12.
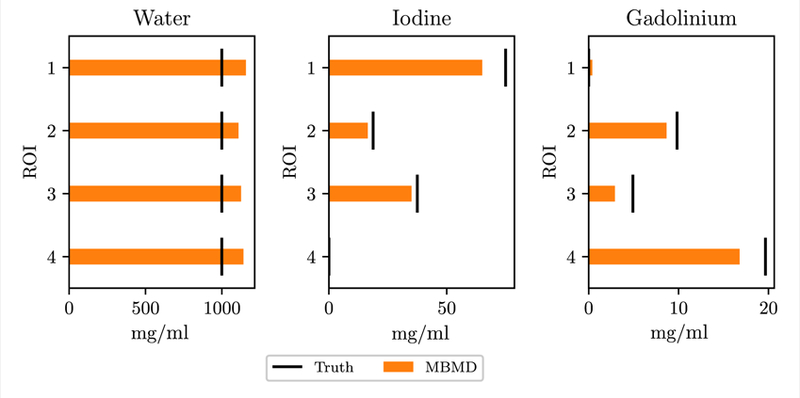
Concentration values for each material and ROI in the physical iodine/gadolinium phantom. Insert/ROI locations are indicated in figure 5.
4. Discussion
With a conventional kV-switching acquisition protocol, MBMD maintained a CNR greater than two down to the relatively low concentration of 0.5 mg ml−1 of iodine. This was more sensitive than a traditional IDD method, indicating that MBMD is a suitable candidate for traditional acquisition schemes. However, we note that IDD may potentially be improved by using different effective attenuation values in (12), a non-negativity constraint, beam hardening pre-correction, and/or a nonlinear decomposition (Coleman and Sinclair 1985, Maaß et al 2009). Common IDD techniques include preprocessing projection data to correct for beam hardening (Maafß et al 2009), and using effective attenuation coefficients obtained with a calibration step, which can also mitigate beam hardening effects (Le and Molloi 2011). In physical systems, both MBMD and IDD may be improved with a more accurate spectral model. In this work we proposed a simple spectral calibration procedure using transmissivity measurements of the base materials to estimate effective filtration of the x-ray system. MBMD achieved satisfactory decomposition accuracy of K-edge contrast materials (iodine and gadolinium) and water with the resulting spectral model. However, errors in the spectral model lead to biases in the material decompositions, with larger biases occurring in harder decomposition problems. Future work will explore more sophisticated modeling and calibration methods to improve decomposition accuracy (Sidky et al 2005).
MBMD produced accurate concentration estimates using a unique acquisition protocol combining kV-switching and split-filtration. This suggests that MBMD may be used with other non-traditional acquisition protocols such as unconventional filtration (Yu et al 2016, Xi et al 2017, Stayman and Tilley 2018), multiple limited angle scans (Chen et al 2017) and systems with multiple axially oriented x-ray sources (Gang et al 2018). Related work has applied the MBMD approach to kV-switching (Tilley et al 2018b) and x-ray beam spectral filtering (Stayman and Tilley 2018) scenarios. These studies further support the robustness of this approach, demonstrating its application in additional acquisition strategies. All of these methods preclude the use of PDD due to unmatched measurement data (although in specific scenarios matched data may be acquired via re-binning). Similarly, IDD may be infeasible for these methods depending on the sampling of each channel. For example, reconstructing multiple limited angle scans separately would result in artifacts if the rotation angle of each scan were less than 180° plus the fan angle. Furthermore, MBMD may enable new acquisition protocols that are impractical with traditional methods. Applying MBMD to more unique acquisition protocols is a focus of future work.
Another future consideration is regularization design and strength. Because the search space is large, we may require better techniques to select regularization strengths, or relative regularization strengths, a priori (similar to the work by Zhang et al (2017) in prior image reconstruction). Regularization type is also likely to be important in future applications. For example, the ring artifacts in the MBMD reconstructions are probably caused by the quadratic penalty, and may be prevented with edge-preserving or low rank penalties (Huber 1981, Sidky and Pan 2008). Future work will also explore regularizers that enforce low rank jointly across material density images, thereby taking advantage of the common structure among these images (Rigie and Rivière 2015).
This work focused on discrimination of K-edge contrast agents. MBMD may also be used to decompose materials without a K-edge (e.g. various soft tissues and bone). Such decomposition can be more challenging due to the similarity of energy-dependent attenuation but may still be accommodated in the MBMD approach with appropriate material basis selection. Previous work by Shen et al (2018a) and (2018b) has shown elemental decomposition can be effective in modeling spectral dependencies and estimating density across many tissue types. That strategy may be extended to MBMD which could offer further improvements. Future work will explore application of the methods discussed in this manuscript to a larger number of materials with more similar attenuation properties (e.g. water and calcium).
Because the MBMD method is derived from a general MBIR forward model, it is straightforward to include models of more physical effects in the reconstruction. For example, a scintillator blur model may improve resolution, and a gantry motion model may enable continuous motion acquisitions without introducing azimuthal blurring. Such changes can be made without altering the underlying reconstruction algorithm. Future work will take advantage of the generality of the presented MBMD algorithm for high-resolution material decomposition.
We have presented a material decomposition algorithm that is capable of modeling a wide variety of systems, including those with unique spectral acquisitions. In addition to improving the sensitivity of material density estimates, this method may enable novel multi-spectral systems and acquisition protocols, ultimately increasing access to material decomposition in pre-clinical and clinical applications.
Acknowledgments
This work was funded in part by NIH grants F31 EB023783, R01 EBO18896, R01 EB025470 and R21 EB026849. The authors would like to thank Yoshi Otake and AH Uneri for GPU software tools used in this work. This research project was conducted using computational resources at the Maryland Advanced Research Computing Center (MARCC).
References
- Alvarez RE and Macovski A 1976. Energy-selective reconstructions in x-ray computerised tomography Phys. Med. Biol 21 733. [DOI] [PubMed] [Google Scholar]
- Barber RF, Sidky EY, Schmidt TG and Pan X 2016. An algorithm for constrained one-step inversion of spectral CT data Phys. Med. Biol 61 3784. [DOI] [PMC free article] [PubMed] [Google Scholar]
- Brooks RA 1977. A quantitative theory of the Hounsfield unit and its application to dual energy scanning J. Comput. Assist. Tomogr 1 487–93 [DOI] [PubMed] [Google Scholar]
- Cann CE 1988. Quantitative CT for determination of bone mineral density: a review Radiology 166 509–22 [DOI] [PubMed] [Google Scholar]
- Chae EJ, Seo JB, Goo HW, Kim N, Song KS, Lee SD, Hong SJ and Krauss B 2008. Xenon ventilation CT with a dual-energy technique of dual-source CT: initial experience Radiology 248 615–24 [DOI] [PubMed] [Google Scholar]
- Chai JW, Choi JA, Choi JY, Kim S, Hong SH and Kang HS 2014. Visualization of joint and bone using dual-energy CT arthrography with contrast subtraction: in vitro feasibility study using porcine joints Skeletal Radiol 43 673–8 [DOI] [PubMed] [Google Scholar]
- Chen B, Zhang Z, Sidky EY, Xia D and Pan X 2017. Image reconstruction and scan configurations enabled by optimization-based algorithms in multispectral CT Phys. Med. Biol 62 8763. [DOI] [PMC free article] [PubMed] [Google Scholar]
- Coleman AJ and Sinclair M 1985. A beam-hardening correction using dual-energy computed tomography Phys. Med. Biol 30 1251. [DOI] [PubMed] [Google Scholar]
- Erdoğan H and Fessler JA 1999. Monotonic algorithms for transmission tomography IEEE Trans. Med. Imaging 18 801–14 [DOI] [PubMed] [Google Scholar]
- Euler A, Parakh A, Falkowski AL, Manneck S, Dashti D, Krauss B, Szucs-Farkas Z and Schindera ST 2016. Initial results of a single-source dual-energy computed tomography technique using a split-filter: assessment of image quality, radiation dose, and accuracy of dual-energy applications in an in vitro and in vivo study Investigative Radiol 51 491–8 [DOI] [PubMed] [Google Scholar]
- Feldkamp LA, Davis LC and Kress JW 1984. Practical cone-beam algorithm J. Opt. Soc.Am. A 1 612–9 [Google Scholar]
- Fung GSK, Stierstorfer K, Fuld M, Kawamoto S, Fishman EK, Tsui BMW and Taguchi K 2016. Spectrum optimization in split-filter dual-energy CT for iodine quantification and virtual-non-contrast imaging Proc. 4th Int. Meeting on Image Formation in X-Ray CT pp 53–6 [Google Scholar]
- Gang GJ, Zbijewski W, Mahesh M, Thawait G, Packard N, Yorkston J, Demehri S and Siewerdsen JH 2018. Image quality and dose for a multisource cone-beam CT extremity scanner Med. Phys 45 144–55 [DOI] [PubMed] [Google Scholar]
- Goodsitt MM, Rosenthal DI, Reinus WR and Coumas J 1987. Two postprocessing CT techniques for determining the composition of trabecular bone Investigative Radiol 22 209–15 [DOI] [PubMed] [Google Scholar]
- Grasruck M, Kappler S, Reinwand M and Stierstorfer K 2009. Dual energy with dual source CT and kVp switching with single source CT: a comparison of dual energy performance Medical Imaging2009: Physics of Medical Imagingvoi 7258 (International Society for Optics and Photonics) [Google Scholar]
- Hansen N and Ostermeier A 2001. Completely derandomized self-adaptation in evolution strategies Evolutionary Comput 9 159–95 [DOI] [PubMed] [Google Scholar]
- Hubbell JH and Seltzer SM 2004. X-Ray Mass Attenuation Coefficients (Gaithersburg, MD: National Institute of Standards and Technology) Huber P J1981 Robust Statistics (New York: Wiley) [Google Scholar]
- Hudson HM and Larkin RS 1994. Accelerated image reconstruction using ordered subsets of projection data IEEE Trans. Med. Imaging MI-13 601–9 [DOI] [PubMed] [Google Scholar]
- Huh W, Fessler JA, Alessio AM and Kinahan PE 2009. Fast kVp-switching dual energy CT for PET attenuation correction IEEE Nuclear Science Symp. Conf. Record pp 2510–5 [Google Scholar]
- Joseph PM and Spital RD 1978. A method for correcting bone induced artifacts in computed tomography scanners J. Comput. Assist. Tomogr 2 100–8 [DOI] [PubMed] [Google Scholar]
- Kim D, Ramani S and Fessler JA 2015. Combining ordered subsets and momentum for accelerated x-ray CT image reconstruction IEEE Trans. Med. Imaging 34 167–78 [DOI] [PMC free article] [PubMed] [Google Scholar]
- Le HQ and Molloi S 2011. Segmentation and quantification of materials with energy discriminating computed tomography: a phantom study Med. Phys 38 228–37 [DOI] [PMC free article] [PubMed] [Google Scholar]
- Long Y and Fessler JA 2014. Multi-material decomposition using statistical image reconstruction for spectral CT IEEE Trans. Med. Imaging 33 1614–26 [DOI] [PMC free article] [PubMed] [Google Scholar]
- Long Y, Fessler J and Balter J 2011. WE-C-110–06: two-material decomposition from a single CT scan using statistical image reconstruction Med. Phys 38 3810 [Google Scholar]
- Maaß C, Baer M and Kachelriefi M 2009. Image-based dual energy CT using optimized precorrection functions: a practical new approach of material decomposition in image domain Med. Phys 36 3818–29 [DOI] [PubMed] [Google Scholar]
- Mechlem K, Ehn S, Sellerer T, Braig E, Munzel D, Pfeiffer F and Noel PB 2017. Joint statistical iterative material image reconstruction for spectral computed tomography using a semi-empirical forward model IEEE Trans. Med. Imaging 37 68–80 [DOI] [PubMed] [Google Scholar]
- Nesterov Y 2005. Smooth minimization of non-smooth functions Math. Program. J. A 103 127–52 [Google Scholar]
- Pache G et al. 2010. Dual-energy CT virtual noncalcium technique: detecting posttraumatic bone marrow lesions—feasibility study Radiology 256 617–24 [DOI] [PubMed] [Google Scholar]
- Punnoose J, Xu J, Sisniega A, Zbijewski W and Siewerdsen JH 2016. Technical note: spektr 3.0—a computational tool for x-ray spectrum modeling and analysis Med. Phys 43 4711–7 [DOI] [PMC free article] [PubMed] [Google Scholar]
- Rigie DS and Rivi&re PJL 2015. Joint reconstruction of multi-channel, spectral CT data via constrained total nuclear variation minimization Phys. Med. Biol 60 1741. [DOI] [PMC free article] [PubMed] [Google Scholar]
- Ritchings RT and Pullan BR 1979. A technique for simultaneous dual energy S J. Comput. Assist. Tomogr 3 842–6 [PubMed] [Google Scholar]
- Rutt B and Fenster A 1980. Split-filter computed tomography: a simple technique for dual energy scanning J. Comput. Assist. Tomogr 4 501–9 [DOI] [PubMed] [Google Scholar]
- Shen C, Li B, Chen L, Yang M, Lou Y and Jia X 2018a. Material elemental decomposition in dual and multi-energy CT via a sparsity dictionary approach for proton stopping power ratio calculation Med. Phys 45 1491–503 [DOI] [PMC free article] [PubMed] [Google Scholar]
- Shen C, Li B, Lou Y, Yang M, Zhou L and Jia X 2018b. Multienergy element-resolved cone beam CT (MEER-CBCT) realized on a conventional CBCT platform Med. Phys 45 4461–70 [DOI] [PMC free article] [PubMed] [Google Scholar]
- Sidky EY and Pan X 2008. Image reconstruction in circular cone-beam computed tomography by constrained, total-variation minimization Phys. Med. Biol 53 4777–807 [DOI] [PMC free article] [PubMed] [Google Scholar]
- Sidky EY, Yu L, Pan X, Zou Y and Vannier M 2005. A robust method of x-ray source spectrum estimation from transmission measurements: demonstrated on computer simulated, scatter-free transmission data J. Appl. Phys 97 124701 [Google Scholar]
- Stayman JW and Tilley SII 2018. Model-based multi-material decomposition using spatial-spectral filters Proc. 5th Int. Meeting on Image Formation in X-Ray CT (SaltLake City, Utah, US) pp 102–105 [PMC free article] [PubMed] [Google Scholar]
- Stolzmann P, Kozomara M, Chuck N, Müntener M, Leschka S, Scheffel H and Alkadhi H 2010. In vivo identification of uric acid stones with dual-energy CT: diagnostic performance evaluation in patients Abdominal Imaging 35 629–35 [DOI] [PubMed] [Google Scholar]
- Taschereau R, Silverman RW and Chatziioannou AF 2009. Dual-energy attenuation coefficient decomposition with differential filtration and application to a microCT scanner Phys. Med. Biol 55 1141. [DOI] [PMC free article] [PubMed] [Google Scholar]
- Tilley SII, Jacobson M, Cao Q, Brehler M, Sisniega A, Zbijewski W and Stayman JW 2017a. Penalized-likelihood reconstruction with high- fidelity measurement models for high-resolution cone-beam imaging IEEE Trans. Med. Imaging 37 988–99 [DOI] [PMC free article] [PubMed] [Google Scholar]
- Tilley SII, Sisniega A, Siewerdsen JH and Stayman JW 2018a. High-fidelity modeling of detector lag and gantry motion in CT reconstruction Proc. of 5th Int. Meeting on Image Formation in X-Ray CT (SaltLake City, Utah, US) pp 318–22 [PMC free article] [PubMed] [Google Scholar]
- Tilley SII, Zbijewski W and Stayman JW 2017b. High-fidelity modeling of shift-variant focal-spot blur for high-resolution CT Int. Meeting Fully 3D Image Reconstruction in Radiology and Nuclear Medicine (Xi’an, China) pp 752–9 [Google Scholar]
- Tilley S, Zbijewski W, Siewerdsen JH and Stayman JW 2018b. A general CT reconstruction algorithm for model-based material decomposition Proc. SPIE 10573 10573–7 [DOI] [PMC free article] [PubMed] [Google Scholar]
- Tran DN, Straka M, Roos JE, Napel S and Fleischmann D 2009. Dual-energy CT discrimination of iodine and calcium: experimental results and implications for lower extremity CT angiography Acad. Radiol 16 160–71 [DOI] [PubMed] [Google Scholar]
- Wang X, Meier D, Mikkelsen S, Maehlum GE, Wagenaar DJ, Tsui BMW, Patt BE and Frey EC 2011. MicroCT with energy-resolved photoncounting detectors Phys. Med. Biol 56 2791. [DOI] [PMC free article] [PubMed] [Google Scholar]
- Weidinger T, Buzug TM, Flohr T, Kappler S and Stierstorfer K 2016. Polychromatic iterative statistical material image reconstruction for photon-counting computed tomography 2016 5871604. [DOI] [PMC free article] [PubMed] [Google Scholar]
- Xi Y, Cong W, Harrison D and Wang G 2017. Grating oriented line-wise filtration (GOLF) for dual-energy x-ray CT Sens. Imaging 18 27. [DOI] [PMC free article] [PubMed] [Google Scholar]
- Xu D, Langan DA, Wu X, Pack JD, Benson TM, Tkaczky JE and Schmitz AM 2009. Dual energy CT via fast kVp switching spectrum estimation Medical Imaging 2009: Physics of Medical Imaging vol 7258 (International Society for Optics and Photonics) p 72583T [Google Scholar]
- Yu L, Leng S and McCollough CH 2016. Dual-source multi-energy CT with triple or quadruple x-ray beams Proc. SPIE 9783 (International Society for Optical Engineering) pp 9783–6 [DOI] [PMC free article] [PubMed] [Google Scholar]
- Zbijewski W, Gang GJ, Xu J, Wang AS, Stayman JW, Taguchi K, Carrino JA and Siewerdsen JH 2014. Dual-energy cone-beam CT with a flat- panel detector: effect of reconstruction algorithm on material classification Med. Phys 41 021908. [DOI] [PMC free article] [PubMed] [Google Scholar]
- Zhang H, Dang H, Gang GJ and Stayman JW 2017. Prospective regularization analysis and design for prior-image-based reconstruction of x-ray CT Proc. the 14th Fully Three-Dimensional Image Reconstruction in Radiology and Nuclear Medicine vol 14 pp 417–23 [Google Scholar]
- Zhang R, Thibault JB, Bouman CA, Sauer KD and Hsieh J 2014. Model-based iterative reconstruction for dual-energy x-ray CT using a joint quadratic likelihood model IEEE Trans. Med. Imaging 33 117–34 [DOI] [PubMed] [Google Scholar]
- Zou Y and Silver MD 2008. Analysis of fast kV-switching in dual energy CT using a pre-reconstruction decomposition technique Medical Imaging2008: Physics of Medical Imaging vol 6913 (International Society for Optics and Photonics) p 691313 [Google Scholar]


