Abstract
Purpose
The purpose of this study was to investigate calibrations for improved estimates of skin dose and to develop software for computing absorbed organ doses for fluoroscopically guided interventions (FGIs) with the use of radiation dose structured reports (RDSR) and the UF/NCI family of hybrid computational phantoms.
Methods and materials
Institutional review board approval was obtained for this retrospective study in which ten RDSRs were selected for their high cumulative reference air kerma values. Skin doses were computed using the University of Florida's rapid in‐clinic peak skin dose algorithm (or UF‐RIPSA). Kerma‐area product (KAP) meter calibrations and attenuation of the tabletop with pad were incorporated into the UF‐RIPSA. To compute absorbed organ doses the RDSRs were coupled with software to develop Monte Carlo input decks for each irradiation event. The effects of spectrum matching were explored by modeling (a) a polychromatic x‐ray energy beam made to match measured first half‐value layers of aluminum, (b) an unmatched spectrum, (c) and a mono‐energetic beam equivalent to the effective x‐ray energy. The authors also considered the practicality of computing organ doses for each irradiation event within a RDSR.
Results
The KAP meter is highly dependent on the quality of the x‐ray spectra. Monte Carlo based attenuation coefficients for configurations in which the beam is transmitted through the tabletop with pad reduced the amount by which the software overestimated skin doses. For absorbed organ dose computations, the average ratios of computed organ doses for a non‐fitted to fitted spectrum and effective energy to fitted spectrum were 0.45 and 0.03, respectively. Monte Carlo simulations on average took 38 min per patient. All in‐field organ tallies converged with a relative error of less than 1% and out‐of‐field organs tallies within 10% relative error.
Conclusions
This work details changes to the UF‐RIPSA software that include an expanded library of computational phantoms, attenuation coefficients for tabletop with pad, and calibration curves for the KAP meter. For the computation of absorbed organ dose, it is possible to model each irradiation event separately on a patient‐dependent model that best morphometrically matches the patient, thus providing a full report of internal organ doses for FGI patients.
Keywords: fluoroscopically guided interventions, organ absorbed dose, peak skin dose
1. Introduction
Fluoroscopically guided interventions (FGIs) are attributed with favorable success rates and improved patient outcomes over conventional surgery.1 Compared to its early inception as an outgrowth of diagnostic radiology, the use of FGIs has grown dramatically over the past decades and is now being performed in large numbers worldwide.2, 3 The range of diseases and organs amenable to FGIs are extensive and constantly expanding.4 Accompanying this growth of FGIs has been an increase in their complexity that can lead to increased radiation exposures of the patient's skin and internal organs. These trends have sparked public health concerns regarding risks of skin damage to older patients and stochastic cancer risks for younger patients.
Published reports have provided methods for assessing skin dose in real‐time,5, 6 skin dose post‐procedure,7, 8 and absorbed organ doses with the use of dose coefficients (DCs) from FGIs.9, 10, 11 Organ dose coefficients are typically normalized to kerma‐area product (KAP) such that the product of the measured KAP and the appropriate DC is a measure of either effective dose or individual organ dose for a fixed x‐ray projection. Previously, DCs were the only practicable tool for clinical use because of the heavy computational burden of computing organ doses through explicit simulation of the procedure by Monte Carlo radiation transport. However, the use of DCs fails to account for the dynamic nature of FGIs and the inherent variability in patient morphometry. At present, DCs are only available for a few representative procedures and are developed typically using computational phantoms at 50th percentile heights and weights (i.e., reference phantoms). DC tables can now be replaced with improved patient dosimetry methods and more realistic anatomical phantoms. High performance computing centers and the ability to parallelize organ dose computations have demonstrated that it is indeed possible to compute normalized organ doses on a per procedure basis eliminating the need for DCs.12
The purpose of this study is twofold: (a) to give an update to the University of Florida rapid in‐clinic peak skin dose‐mapping algorithm (or UF‐RIPSA), and (b) to present a method by which one can quantitate patient internal organ dose via the University of Florida Monte Carlo based organ dose system (or UF‐MODS). Both UF‐RIPSA and UF‐MODS compute absorbed organ doses with the use of the radiation dose structured report (RDSR) created at the end of each FGI.13 The system is able to parse the RDSR for information relating to the geometry along with exposure conditions to virtually reconstruct each irradiation event. In order to account for patient anthropometric variations, the software makes use of the UF/NCI family of hybrid computational phantoms – a phantom library consisting of 351 members that represent the range of body morphometry seen in the current US adult and pediatric populations.14 This is an expanded phantom library that builds upon the original 50 member adult library and adds pediatric models.7 These models allow anthropometric matching of individual patients, thus avoiding the use of either single 50th percentile reference or stylized phantoms.14 The system for patient dosimetry is written in PYTHON, an open source scientific programming language that allows for a robust graphical user interface and 3D visualization techniques. The software requires a one‐time entry of geometry models, measured half‐value layers (HVLs), and KAP calibration curves. From a clinician standpoint and by design, only five parameters are needed for its operation: patient sex, age, height, weight, and position on the examination table.
2. Methods and materials
2.A. RIPSA skin dose algorithm
Skin doses are reported by UF‐RIPSA based upon the following expression:
| (1) |
is the radiation absorbed dose to a given location on the patient's irradiated skin surface, is the reference air kerma reported by the RDSR for that irradiation event, is a calibration factor for the KAP meter, is the distance to the reference point from the source location, and is the distance to the skin location from the source location. Other terms include , which is a correction of backscattered x‐rays and secondary electrons at the skin dose point (taken from ICRU Report 74),15 is the mass energy‐absorption coefficient for the relevant x‐ray energies considered in the dose assessment (where the term in the equation above represents its ratio in skin to that in air), and represents the attenuation in energy deposition of the x‐ray spectrum due to the tabletop and pad upon which the patient lies (provided the beam intercepts these structures). It must be emphasized that many of the terms above are energy and field‐size dependent, and thus should be evaluated individually for each irradiation event in the RDSR.
The algorithm as originally presented by Johnson et al.7 relied on the vendor reported KAP and Ka,r. Both the KAP and Ka,r are reported with either the use of a plane‐parallel transmission ionization chamber or lookup tables with a tolerance of ±35% per FDA regulation 21 CFR 1020.32.16 To address the inherent uncertainty introduced into the skin dose algorithm from the Ka,r, Johnson et al. introduced beam‐quality dependent calibration coefficients. Previous iterations of the skin dose‐mapping algorithm relied on table attenuation factors calculated from first‐order estimates of the mean x‐ray energy.
2.B. Patient population
Institutional review board approval was obtained for this retrospective study, and the need to obtain informed consent was waived. The RDSR files were obtained from 800 FGI procedures performed on a Siemens Medical Solutions Artis zee bi‐plane angiography system at UF Health Jacksonville Hospital in its Division of Vascular and Interventional Radiology. The RDSR were parsed to study frequency and trends for common angulations, tube voltage, tube current, and filtration. The ten highest cumulative reference air kerma cases in this RDSR library with their corresponding procedure description, patient sex, height, and weight were selected for further analysis. Table 1 provides an anthropometric summary of 10 selected RDSRs.
Table 1.
Anthropometric data of the ten selected high‐dose cases from UF Health Jacksonville Medical Center
| RDSR | Age | Sex | Height (cm) | Weight (kg) | BMI (kg m2) |
|---|---|---|---|---|---|
| 1106 | 72 | M | 177.8 | 117.9 | 37.29 |
| 1193 | 62 | M | 170.2 | 72.6 | 25.06 |
| 1124 | 35 | F | 157.5 | 70.8 | 28.54 |
| 1025 | 76 | M | 175.3 | 113.4 | 36.90 |
| 1141 | 24 | M | 134.6 | 59.0 | 32.57 |
| 1325 | 63 | M | 175.3 | 73.5 | 23.92 |
| 1166 | 81 | M | 175.3 | 89.8 | 29.22 |
| 1150 | 79 | M | 182.9 | 72.6 | 21.70 |
| 1313 | 50 | F | 165.1 | 72.6 | 26.63 |
| 1322 | 19 | M | 177.8 | 71.2 | 22.52 |
2.C. UF/NCI library of hybrid computational phantoms
This study uses the updated UF/NCI family of hybrid computational phantoms as described in Geyer et al.14 The library consists of 351 unique computational phantoms that are binned by height/weight to represent the US adult and pediatric populations. The patient's height, weight, and sex are used to select a computational phantom from the library that best represents that particular patient. The morphometric category of the selected phantom is then said to be a patient‐dependent hybrid phantom. The UF/NCI phantoms trace their origin to the hybrid versions of the UF/NCI reference phantoms, which incorporate age‐ and/or gender‐dependent reference organ masses, matched to within 1% of ICRP Publication 89 values.14, 17, 18 The phantoms are voxelized at a resolution of 2 × 2 × 2 mm3 to yield a format amenable to Monte Carlo N‐Particle eXtended (MCNPX) radiation transport and skin dose mapping. For modeling purposes, the patient‐dependent phantoms are centered on the table lying supine with the head positioned 5 cm from the edge of the table. As this was a retrospective study, no information was available with regard to patient positioning on the table. If this information is known, phantom spatial alignment with the RDSR coordinates can be readily accommodated within UF‐RIPSA.
2.D. Radiation transport simulations
The radiation transport code MCNPX v.2.7 was used in this study.19 MCNP is a well‐established radiation transport tool for both medical and occupational radiation dosimetry applications, and is supported by the Los Alamos National Laboratory (https://mcnp.lanl.gov/). Details of its application in this study are given in Table 2.
Table 2.
Details of the radiation transport computations and data post‐processing.19
| Item | Description |
|---|---|
| Code and version | MCNPX v2.7.1 |
| Source description | The source is defined with the SDEF card as an anisotropic point source. The x‐ray beam is further collimated to produce a diverging rectangular field with the use of zero importance surfaces, i.e., surfaces that stop transporting all incident particles. The spectra is defined at 1 keV bins up until the maximum peak tube potential. The relative intensity at each energy bin is defined with the use of the RDSR entry of peak tube potential and added filtration to generate an equivalent spectrum for each irradiation event. |
| Cross‐sections | ENDF/B‐VII |
| Transport parameters | Both photons and electrons were transported. The photon physics allowed for the generation of electrons and coherent scattering. The transport cut‐off energy for electrons is set at 1 keV, after which their energy is locally deposited. |
| Variance reduction | No variance reduction was applied in this study |
| Scored quantities | The F6 tally of energy deposition averaged over the cell of interest in units of MeV/g. This F6 tally was specified for all organs of interest and for a volume of air that represents the kerma‐area product meter. |
| Number of histories and statistical uncertainties |
Organ doses The radiation transport was carried out until 7:50e7 particle histories were performed or until the computer time exceeded 48 h. The relative errors in the energy deposition tally were less than 1% for all organs in the x‐ray field and within 10% for out‐of‐field organs. |
|
Attenuation factor The radiation transport was carried out until 5:0e8 particle histories were performed or until the computer time exceeded 72 h. The relative errors in the energy deposition tally was less than 0.1% | |
| Data post‐processing |
Organ doses The energy deposition in the organs of interest was normalized to the F6 tally in the volume of air that represents a kerma‐area product meter and then multiplied by the corrected kerma‐area product meter reading of that irradiation event as reported in the RDSR |
|
Attenuation factor The ratio of the energy deposition tallies for the exit to entrance side of the table was calculated according to Eq. (3) |
2.E. KAP calibration
As shown in Table 3, the Siemens Artis zee is equipped with the DIAMENTOR M4‐KDK KAP/Dose Meter featuring a transmission ion chamber that can measure air kerma, air kerma rate, and air kerma‐area product simultaneously during radiographic and fluoroscopic procedures. Calibration of the KAP meter in the Siemens Artis zee was performed with a Radcal 10 × 6‐6 ion chamber, ion chamber converter 9660A, and Accu‐Dose 2186 dosimeter system as described in Table 4. The ionization chamber was selected for its relatively flat energy response over the beam‐quality range of interest and ability to perform at high‐dose rates.
Table 3.
Properties of the KAP meter installed in the Siemens Artis zee fluoroscopic unit
| DIAMENTOR M4‐KDK | ||
|---|---|---|
| Measuring range | DAP [μGym2] | 0.1–999,999 |
| DAP rate [μGym2/s] | 0.1–30,000 | |
| Dose [mGy] | 0.01–10000 | |
| Dose rate [mGy/s] | 0.01–999,999 | |
| Irradiation time [s] | 1 s–999 min | |
| Digital resolution | DAP [μGym2] | 0.01 |
| DAP rate [μGym2/s] | 0.01 | |
| Dose [mGy] | 0.001 | |
| Dose rate [mGy/s] | 0.001 | |
| Irradiation time | 600 ms (Dose rate > 2.4 μGy/s) 60 ms (Dose rate > 12 μGy/s) | |
| Ranges of Use | DAP rate | 0.005–30,000 μGy m2/s |
| Tube voltage | 50–100 kVp | |
| Temperature | 10–40°C | |
Table 4.
Radcal chamber 10 × 6‐6 used for the DIAMENTOR meter calibration in the Siemens Artis zee fluoroscopic unit
| Chamber 10 × 6‐6 | ||
|---|---|---|
| Min rate | 2 μR/s | 20 nGy/s |
| Max rate | 17 R/s | 149 mGy/s |
| Min dose | 10 μR | 100 nGy |
| Max dose | 59 kR | 516 Gy |
| Calibration accuracy | ± 4% at 60 kVp and HVL of 2.8 mm of Al | |
| Exposure rate dependence | ± 5%, 0.4 mR/s to 80 R/s, up to 500 R/s for 50 μs pulses | |
| Energy dependence | ± 5%, 30 keV to 1.33 MeV | |
| Construction | Polycarbonate walls and electrode conductive graphite interior coating; 6.0 cm3 active volume | |
Calibration coefficients of the KAP meter were measured with the use of the RADCAL ionization chamber placed at isocenter with the axis of the cylindrical chamber parallel to the axis of rotation for the C‐arm fluoroscope.15, 20, 21 The chamber was held free‐in‐air with the use of a stand and a minimum clearance of 10 cm was provided between the chamber and tabletop. The position of the chamber was verified by rotating the C‐arm fluoroscope about the axis of rotation while acquiring images. In so doing, the cylindrical chamber appeared to rotate about its central axis when rotating the C‐arm fluoroscope. No translation was apparent verifying proper placement at isocenter. The system was then set at a maximum SID with the radiation field collimated to encompass the sensitive volume of the ionization chamber. With no wedges in place, an image of the ionization chamber was acquired under set up conditions to determine the radiation field size.20 Before performing the remaining measurements, the detector array was removed and replaced with a lead insert to protect the integrity of the system from excess radiation. The Siemens Artis zee system was then set in service mode and the chamber irradiated under the desired irradiation qualities. In cases where service mode is unavailable, loading phantoms can be used to achieve the desired radiation qualities. The reference value for the kerma‐area product (KAP ref ) is defined as the product of the measured air kerma, K a,m, at isocenter of the x‐ray beam and the field area A at isocenter:
| (2) |
The calibration coefficient, β, is then defined as the quotient of the reference kerma‐area product and the installed KAP meter reading.
The KAP meter for the Siemens Artis zee machine was calibrated for radiation incident on the chamber using x‐ray tube voltages ranging from 40 to 120 kVp at every 10 kVp increment and at five different tube filtrations: 0.1, 0.2, 0.3, 0.6, and 0.9 mm of Cu and then with no added filtration. The effects of tube current and pulse width were observed at high mAs combinations to ensure that the KAP meter was not saturated. These measurements were repeated at 1‐month intervals for 3 months to verify the reproducibility of the Siemens Artis zee system.
2.F. One‐time entry parameters
Source spectra models are possible for each filtration available on the Siemens Artis zee machine for x‐ray tube voltages ranging from 40–120 kVp. To accomplish this, aluminum first half‐value layer (HVL1) measurements were made at various filter and tube voltage combinations. The measurements were then fit with linear regression curves for each filter and tube voltage combination. From these curves, a measurement‐based virtual source was computed by first selecting the desired filter and tube voltage combination to acquire a representative Al equivalent HVL. The resulting HVL is then used in conjunction with a tungsten anode spectral model using interpolating polynomials (TASMIP) developed by Boone and Seibert to create the virtual x‐ray source.22 Using the libraries from the TASMIP model in conjunction with Spektr™, a computational tool for x‐ray spectral analysis, an initial estimate of a tungsten anode spectrum for the given energy and filter combination was made.23 The initial spectrum was then iteratively hardened or softened computationally until its Al HVL matched that of the measured data from the Siemens Artis zee at each tube voltage and filtration combination. In this manner, a library of spectral data was populated for various x‐ray qualities. Generating source model spectra from both first and second HVL measurements have shown no statistical difference in dosimetry between models that use only the first HVL.24
2.G. Monte Carlo based attenuation coefficients
For post‐procedure absorbed organ dose computations, the effects of attenuation on the radiation beam are accounted for by modeling both the tabletop and pad used during the FGI in the MCNPX simulation. For computing skin doses, a library of attenuation coefficients was generated. Tabletop and pad were modeled in Rhinoceros™ v5 and aided with the use of computed tomography images. The tabletop material was modeled as carbon fiber with a nominal density of 1.8 g cm−3 while the table pad from TEMPUR‐MED was modeled as polyurethane with a density of 0.0975 g cm−3.25, 1, 2 A photon point source was positioned at a source‐to‐isocenter (or SAD) distance of 40 cm. The isocenter coincides with the top of the tabletop. The source is sampled to preferentially bias the emission of particles in a cone directed toward the isocenter. The cone of photon quanta is further collimated to produce a square diverging beam. The simulations tallied energy deposition in volumes of air at both the entrance and exit side of the table and pad combination. The entrance side tally was located 20 cm away from the source, while the exit side tally was 80 cm from the source. These distances where chosen to avoid geometry errors when the source is at large oblique angles relative to the tabletop normal direction. The energy deposition was tallied across the area exposed to the primary photon beam over a depth of 1 cm. At the exit side tally, the cross‐sectional area of the primary beam was 11.5 cm × 11.5 cm. The energy deposition tallies are then multiplied by their cross‐sectional area exposed to the primary beam. Equation (3) defines the attenuation factor AF in terms of the F6 energy deposition tally in MCNPX. The Monte Carlos simulations tracked secondary particles including electrons. Default physics cards were employed for both photons and electrons. For each MCNPX input, 500 million particles were transported. The tallies converged with relative errors less than 0.1%.
| (3) |
The library of attenuation coefficients was compiled for a set incident angles that position the source under the tabletop for each filtration configuration at the following tube voltages: 60, 70, 80, 90, 100, 110, and 120 kVp. The angle of incidence is defined as the angle between the intersection of the direction of particle emission and the normal vector to the bottom of the tabletop. The location of the source and the direction of particle emission are defined by the positioner primary angle (PPA), positioner secondary angle (PSA), and location of isocenter. The positioner angles are defined such that zero degree is referenced to the origin perpendicular to the patient's chest. At zero degrees for both positioner primary and secondary angles, the patient faces the image detector. The positioner primary angle is analogous to longitude while the secondary angle is analogous to latitude, as shown in Fig. 1.13 A total 9,450 MCNPX simulations were thus run to establish a library of attenuation factors that were later incorporated within the UF‐RIPSA skin dose‐mapping software. The UF‐RIPSA selects the appropriate coefficient based on PPA, PSA, tube voltage, filtration, location of isocenter, and table location on a per irradiation event basis.
Figure 1.
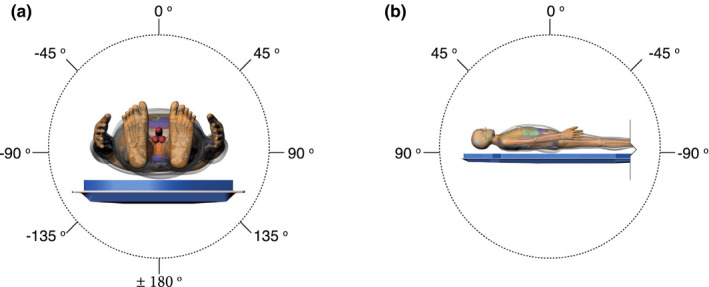
Series depicting angular definitions for C‐arm positions of fluoroscope image receptor. (a) Positioner primary angle and (b) positioner secondary angle for a patient position of recumbent, head‐first, and supine as defined by the RDSR. [Color figure can be viewed at wileyonlinelibrary.com]
2.H. Skin dose mapping and organ dose software on ten select cases
The UF‐RIPSA and UF‐MODS software requires user input to specify the RDSR along with patient sex, height, weight, age, and location/orientation on table. The code collects tube voltage, filtration, table position, positioner primary angle, positioner secondary angle, KAP, Ka,r, source‐to‐isocenter distance, and source‐to‐detector distance for each irradiation event from the RDSR. The information gathered is used to generate an input deck for a MCNPX.19 Based on the patient sex, height, and weight, the software selects a geometry file of a patient‐dependent phantom from the UF/NCI family of hybrid computational phantoms that represents a best match to the individual patient.14 Tube voltage and filtration are used to both compute a candidate spectrum in 1 keV energy bins that match HVL1 measurements and the KAP calibration factor. The same geometry file is used to compute skin doses with the KAP calibration factor and attenuation library for the tabletop with pad. A flowchart of the entire process is shown in Fig. 2.
Figure 2.
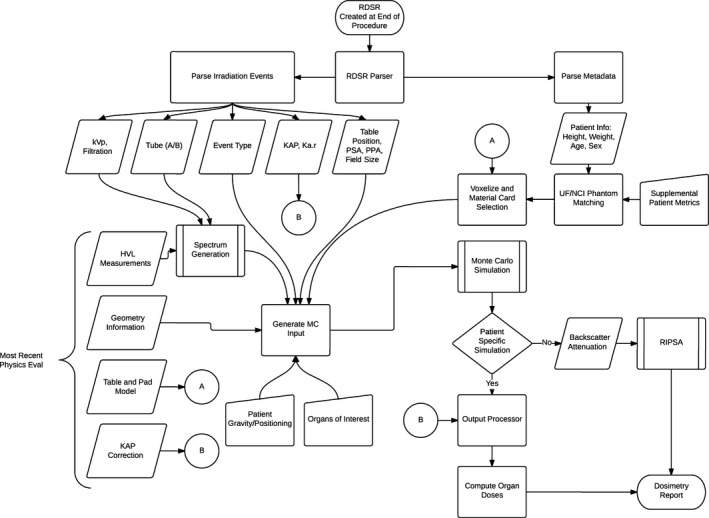
Flowchart of the process to compute organ doses from the UF‐MODS software. In the absence of patient specific information, the process is used to generate backscatter and attenuation coefficients to be used in UF‐RIPSA.7
The modeled geometry within MCNPX includes the patient‐dependent phantom, tabletop, pad, and KAP meter. The KAP meter is modeled to obtain a normalization factor needed to convert dose per source particle to absolute values of organ dose per procedure. The modeled x‐ray beam is collimated to yield an equivalent square field size to the area calculated from the KAP and Ka,r. The absorbed dose to organs is determined using the energy deposition tally of MCNPX (F6), which records the energy deposited in the region of interest by both primary and secondary particles (MeV g−1 particle−1). Each simulation run consists of 75 million particles performed in parallel over 12 central processing units on the University of Florida HiPerGator computer cluster while allotting 3500 MB of RAM per run.
2.I. Sensitivity studies
Performing HVL1 measurements can prove to be both time consuming and cumbersome for many clinical centers; therefore, the effects of this desired level of accuracy were further investigated. First, we explored two simplifications of the x‐ray energies used for the MCNPX simulations. Here, we re‐computed organ doses using: (a) the full x‐ray energy spectrum given the tube characteristics, but not adjusted (e.g., hardened) to match measured HVL1, and (b) mono‐energetic photons of a fixed equivalent energy that matched the measured HVL1. Second, we explored organ dose accuracy in which only the higher contributing irradiation events were simulated in our estimates of cumulative patient organ dose. This study looked at the impact of computing organ doses when modeling irradiation events in the top 90th, 85th, 75th, 50th, 45th, and 25th percentiles for dose at the reference point.
3. Results
Figure 3 displays histograms of tube voltage, tube current, focal spot size, and copper filtration thicknesses that are representative of over 23,763 irradiation events as acquired from the Siemens Artis zee system at UF Health Jacksonville Division of Interventional Radiology. The mean tube voltage was 72.6 kVp with a standard deviation of 10.9 kVp. In contrast, the tube current (197.63 ± 158.40 mA) is skewed right with tail extremes and a Fisher‐Pearson standardized moment coefficient of 1.93. It should be noted that only focal spot sizes of 0.2, 0.6 and 1 mm are available; likewise Cu filtration may only be selected for 0, 0.1, 0.2, 0.3, 0.6, and 0.9 mm thicknesses.
Figure 3.
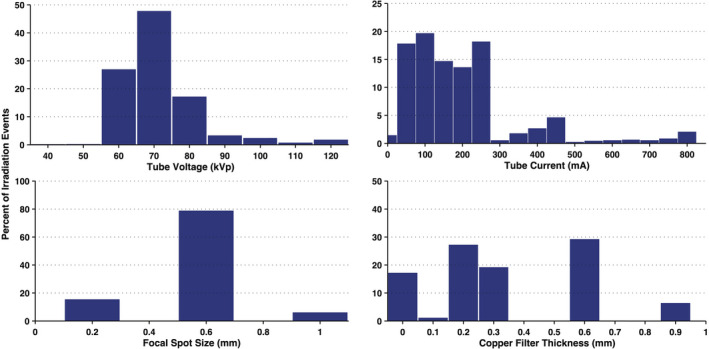
Frequency distributions of irradiation parameters for interventional fluoroscopic procedures in the Department of Radiology at UF Health Jacksonville using the Siemens Artis zee fluoroscopic unit. N = 23,763 irradiation events. [Color figure can be viewed at wileyonlinelibrary.com]
Figure 4 shows the reproducibility of measurements taken by the reference chamber and KAP meter. Both ionization chambers were exposed to 200 mA for 300 ms pulses with 0.1 mm of Cu filtration. These measurements were taken over a period of 3 months. During this 3‐month period, the KAP meter varied by no more than 3% while the Radcal chamber measurements were within 2%. The only statistically significant factors affecting the KAP calibration coefficient are tube voltage within each beam filtration as determined by a one‐way ANOVA [F(10,97) = 3.18, P = 0.001, α = 0.05]. There was no statistically significant effect on the calibration factor from the tube current. Derived calibration coefficient curves for all possible filtrations are shown in Fig. 5. Calibration coefficient curves at higher amounts of copper filtration (0.6 and 0.9 mm) are limited to tube voltages above 80 kVp. The photon energy fluence is too low at combinations of high filtration and low voltage to yield reliable statistics.
Figure 4.
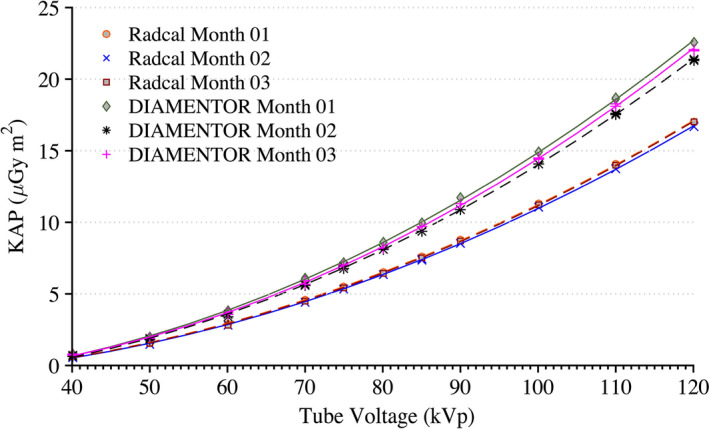
Measurements of KAP for the installed DIAMENTOR meter and reference chamber taken at a tube current of 200 mA and pulse width of 300 ms with 0.1 mm of Cu filtration over a period of 3 months. Radcal Month 1 and Radcal Month 3 are superimposed. [Color figure can be viewed at wileyonlinelibrary.com]
Figure 5.
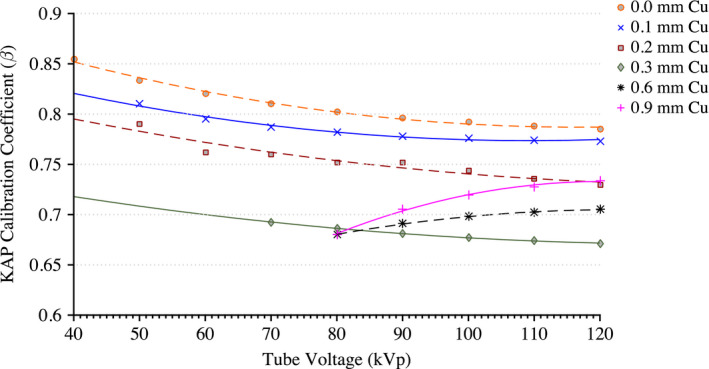
Calibration coefficient measurements for each tube filtration available to the Siemens Artis zee system. [Color figure can be viewed at wileyonlinelibrary.com]
The results of the tabletop and pad CT scan where used to construct a computational model for MCNPX simulations as seen in Fig. 6. The CT scans provided measurements for the internal dimensions of the tabletop. The edges of the table had a nominal thickness of 0.662 ± 0.036 cm, top of table 0.327 ± 0.025 cm, bottom of table 0.285 ± 0.023 cm, sloping sides 0.221 ± 0.024 cm, and an air gap varying from 4.1 cm to 3.2 cm as one moves from superior to inferior end. The MCNPX geometry was modeled based on this CT scan. The generation of the virtual source started with the measurements of Al HVL as shown Fig. 7. The effects on the spectra relative intensity after hardening to match the desired half‐value layer may be seen in Fig. 8. For this particular case, the tube voltage was set at 120 kVp with 0.3 mm of Cu filtration. The beam was iteratively hardened until the goal of 10.20 mm Al HVL was reached. The calculated attenuation coefficients as a function of angle of incidence are plotted in Figs. 9 and 10.
Figure 6.

Computational model of tabletop and pad used for Monte Carlo simulations. Dimensions are based on CT images obtained of the tabletop and pad used in the Siemens Artis zee suite at University of Florida College of Medicine at Jacksonville Division of Vascular and Interventional Radiology. [Color figure can be viewed at wileyonlinelibrary.com]
Figure 7.
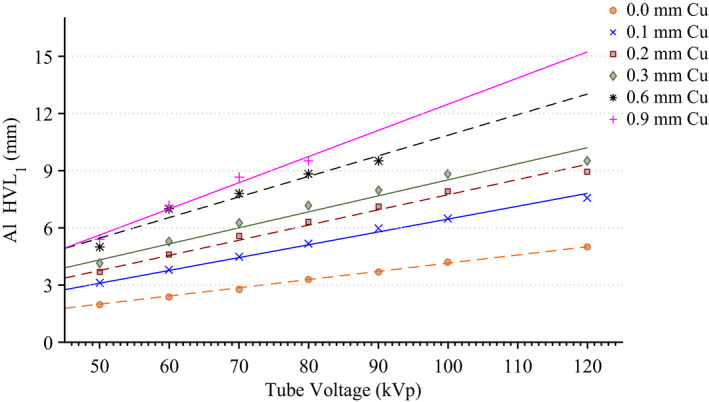
Measurements of Al HVL for various tube voltage and filtration combinations along with a linear regression best fit line. [Color figure can be viewed at wileyonlinelibrary.com]
Figure 8.
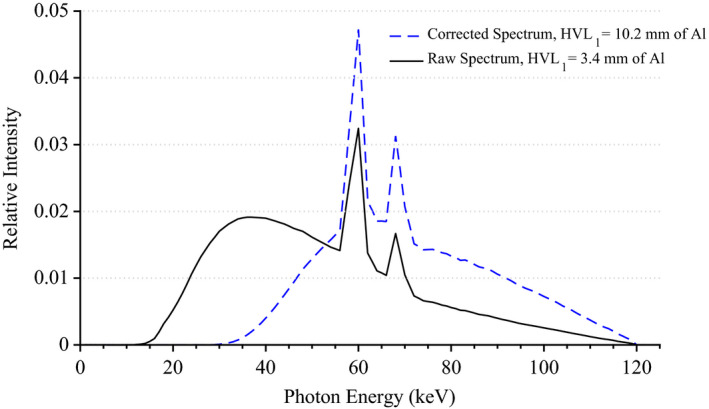
X‐ray energy spectra for a tube voltage of 120 kVp and 0.3 mm of Cu filtration before and after matching to a measured Al HVL. [Color figure can be viewed at wileyonlinelibrary.com]
Figure 9.
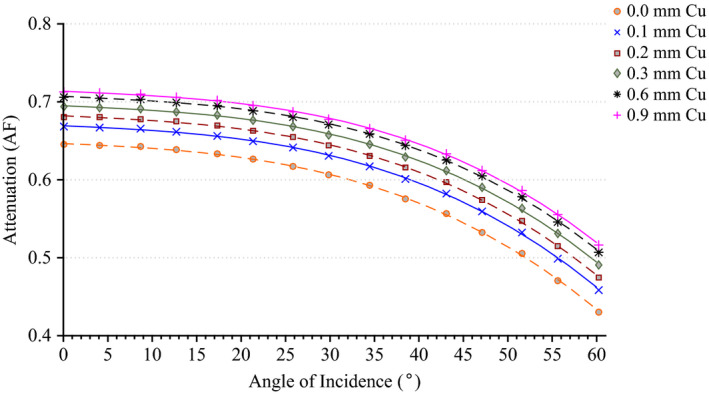
Attenuation factor of the useful x‐ray beam through the tabletop and pad for the Siemens Artis zee as a function of the angle of incidence at 70 kVp. [Color figure can be viewed at wileyonlinelibrary.com]
Figure 10.
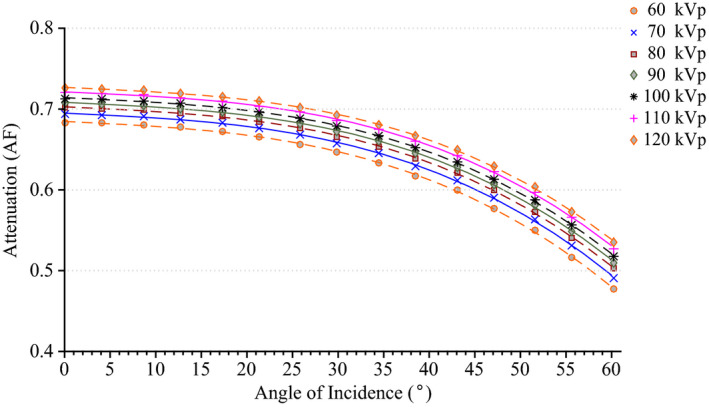
Attenuation factor of the useful x‐ray beam through the tabletop and pad for the Siemens Artis zee as a function of the angle of incidence at 0.3 mm of Cu filtration. [Color figure can be viewed at wileyonlinelibrary.com]
Table 5 displays the results of the UF‐RIPSA for each of the 10 patients in the cohort study. Data in the third column from the right display the cumulative reference air kerma as reported in the RDSR file. In contrast, data in the second to last column of Table 5 report the peak skin dose as given by the UF‐RIPSA prior to corrections for both spectrum‐dependent KAP meter calibration and tabletop with pad attenuation. Finally, the data in the final column of Table 5 report our best estimate of peak skin dose, where all corrections are applied. For this particular unit, dose estimates are lower in final column than in the second to last column of the table. In nine of the 10 cases, best‐estimates of peak skin dose are shown to be lower than the reported cumulative reference air kerma. The one exception is Patient 1313, where the reference air kerma, uncorrected peak skin dose, and corrected peak skin dose are 5.8, 11.3, and 6.3 Gy, respectively.
Table 5.
Results of the skin dose‐mapping software for a select group of high‐dose fluoroscopically guided interventional procedures
| RDSR | Procedure | Sex | Patient‐matched phantom | Ka,r (mGy) | Peak skin dose (mGy) | Corrected peak skin dose (mGy) |
|---|---|---|---|---|---|---|
| 1106 | Endovascular stent graft repair of abdominal aortic aneurysm | M | [180 cm/120 kg] | 8,476 | 5,942 | 3,620 |
| 1193 | Superior mesenteric artery stent placement | M | [170 cm/75 kg] | 8,407 | 8,561 | 5,025 |
| 1124 | Bilateral uterine artery embolization | F | [160 cm/70 kg] | 8,192 | 9,328 | 5,652 |
| 1025 | AAA stent graft repair | M | [175 cm/115 kg] | 7,581 | 8,253 | 4,853 |
| 1141 | Cecostom tube replacement | M | [135 cm/60 kg] | 6,464 | 7,234 | 4,369 |
| 1325 | Abdominal angiography; angioplasty of the superior mesenteric artery; stenting of celiac artery origin and bilateral renal arteries | M | [175 cm/75 kg] | 6,376 | 6,919 | 4,074 |
| 1166 | Selective angiograph of celiac and superior mesenteric artery | M | [175 cm/90 kg] | 6,300 | 7,148 | 4,175 |
| 1150 | Endovascular stent graft repair of abdominal aortic aneurysm | M | [180 cm/75 kg] | 5,857 | 4,725 | 2,923 |
| 1313 | TIPS placement from right hepatic vein to right portal vein | F | [165 cm/75 kg] | 5,819 | 11,290 | 6,322 |
| 1322 | Diagnostic arteriography of the lower abdomen/pelvis; embolization of left internal illiac artery and inferior mesenteric artery | M | [175 cm/70 kg] | 5,273 | 5,135 | 2,946 |
For each patient, the average clock time per Monte Carlo FGI procedure simulation was ~25 min while the total throughput of the dose estimate, including the reading and processing of the entire RDSR averaged ~38 min on the University of Florida HiPerGator cluster. Organ doses in units of mGy for each of the 10 cohort patients are summarized in Table 6 in which unique and HVL1 fitted x‐ray spectra were applied for each individual irradiation event of the patient RDSR. All in‐field organ tallies converged with a relative error of less than 1% and out‐of‐field organs tallies with a relative error less than 10%. As part of our sensitivity study, Tables 7 and 8 provide ratios of organ doses to those given in Table 6 for (a) use of the non‐adjusted x‐ray spectra, and (b) use of a mono‐energetic equivalent energy x‐rays for each irradiation event, respectively.
Table 6.
Results of the organ dose calculations for ten patients who underwent a fluoroscopically guided procedure on the Siemens Artis zee
| Organ doses (mGy) | ||||||||||||||||
|---|---|---|---|---|---|---|---|---|---|---|---|---|---|---|---|---|
| RDSR | Ka,r (mGy) | Lung | Pericardium | Bladder | Stomach | Pancreas | Liver | Spleen | Kidney (L) | Kidney (R) | Adrenal (L) | Adrenal (R) | Esophagus | Gallbladder | Intestines | Thyroid |
| 1106 | 8,476 | 193 | 107 | 0 | 40 | 17 | 34 | 130 | 35 | 19 | 62 | 34 | 121 | 14 | 4 | 28 |
| 1193 | 8,407 | 10 | 6 | 38 | 62 | 176 | 30 | 80 | 445 | 478 | 74 | 104 | 9 | 55 | 102 | 1 |
| 1124 | 8,192 | 38 | 33 | 22 | 307 | 797 | 106 | 599 | 1,719 | 664 | 613 | 487 | 55 | 255 | 191 | 4 |
| 1025 | 7,581 | 15 | 15 | 98 | 70 | 191 | 74 | 89 | 316 | 799 | 118 | 257 | 20 | 170 | 170 | 1 |
| 1141 | 6,464 | 10 | 9 | 78 | 37 | 97 | 65 | 27 | 129 | 628 | 51 | 114 | 9 | 99 | 175 | 2 |
| 1325 | 6,376 | 4 | 4 | 131 | 16 | 40 | 6 | 29 | 69 | 42 | 21 | 12 | 3 | 13 | 130 | 0 |
| 1166 | 6,300 | 5 | 3 | 62 | 6 | 20 | 30 | 9 | 31 | 276 | 11 | 83 | 4 | 41 | 70 | 0 |
| 1150 | 5,857 | 2 | 1 | 17 | 3 | 11 | 14 | 3 | 10 | 157 | 4 | 28 | 1 | 25 | 65 | 0 |
| 1313 | 5,819 | 1 | 1 | 81 | 2 | 2 | 1 | 4 | 6 | 4 | 2 | 2 | 0 | 1 | 13 | 0 |
| 1322 | 5,273 | 255 | 142 | 1 | 67 | 33 | 279 | 207 | 52 | 113 | 133 | 284 | 171 | 93 | 12 | 9 |
Table 7.
Ratio of the computed organ dose using non‐HVL‐fitted x‐ray spectra to those with HVL‐fitted x‐ray spectra
| Ratio of computed organ doses (non‐fitted to fitted spectrum) | ||||||||||||||||||
|---|---|---|---|---|---|---|---|---|---|---|---|---|---|---|---|---|---|---|
| RDSR | Ka,r (mGy) | Lung | Pericardium | Bladder | Stomach | Pancreas | Liver | Spleen | Kidney (L) | Kidney (R) | Adrenal (L) | Adrenal (R) | Esophagus | Gallbladder | Intestines | Thyroid | Average ratio | COV (%) |
| 1106 | 8,476 | 0.50 | 0.45 | 0.38 | 0.40 | 0.38 | 0.42 | 0.43 | 0.41 | 0.42 | 0.40 | 0.41 | 0.45 | 0.39 | 0.38 | 0.47 | 0.42 | 8.3% |
| 1193 | 8,407 | 0.49 | 0.46 | 0.44 | 0.47 | 0.48 | 0.48 | 0.51 | 0.52 | 0.56 | 0.49 | 0.51 | 0.46 | 0.47 | 0.47 | 0.47 | 0.49 | 6.4% |
| 1124 | 8,192 | 0.51 | 0.49 | 0.44 | 0.52 | 0.54 | 0.49 | 0.60 | 0.59 | 0.54 | 0.55 | 0.53 | 0.50 | 0.50 | 0.50 | 0.47 | 0.52 | 8.4% |
| 1025 | 7,581 | 0.47 | 0.46 | 0.46 | 0.52 | 0.51 | 0.46 | 0.50 | 0.51 | 0.54 | 0.48 | 0.49 | 0.44 | 0.48 | 0.51 | 0.47 | 0.49 | 5.4% |
| 1141 | 6,464 | 0.31 | 0.28 | 0.33 | 0.30 | 0.32 | 0.34 | 0.31 | 0.36 | 0.43 | 0.32 | 0.35 | 0.29 | 0.33 | 0.34 | 0.28 | 0.33 | 11.5% |
| 1325 | 6,376 | 0.47 | 0.42 | 0.44 | 0.42 | 0.44 | 0.40 | 0.46 | 0.45 | 0.45 | 0.41 | 0.41 | 0.39 | 0.41 | 0.50 | 0.41 | 0.43 | 6.9% |
| 1166 | 6,300 | 0.48 | 0.42 | 0.46 | 0.45 | 0.48 | 0.50 | 0.48 | 0.50 | 0.55 | 0.45 | 0.53 | 0.42 | 0.49 | 0.49 | 0.43 | 0.48 | 7.8% |
| 1150 | 5,857 | 0.44 | 0.40 | 0.45 | 0.41 | 0.43 | 0.43 | 0.43 | 0.44 | 0.51 | 0.42 | 0.45 | 0.40 | 0.43 | 0.47 | 0.44 | 0.44 | 6.4% |
| 1313 | 5,819 | 0.53 | 0.52 | 0.51 | 0.54 | 0.52 | 0.50 | 0.56 | 0.55 | 0.54 | 0.50 | 0.50 | 0.52 | 0.50 | 0.51 | 0.52 | 0.52 | 3.5% |
| 1322 | 5,273 | 0.58 | 0.52 | 0.44 | 0.50 | 0.47 | 0.55 | 0.57 | 0.50 | 0.53 | 0.52 | 0.54 | 0.51 | 0.49 | 0.47 | 0.48 | 0.51 | 7.6% |
| Average ratio | 0.48 | 0.44 | 0.44 | 0.45 | 0.46 | 0.46 | 0.49 | 0.48 | 0.51 | 0.45 | 0.47 | 0.44 | 0.45 | 0.46 | 0.44 | 0.46 | 4.4% | |
| COV (%) | 15% | 16% | 11% | 16% | 14% | 13% | 17% | 14% | 11% | 15% | 14% | 16% | 13% | 13% | 14% | |||
Table 8.
Ratio of the computed organ doses using mono‐energetic equivalent x‐ray energies to those based upon HVL‐fitted x‐ray spectra
| Ratio of computed organ doses (effective energy to fitted spectrum) | Average ratio | COV (%) | ||||||||||||||||
|---|---|---|---|---|---|---|---|---|---|---|---|---|---|---|---|---|---|---|
| RDSR | Ka,r (mGy) | Lung | Pericardium | Bladder | Stomach | Pancreas | Liver | Spleen | Kidney (L) | Kidney (R) | Adrenal (L) | Adrenal (R) | Esophagus | Gallbladder | Intestines | Thyroid | ||
| 1106 | 8,476 | 0.10 | 0.04 | 0.01 | 0.04 | 0.03 | 0.04 | 0.12 | 0.08 | 0.07 | 0.06 | 0.05 | 0.03 | 0.01 | 0.01 | 0.01 | 0.04 | 75.4% |
| 1193 | 8,407 | 0.05 | 0.01 | 0.04 | 0.02 | 0.03 | 0.03 | 0.06 | 0.09 | 0.18 | 0.02 | 0.06 | 0.01 | 0.02 | 0.04 | 0.02 | 0.04 | 95.1% |
| 1124 | 8,192 | 0.05 | 0.02 | 0.01 | 0.06 | 0.11 | 0.03 | 0.21 | 0.20 | 0.17 | 0.10 | 0.09 | 0.03 | 0.04 | 0.05 | 0.01 | 0.08 | 86.8% |
| 1025 | 7,581 | 0.05 | 0.02 | 0.04 | 0.04 | 0.04 | 0.05 | 0.07 | 0.09 | 0.15 | 0.05 | 0.08 | 0.02 | 0.04 | 0.07 | 0.02 | 0.05 | 60.7% |
| 1141 | 6,464 | 0.05 | 0.01 | 0.07 | 0.03 | 0.06 | 0.09 | 0.06 | 0.14 | 0.25 | 0.07 | 0.11 | 0.02 | 0.06 | 0.08 | 0.02 | 0.08 | 79.2% |
| 1325 | 6,376 | 0.12 | 0.04 | 0.03 | 0.04 | 0.04 | 0.03 | 0.17 | 0.09 | 0.08 | 0.07 | 0.04 | 0.04 | 0.01 | 0.08 | 0.04 | 0.06 | 69.2% |
| 1166 | 6,300 | 0.08 | 0.02 | 0.02 | 0.01 | 0.01 | 0.04 | 0.07 | 0.03 | 0.08 | 0.02 | 0.05 | 0.02 | 0.01 | 0.02 | 0.01 | 0.03 | 79.1% |
| 1150 | 5,857 | 0.06 | 0.01 | 0.01 | 0.01 | 0.01 | 0.06 | 0.03 | 0.02 | 0.14 | 0.01 | 0.06 | 0.02 | 0.04 | 0.04 | 0.03 | 0.04 | 94.2% |
| 1313 | 5,819 | 0.05 | 0.02 | 0.02 | 0.03 | 0.02 | 0.03 | 0.08 | 0.09 | 0.09 | 0.03 | 0.04 | 0.01 | 0.01 | 0.02 | 0.03 | 0.04 | 73.5% |
| 1322 | 5,273 | 0.12 | 0.03 | 0.01 | 0.03 | 0.02 | 0.08 | 0.14 | 0.06 | 0.10 | 0.05 | 0.07 | 0.02 | 0.02 | 0.02 | 0.01 | 0.05 | 83.1% |
| Average ratio | 0.07 | 0.02 | 0.03 | 0.03 | 0.04 | 0.05 | 0.10 | 0.09 | 0.13 | 0.05 | 0.06 | 0.02 | 0.03 | 0.04 | 0.02 | 0.05 | 64.9% | |
| COV (%) | 42% | 48% | 83% | 54% | 78% | 49% | 57% | 58% | 44% | 54% | 36% | 31% | 69% | 59% | 52% | |||
Figure 11 shows the disparity in dose delivered per irradiation event for RDSR No. 1124. Each of the irradiation events in Fig. 11 contribute equally to computational time but not to organ doses. Figures 12 and 13 provide the results of our sensitivity study of percent contribution of irradiation events to cumulative organ dose for a (a) bilateral uterine artery embolization and (b) an abdominal angiography (angioplasty of the superior mesenteric artery, and stenting of celiac artery and bilateral renal arteries). The RDSR identifiers for these procedures are 1124, and 1325 (see Table 5). In each figure, the fraction of total organ dose is shown when considering only irradiation events that register a cumulative reference air kerma in its 90, 85, 75, 50, 45, and 25th percentile and above. The number of irradiation events for these RDSRs are 117 and 299, respectively.
Figure 11.
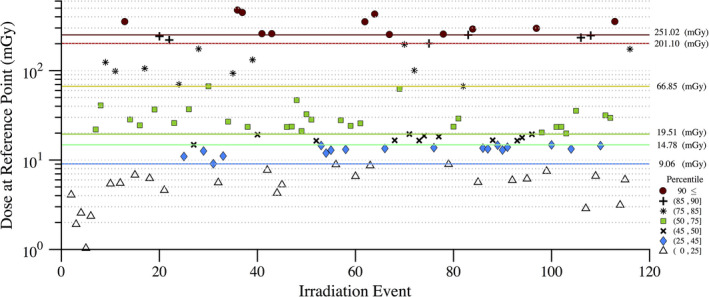
Disparity in dose (mGy) at the reference point for each irradiation event of RDSR No. 1124. Patient underwent a bilateral uterine artery embolization. The corresponding dose at the reference point for each irradiation event is color coded to illustrate how that irradiation event compares to other events within the procedure. The horizontal lines reflect the 90, 85, 75, 50, 45, and 25th percentile cutoffs. [Color figure can be viewed at wileyonlinelibrary.com]
Figure 12.
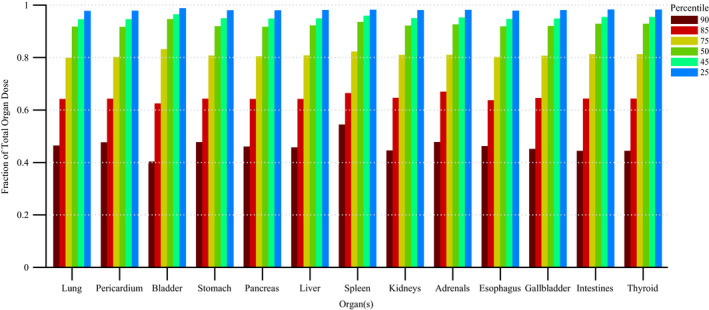
Fraction of total organ dose when considering only irradiation events that register a cumulative reference air kerma in the 90, 85, 75, 50, 45, and 25th percentile and above. Plot corresponds to RDSR No. 1124 with 117 irradiation events. Procedure was described as a bilateral uterine artery embolization. [Color figure can be viewed at wileyonlinelibrary.com]
Figure 13.
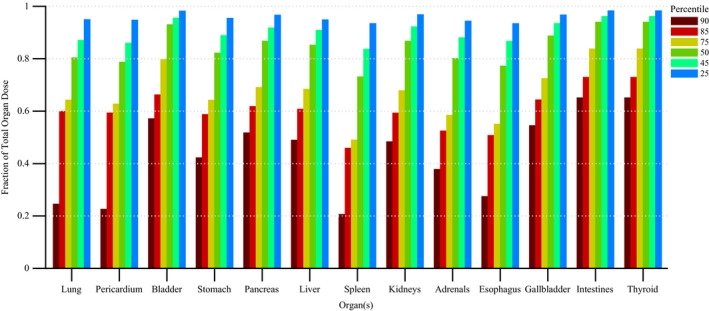
Fraction of total organ dose when considering only irradiation events that register a cumulative reference air kerma in the 90, 85, 75, 50, 45, and 25th percentile and above. Plot corresponds to RDSR No. 1325 with 299 irradiation events. Procedure was described as an abdominal angiography; angioplasty of the superior mesenteric artery; and stenting of celiac artery origin and bilateral renal arteries. [Color figure can be viewed at wileyonlinelibrary.com]
4. Discussion
4.A. Skin dose mapping using UF‐RIPSA
Based on the RDSRs gathered and the frequency and distribution of irradiation event parameters as shown in Fig. 3, it is clear that if the KAP meter has strong energy dependence, it would not be appropriate to perform a simple point calibration. Resultantly, the authors have sought to develop a full set of calibration curves. The calibration curves developed are not expected to drift over time based on measurements over a 3‐month period, as demonstrated in Fig. 4. These results are advantageous for the adoption of calibration coefficients curves by demonstrating that the installed KAP meter is precise. Under equal irradiation conditions, the KAP meter always reads the same value independent of the angulation of the C‐arm fluoroscope. This confirms that the Siemens Artis zee does not attempt to apply its own convolution to the raw readings in attempt to account for under the table projections. No effects of saturation of either chamber were seen at high currents and voltages. In fact, heat issues with the anode were the limiting factor in achieving higher outputs from the unit. These results indicate that only the tube voltage need be varied at each filtration to understand the behavior of the KAP meter. For beams filtered with less than 0.3 mm of Cu, the calibration coefficient is monotonically decreasing. For harder beams, as seen with 0.6 mm and 0.9 mm, the behavior of the calibration coefficient is reversed which is consistent with that reported in previous studies.26, 27, 28 In either case, the calibration coefficient is always less than unity indicating that the reported KAP and Ka,r are presently overestimating dose to the patient in the tested unit. The beam is attenuated to roughly ~70% of its value when it is normal to the tabletop and pad which, based on the collected RDSRs, was most often the case when the x‐ray tube is positioned below the tabletop (angle of incidence ≤10 degrees 81.9% of the time).
The attenuation factor for a beam of 70 kVp with 0.3 mm of added Cu filtration decreases from 0.69, 0.68, 0.62 to 0.49 as the angle of incidence increases from 0, 20, 40, to 60 degrees, respectively. The difference in the attenuation factor between a heavily filtered beam with 0.9 mm of added Cu filtration to that of a beam with only inherent filtration increases from 9% to 17% as the angle of incidence increases from 0 to 60 degrees, respectively (see Fig. 9). The attenuation factor for a beam of 90 kVp with 0.3 mm of added Cu filtration decreases from 0. 70, 0.69, 0.64, to 0.51 as the angle of incidence increases from 0, 20, 40, to 60 degrees, respectively. The difference in the attenuation factor between a beam of 120 kVp to 60 kVp increases from 7% to 13% as the angle of incidence increases from 0 to 60 degrees, respectively (see Fig. 10). Overall, the attenuation factor increases for harder spectra (i.e., increasing peak tube potential and amount of added filtration) and as the angle of incidence increases, the attenuation factor decreases.
Adding both the calibration and attenuation coefficients into the peak skin dose algorithm reduced the overall dose estimation from FGIs. As an example, Patient 1166 (RDSR 1166) from Table 5 underwent a selective angiograph of the celiac and superior mesenteric artery. Before applying the correction factors, this patient had a higher calculated peak skin dose than the cumulative reference air kerma; however, after taking into account the over‐estimation in the KAP meter along with both tabletop and pad attenuation, the algorithm's estimate of peak skin dose dropped by about 42%. Such a large drop in calculated peak skin dose may not always be the case – specifically in situations where the KAP meter is underestimating dose. Although rare, two effects can contribute to the cumulative reference air kerma underestimating peak skin dose. This is seen in interventional procedures where little panning is performed allowing for the irradiation fields to be localized and concentrated on one spot. Second, the International Electrotechnical Commission (IEC) defines the reference air kerma at a location 15 cm from the isocenter toward the x‐ray tube; therefore, if the patient's outer body contour lies beyond this point on the side closest to the fluoroscopic tube, the calculated dose will be higher than the registered reference air kerma.
Peak skin dose provides a useful quantitative metric; however, it must be coupled with an anatomical landmark along with a spatial distribution to fully understand the irradiation conditions. The peak skin dose is often the result of where multiple irradiation fields are being superimposed and not as a result of a single field. This effect is best seen when looking at skin dose maps and skin dose area histograms as shown in Figs. 14 and 15. Relying solely on the reference air kerma fails to provide an appropriate peak skin dose estimate or a spatial distribution of skin dose. Both these shortcomings are addressed in the skin dose‐mapping software while accounting for KAP calibration factors and the attenuation due to the tabletop with pad.
Figure 14.
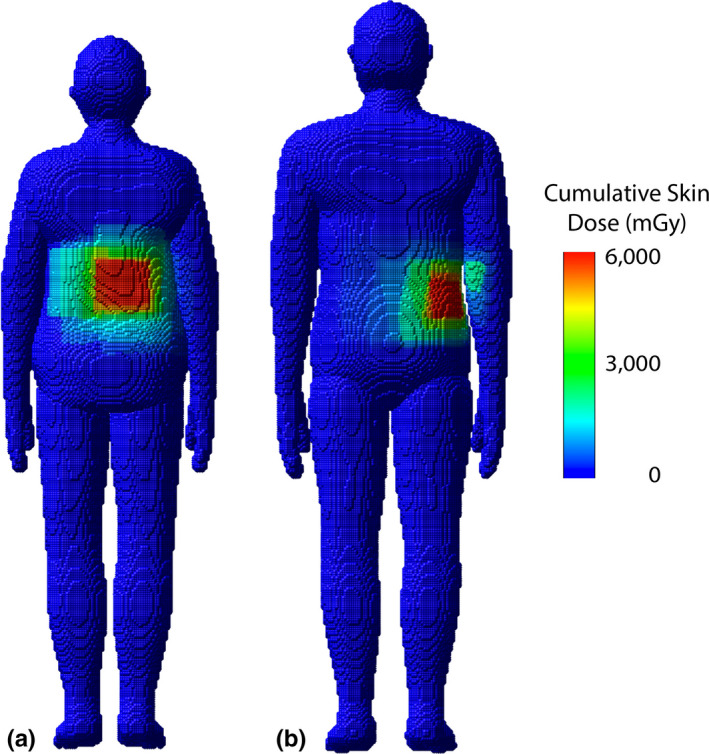
Skin dose maps for a select female and male patient corresponding to (a) RDSR 1124 and (b) 1193, respectively, from Table 5. Peak skin dose for RDSR 1124 reached 5,652 mGy and patient was matched by height and weight to the female 160 cm and 70 kg UF/NCI hybrid computational phantom. Peak skin dose for RDSR 1193 reached 5,025 mGy and patient was matched to the male 170 cm and 75 kg phantom.
Figure 15.
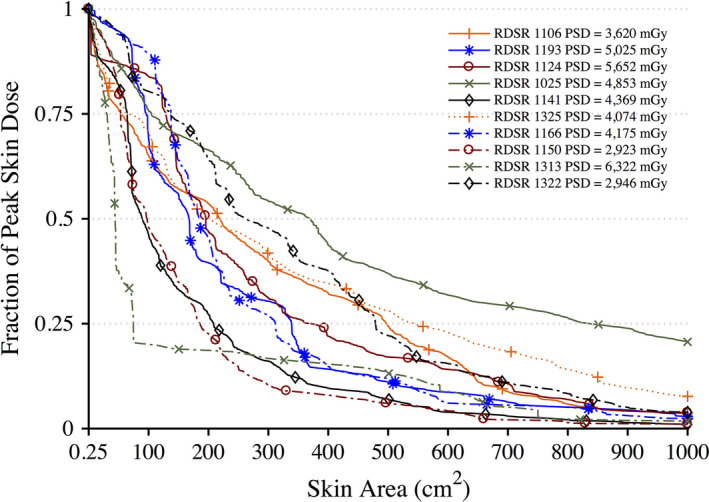
Dose‐area histograms (DAHs) for 10 select high‐dose cases normalized to peak skin dose. Ordinate indicates what fraction of peak skin dose is delivered to an area of exposed patient skin given on the abscissa. [Color figure can be viewed at wileyonlinelibrary.com]
4.B. Organ dose assessment using UF‐MODS
The organ dose results demonstrate that it is feasible to move away from the use of fixed field, single‐phantom dose coefficients for FGI organ dosimetry, and toward a higher level of patient specificity, both in terms of phantom morphometry and explicit consideration to the dynamic nature of FGIs. The organ dose data shown in Table 6 for each of the 10 patients is readily obtained by the UF‐MODS software.
Tables 7 and 8 indicate the requirement for proper assignment of the x‐ray energy spectrum that match voltage and filtration specific HVL values. The data of Table 7 indicate that when the full energy spectra for each irradiation event is applied in the MCNPX simulations, but are not properly matched to measured values of HVL, organ doses would be under‐reported by ~54% on average as these spectra would not be appropriately hardened. Organ doses are under‐reported, as seen in Table 8, when only a single equivalent x‐ray energy is applied to the simulations. In this case, reported values of organ dose would be given at only ~5% of their values for which spectrums matched measured HVL. These dose ratios indicate that proper spectral characterization is prudent.
Complex and high‐dose FGI procedures are comprised of a large number of irradiation events; however, while not all events contribute equally to the aggregate organ dose, they do contribute equally to computational time. In the interest of reducing computational time, one may potentially select to model only those irradiation events that contribute to a given nth percentile of cumulative patient organ dose. This concept is best illustrated in Fig. 12, in which for all organs of interest, Monte Carlo simulations of the top 50th percentile of irradiation events with the highest cumulative reference air kerma are shown to produce organ dose estimates that are ≥90% of the cumulative organ dose as estimated when all irradiation events are modeled. This translates to a 50% percent reduction in computational time while sacrificing ≤10% accuracy. For some patients, however, this may not be the case. For the data in Fig. 13, modeling the 25th percentile and above is required to produce organ dose estimates that are ≥90% of the cumulative organ dose as estimated when all irradiation events are modeled. This represents a 25% reduction in computational time. Posteriori decision as to whether all irradiation events should be modeled is possible depending on the end user needs.
There are expected limitations to both the UF‐RIPSA and UF‐MODS software, some of which can be addressed with further research and code modifications. Regarding UF‐RIPSA, one primary limitation is the lack of dose contribution from x‐ray scatter voxel‐to‐voxel on the skin phantom of the patient. UF‐RIPSA validation studies in our laboratory using optically stimulated luminescent dosimetry confirm that on average, UF‐RIPSA underreports voxel‐level skin dose by ~5%.29 This is directly attributed to the fact that UF‐RIPSA is based upon a ray‐trace algorithm of the reported reference air kerma, and while x‐ray backscatter is accounted for via the BSF term in Eq. (1), lateral x‐ray scatter is not modeled. It is possible, however, through Monte Carlo simulation to generate a library of energy‐dependent x‐ray scatter factors in a similar manner. A second limitation is that the voxelized skin model of the library‐selected hybrid phantom may not exactly match the 3D skin contour of the individual patient. Again, the strength of hybrid phantoms is the ability to sculpt the outer body contour. Given a point cloud defining the true patient body contour, generated either from a prior CT image or acquired via rotational imaging by the fluoroscopic unit, a skin morphing algorithm may be applied to reshape the body contour of the selected phantom prior to running UF‐RIPSA.
Regarding UF‐MODS, there are three primary limitations to consider. First, the UF hybrid phantom library—constructed as a function of body height and weight—does not account for differences in lean body mass at a given height/weight combination. The presence of higher skeletal muscle than assumed in the patient‐matched phantom might introduce systematic errors in internal organ dose, especially for softer x‐ray spectra. This is an acknowledged limitation of the UF/NCI phantom library. Second, while not as much of a concern for skin dose, errors in the assumed location of the phantom on the examination table can introduce corresponding errors in organ dose. Proper accounting for the actual patient location on the table may be made by purposely placing the patient on a marked location on the table, or by selecting a range of irradiation events that center on a given organ location, such as cardiac‐centered studies. Finally, phantoms in the present UF/NCI library have arms at their side, while some more complex procedures might have the patient reposition their arms (or even their legs) in non‐standard positions. This limitation is easily resolved by expanding the phantom library to include a selection of more common patient extremity positions. Of course, a unique phantom can be constructed prior to organ dose simulation, even though this would be an issue in the clinical workflow.
5. Conclusions
The purpose of this study was to first calibrate the installed KAP meter through a series of in‐clinic measurements along with developing a library of tabletop with pad attenuation factors for varying x‐ray qualities and angulations. It was demonstrated that the calibration factors are dependent only on the tube voltage and amount of filtration—data that is conveniently reported within the RDSR. A set of calibration curves for the KAP meter were developed and incorporated into the skin dose‐mapping program. A method for deriving measurement‐based energy spectra from which to perform Monte Carlo simulations was described. By coupling the Monte Carlo code with x‐ray spectrum and geometric information, it was then feasible to generate a library of attenuation factors. These corrections were added to the skin dose‐mapping software so that it can now automatically search for the needed variables from the RDSR, calculate the calibration coefficients, and finally apply the corrections in its calculation of skin dose.
Fluoroscopically guided interventions may offer a life‐saving benefit and it is important to remember that it is not appropriate to apply dose limits whenever the medical exposure is justified.30 The benefit‐risk estimate for interventional procedures is a continuous evaluation. This continuous evaluation should include information of radiation dose during the procedure and for patients that face multiple procedures a detailed dosimetric evaluation should be performed.1 The work presented in this study represent attempts to optimize dose utilization and inform the benefit‐risk estimate process for a FGI procedure by providing physicians and clinical staff the knowledge of both the patient's distribution of skin dose and knowledge of internal organ doses at a high level of dosimetric specificity. These techniques if implemented in clinic thus allow the medical community to move beyond simple applications of pre‐computed dose coefficients, and instead model each irradiation event separately on a patient‐dependent model that best anatomically matches the patient. The dosimetry results of this work can be included in a patient's medical record for longitudinal dose tracking, used to establish reference levels, and/or radiation epidemiological studies.
Acknowledgments
This work was supported in part by fellowship 1F31CA159464 from the National Cancer Institute.
Notes
D Landvik and AB Michael, US Patent No. 7507468B2 (Accessed March 24, 2009).
Tempur‐Med, “TEMPUR‐MED Pressure Relieving Products,” in Tempur‐Pedic International Inc. (2005)
References
- 1. NCRP Report No. 168 . Radiation dose management for fluoroscopically guided interventional medical procedures. National Council on Radiation Protection and Measurement; 2010.
- 2. Miller DL, Balter S, Schueler BA, Wagner LK, Strauss KJ, Vano E. Clinical radiation management for fluoroscopically guided interventional procedures. Radiology. 2010;257:321–332. [DOI] [PubMed] [Google Scholar]
- 3. Federal Guidance Report No. 14 . Radiation protection guidance for diagnostic and interventional x‐ray procedures. Report No. EPA‐402R‐10003, U.S. Environmental Protection Agency; 2014.
- 4. Kaufman JA, Reekers JA, Burnes JP, et al. Global statement defining interventional radiology. Cardiovasc Interv Radiol. 2010;33:672–674. [DOI] [PubMed] [Google Scholar]
- 5. Rana VK, Rudin S, Bednarek DR. A tracking system to calculate patient skin dose in real‐time during neurointerventional procedures using a biplane x‐ray imaging system. Med Phys. 2016;43:5131. [DOI] [PMC free article] [PubMed] [Google Scholar]
- 6. Dashkoff N, Bednarek D, Rana V, Rudin S. Implementation of a real‐time skin dose tracking system in a cardiac catheterization laboratory. J Am Coll Cardiol. 2012;60:B90. [Google Scholar]
- 7. Johnson PB, Borrego D, Balter S, Johnson K, Siragusa D, Bolch WE. Skin dose mapping for fluoroscopically guided interventions. Med Phys. 2011;38:5490–5499. [DOI] [PMC free article] [PubMed] [Google Scholar]
- 8. Khodadadegan Y, Zhang M, Pavlicek W, et al. Automatic monitoring of localized skin dose with fluoroscopic and interventional procedures. J Digit Imaging. 2011;24:626–639. [DOI] [PMC free article] [PubMed] [Google Scholar]
- 9. Schlattl H, Zankl M, Hausleiter J, Hoeschen C. Local organ dose conversion coefficients for angiographic examinations of coronary arteries. Phys Med Biol. 2007;52:4393–4408. [DOI] [PubMed] [Google Scholar]
- 10. Bozkurt A, Bor D. Simultaneous determination of equivalent dose to organs and tissues of the patient and of the physician in interventional radiology using the Monte Carlo method. Phys Med Biol. 2007;52:317–330. [DOI] [PubMed] [Google Scholar]
- 11. Smans K, Struelens L, Hoornaert MT, et al. A study of the correlation between dose area product and effective dose in vascular radiology. Radiat Prot Dosim. 2008;130:300–308. [DOI] [PubMed] [Google Scholar]
- 12. Badal A, Zafar F, Dong H, Badano A. A real‐time radiation dose monitoring system for patients and staff during interventional fluoroscopy using a GPU‐accelerated Monte Carlo simulator and an automatic 3D localization system based on a depth camera. Proceedings of SPIE 8668, 866828 (March 866819, 862013); 2013.
- 13. International Electrotechnical Commission . IEC 61910‐1: Medical electrical equipment ‐ Radiation dose documentation. Part 1 ‐ Radiation dose structured reports for radiography and radioscopy, International Electrotechnical Commission; 2014.
- 14. Geyer AM, O'Reilly S, Lee C, Long DJ, Bolch WE. The UF/NCI family of hybrid computational phantoms representing the current US population of male and female children, adolescents, and adults–application to CT dosimetry. Phys Med Biol. 2014;59:5225–5242. [DOI] [PMC free article] [PubMed] [Google Scholar]
- 15. ICRU . ICRU Report 74: patient dosimetry for x‐rays used in medical imaging. J ICRU. 2005;5:1–50. [DOI] [PubMed] [Google Scholar]
- 16. Balter S. Methods for measuring fluoroscopic skin dose. Pediatr Radiol. 2006;36:136–140. [DOI] [PMC free article] [PubMed] [Google Scholar]
- 17. ICRP . ICRP publication 89: basic anatomical and physiological data for use in radiological protection ‐ reference values. Ann ICRP. 2002;32:1–277. [PubMed] [Google Scholar]
- 18. Lee C, Lodwick D, Hurtado J, Pafundi D, Williams JL, Bolch WE. The UF family of reference hybrid phantoms for computational radiation dosimetry. Phys Med Biol. 2010;55:339–363. [DOI] [PMC free article] [PubMed] [Google Scholar]
- 19. Pelowitz DB. MCNPX User's Manual Version 2.7.0. Los Alamos, NM: Los Alamos National Laboratory, LANL; 2011. [Google Scholar]
- 20. IAEA . Establishing guidance levels in x‐ray guided medical interventioanl procedures: a pilot study. Saftey Report Series. 2009;59:1–163. [Google Scholar]
- 21. Schueler B. Patient dose and the modern angiographic system [abstract]. Med Dosim. 2010;37:3335. [Google Scholar]
- 22. Boone JM, Seibert JA. An accurate method for computer‐generating tungsten anode x‐ray spectra from 30 to 140 kV. Med Phys. 1997;24:1661–1670. [DOI] [PubMed] [Google Scholar]
- 23. Siewerdsen JH, Waese AM, Moseley DJ, Richard S, Jaffray DA. Spektr: a computational tool for x‐ray spectral analysis and imaging system optimization. Med Phys. 2004;31:3057–3067. [DOI] [PubMed] [Google Scholar]
- 24. Turner AC, Zhang D, Kim HJ, et al. A method to generate equivalent energy spectra and filtration models based on measurement for multidetector CT Monte Carlo dosimetry simulations. Med Phys. 2009;36:2154–2164. [DOI] [PMC free article] [PubMed] [Google Scholar]
- 25. Spezi E, Angelini AL, Ferri A. Monte Carlo simulation of the SIEMENS IGRT carbon fibre tabletop. J Phys. 2007;74:021017. [Google Scholar]
- 26. Toroi P, Komppa T, Kosunen A. A tandem calibration method for kerma‐area product meters. Phys Med Biol. 2008;53:4941–4958. [DOI] [PubMed] [Google Scholar]
- 27. Toroi P, Komppa T, Kosunen A, Tapiovaara M. Effects of radiation quality on the calibration of kerma‐area product meters in x‐ray beams. Phys Med Biol. 2008;53:5207–5221. [DOI] [PubMed] [Google Scholar]
- 28. Toroi P, Kosunen A. The energy dependence of the response of a patient dose calibrator. Phys Med Biol. 2009;54:N151–N156. [DOI] [PubMed] [Google Scholar]
- 29. Borrego D. In‐clinic assessment of organ doses for fluoroscopically guided interventional procedures. University of Florida, PhD Dissertation; 2016.
- 30. ICRP . ICRP publication 105: radiation protection in medicine. Ann ICRP. 2007;37:1–63. [DOI] [PubMed] [Google Scholar]


