

Abstract
Arousal responses linked to locus coeruleus noradrenergic (LC-NA) activity affect cognition. However, the mechanisms that control modes of LC-NA activity remain unknown. Here, we reveal a local population of GABAergic neurons (LC-GABA) capable of modulating LC-NA activity and arousal. Retrograde tracing shows that inputs to LC-GABA and LC-NA neurons arise from similar regions, though a few regions provide differential inputs to one subtype over the other. Recordings in the LC demonstrate two modes of LC-GABA responses whereby spiking is either correlated or broadly anti-correlated with LC-NA responses, reflecting anatomically similar and functionally coincident inputs, or differential and non-coincident inputs, to LC-NA and LC-GABA neurons. Coincident inputs control the gain of LC-NA mediated arousal responses, while non-coincident inputs, such as from the prefrontal cortex to LC, alter global arousal levels. These findings demonstrate distinct modes by which an inhibitory LC circuit regulates arousal in the brain.
Reporting summary
Additional information on research design, such as antibody validation and software versions, is available in the Life Sciences Reporting Summary.
Introduction
Noradrenergic (NA) neurons located in the locus coeruleus (LC) send broad projections to a wide variety of brain regions, and their activity correlates with levels of arousal and cognitive performance1–6. During wakefulness, fluctuations in LC-NA arousal modify plasticity7, shift attention3,8, induce anxiety9, or affect discrimination and general sensory perception10–13. Even though the effect of NA-mediated arousal on brain processing has become clearer in recent years, we still have a poor understanding of the mechanisms that regulate NA activity.
LC neurons receive inputs from a large number of brain regions14, which likely underlies the diverse contexts that drive LC-NA neuronal activity, including sensory stimuli and stressors15–19. In particular, LC neurons are thought to be novelty detectors, since NA release increases in response to novel sensory stimuli and with stimulus saliency7,19,20. The novelty response also changes with learning, suggesting that distinct mechanisms suppress or promote LC-NA mediated arousal17,20. Alongside these mechanisms regulating phasic LC responses, the modulation of tonic LC activity can also occur over longer time scales, such as during different levels of vigilance21, or during environmental changes7 or goal-directed behaviors22. Tight regulation of the global level of arousal has a key role in brain processing since unregulated arousal leads to hyperanxiety and detrimental performance12,23. One hypothesis to explain how LC responses are modulated is that local inhibition plays an active in role in controlling LC-NA tonic activity and phasic responses. Consistent with this idea, previous ex-vivo reports using ultrastructural microscopy and slice recordings have shown that LC neurons receive direct GABAergic inputs, and it has been speculated that this inhibitory contribution originates from local GABAergic (LC-GABA) neurons24,25. Recordings across sleep-wake cycles have shown that GABA neurons in or near the LC are modulated during the sleep-wake cycle, similar to LC-NA neurons26,27. However, there has been no study of the location or function of LC-GABA neurons, the inputs they receive, or how they modulate LC-NA activity in the awake animal.
Here, we use a combination of anatomical, electrophysiological and optogenetic tools to identify the location, inputs and function of a local population of LC-GABA neurons in mice, and the mode by which they control LC-NA neurons. We find that the pattern of inputs to LC-GABA neurons allows two modes of inhibition of LC-NA activity: coincident inputs to LC-NA and LC-GABA neurons regulate the gain of phasic NA responses, whereas non-coincident inputs, such as preferential inputs from the prefrontal cortex (PFC) to LC-GABA neurons, regulate LC-NA tonic activity. Together, our findings identify a mechanism by which NA-mediated arousal is selectively modulated in the brain.
Results
Location of GABAergic neurons of the LC
Previous EM ultrastructural studies proposed the existence of GABAergic neurons surrounding LC24. However, a clear map of the location of GABA neurons with respect to LC-NA neurons is lacking. To mark the precise location of LC-NA neurons, we injected dopamine-beta-hydroxylase (Dbh)-Cre mice with a Flex-tdTomato virus and examined coronal sections of the entire LC (Fig. 1a). We used immunohistochemical staining against GABA to localize LC-GABA neurons (Fig. 1b) and marked the location of LC-GABA with respect to LC-NA neurons in each mouse (Fig. 1c). Quantification of neuronal density in the LC region showed a greater density of LC-GABA neurons in the anterior and medial part of the LC (Fig. 1d, e). Overall, we observed that GABA neurons intermingle with and surround NA neurons in the LC.
Figure 1. GABAergic neurons surround and contact LC noradrenergic neurons.
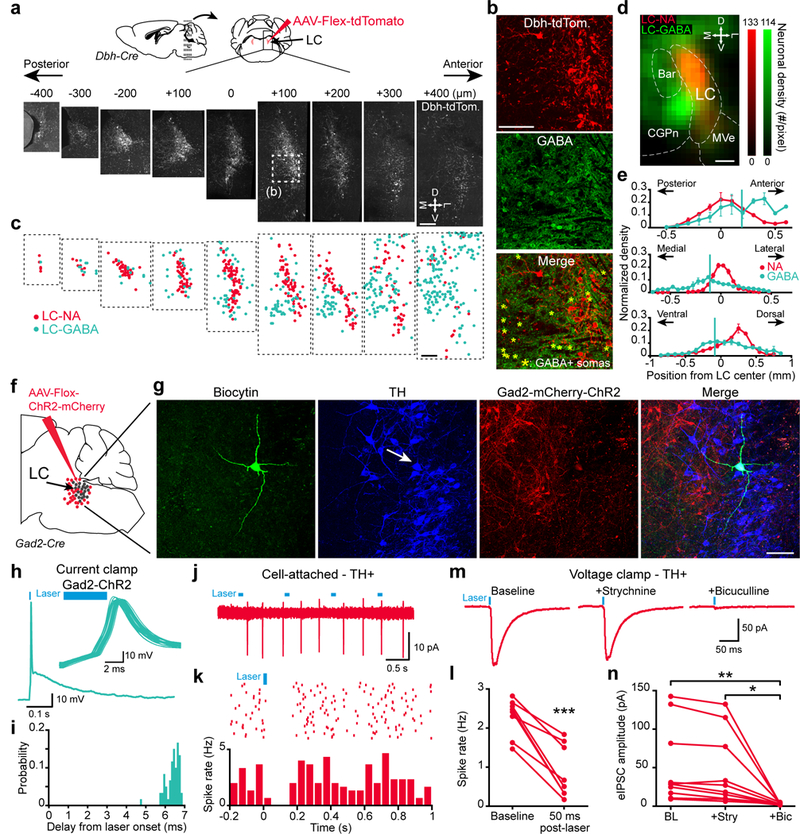
a. Dbh-Cre mice were injected with AAV-Flex-tdTomato virus in the LC and coronal sections were collected. Boxed area (at +100 um location) is shown magnified in (b). M: medial, D: dorsal, L: lateral; V: ventral. b. Location of GABA expressing somata were revealed by immunohistochemistry. c. LC-NA and LC-GABA soma locations derived from (a) and (b). d. Map of LC-GABA and LC-NA neuronal density in a radius of 200 μm around the LC region. The map is projected onto an antero-posterior axis. Bar: Barrington’s nucleus; MVe: medial vestibular nucleus; CGPn: central gray of the pons. e. Distribution of LC-GABA and LC-NA neurons in the 3 axes. Vertical green lines represent the center of the distribution for the GABA+ population. Data are presented as mean ± s.e.m. N = 3 mice used for (a-e). f. Methods for infecting LC-GABA neurons with mCherry/ChR2. g. Example of a LC neuron filled with biocytin during whole cell recordings that expresses tyrosine hydroxylase (TH; arrow). Repeated for 8 LC neurons. h. Current-clamp recording of a Gad2-mCherry expressing neuron. Inset - overlay of multiple trials of the same cell following light activation. i. Distribution of spike delays from light onset of the cell shown in (h). j-k. Example traces from the LC-TH+ neurons displayed in (g). j. Cell-attached recordings during light activation of Gad2 neurons. k. Raster plot and post-stimulus time histogram aligned to light activation. l. Effect of light activation on spike rates for all TH+ neurons recorded (n = 8 neurons from 3 mice, ***: p = 0.00015, two-tailed paired t-test, t7 = −6.5869). m. Trial average (n = 60 trials) IPSCs recorded in voltage-clamp following light activation and the application of strychnine and bicuculline. n. Light-evoked IPSC amplitudes following application of strychnine and bicuculline (n = 10 neurons from 4 mice, one-way repeated measured ANOVA, F2,9 = 8.601, **: p = 0.0034, *: p = 0.0102 using Tukey post-hoc test). Blue bars in (h, j-l) indicate the timing of blue light activation. Scale bars: (a), (c), and (d): 200 μm; (b) and (g): 100 μm;
We next examined whether these local GABA neurons contact LC-NA neurons. To target LC-GABA neurons, we injected the LC of Gad2-IRES-Cre mice with Cre-dependent Flox-mCherry viruses. Quantification of Gad2-Cre expressing neurons with markers for GABA showed an average of 87±1% and 86±2% of cells co-expressing either GABA or GAD67 respectively (Supplementary Fig. 1a,b,e). In contrast, the expression of Gad2-Cre in tyrosine hydroxylase (TH) positive somas was 0.4±0.2% and in neuropeptide S expressing neurons, which have been shown to be expressed in a subset of LC neurons28, 0.8±0.8% (Supplementary Fig. 1c,d,e). GABAergic processes entering the LC-NA region were apposed to TH expressing somas, and staining against the vesicular GABAergic transporter (VGAT) revealed the existence of GABAergic contacts (Supplementary Fig. 1f,g).
To directly assess inhibitory synapses between LC-GABA and LC-NA neurons, we performed acute slice electrophysiological recordings in the LC of Gad2-Cre mice injected with Flox-ChR2 virus (Fig. 1f). Patched neurons were filled with biocytin during whole-cell recording and identified as LC-NA neurons by post-hoc immunohistochemistry against tyrosine hydroxylase (TH) (Fig. 1g). Current-clamp recordings from Gad2-mCherry-ChR2 expressing neurons showed that a 5 ms pulse of blue light was sufficient to elicit a single action potential at short latency (5/5 Gad2-ChR2 neurons recorded) (Fig. 1h, i). Activation of Gad2-ChR2 neurons significantly decreased the spontaneous firing activity of TH-expressing LC-NA neurons, recorded in cell-attached mode (Fig. 1j-l). To assess the synaptic basis of this inhibition, we monitored blue-light evoked inhibitory post-synaptic currents (IPSCs) in TH neurons by performing whole-cell voltage-clamp recordings in these cells. Baseline recording with bath application of AP5 and CNQX, to block fast glutamatergic synaptic transmission, showed an average IPSC amplitude of −50.5±15.8 pA (Fig. 1m,n). Blocking glycinergic transmission with strychnine had no effect on the IPSC, but applying bicuculline, a GABAa receptor antagonist, abolished the current (Fig. 1m,n). These results thus show that a dense population of GABAergic neurons located in the LC region forms functional synaptic contacts with and inhibits LC-NA neurons.
LC-GABA neurons reduce LC-NA-mediated arousal
To test if LC-GABA neurons affect LC-mediated arousal, we first established the relationship between LC-NA activity and pupil size of awake head-restrained mice (Fig. 2a, b). We examined whether pupil size correlates with NA activity using two-photon imaging of axons filled with the genetically encoded calcium indicator GCaMP6s in the visual and prefrontal cortex of Dbh-Cre and TH-Cre mice (Supplementary Fig. 2 a, b). We found that NA activity correlated positively with pupil size and increased before pupil dilation events (Supplementary Fig. 2 c-f). We also confirmed these data with photo-identification of single-units recording in the LC of Dbh-Cre animals expressing Flox-ChR2 (Supplementary Fig. 2 g, h). As an additional indicator of arousal, we examined body movement along with pupil size and found a tight correlation between the two measures (Supplementary Fig. 3). This finding is consistent with previous studies which have shown that pupil size reflects LC neuronal activity1,5,6. It also confirms the relationship between LC NA activity, pupil size and global increase in arousal as previously measured with EEG and cortical LFP recordings4,6,10–12 and locomotion4. We thus consider pupil size as a useful measure of NA-mediated arousal.
Figure 2: Activating LC-GABA neurons reduces LC-NA mediated pupil size.
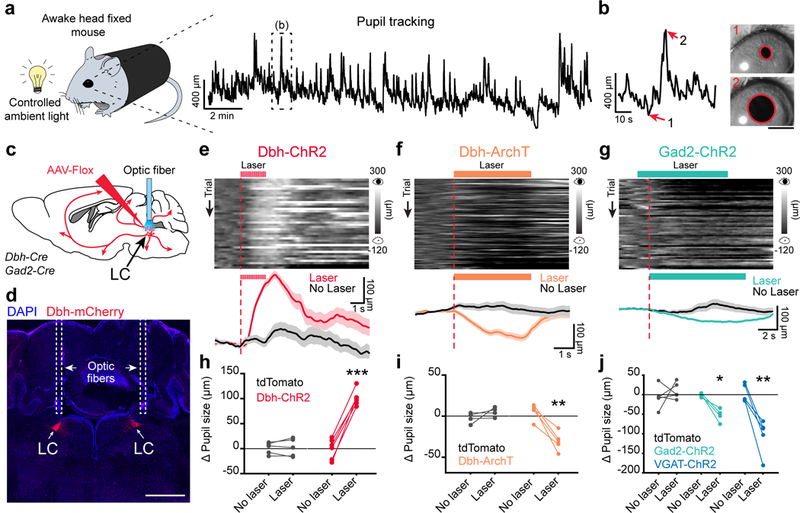
a. Methods to measure pupil size in awake head-fixed mice using a CMOS camera and infrared illumination. Right: pupil diameter for an example 20-minute session. Boxed area is expanded in (b). b. Example images of pupil tracking for constricted (1) and dilated epochs (2). Scale bar: 1 mm. c. Methods for optogenetics manipulation of LC-NA and LC-GABA neurons using Cre-dependent viruses, Dbh- and Gad2-Cre mice and fiber optic implantation. d. Coronal section of the LC showing ChR2-mCherry expression and optic fiber tracks in a Dbh-Cre mice. Scale bar: 1 mm. e – g. Effect of activating (Dbh-ChR2) or silencing (Dbh-ArchT) LC-NA neurons as well as activating LC-GABA neurons (Gad2-ChR2) on pupil size in example mice. Top panels – Temporal raster plots of pupil size aligned to optical activation onset (vertical red line). Bottom panels – session averages for trials with and without laser. Data are presented as mean ± s.e.m. h - j – Effect of activating or silencing LC-NA neurons as well as activating LC-GABA neurons on pupil size. Gray lines represent animals where only tdTomato was expressed, but similar optical activation patterns and intensities were used. N = 6, 5, 4 and 5 mice for Dbh-ChR2, ArchT, Gad2-ChR2 and VGAT-ChR2 conditions respectively. N = 5 mice for tdTomato controls. Paired two-tailed t-test with p = 0.822 (t4 = 0.240) and ***p = 0.00001 (t5 =14.553) for tdTomato and ChR2 conditions in (h); p = 0.249 (t3 = 1.426) and **p = 0.0045 (t4 = −5.768) for tdTomato and ArchT conditions in (i); p = 0.4747 (t4 = 0.788), **p = 0.0054 (t4 = −5.494) and *p = 0.0153 (t3 = −5.010) for tdTomato, VGAT-ChR2 and Gad2-ChR2 conditions in (j).
To demonstrate causality between NA activity and pupil size, we injected a Flox-ChR2-mCherry virus bilaterally in the LC of Dbh-Cre mice (Fig. 2c), implanted optic fibers connected to a solid-state laser light source in the LC of both hemispheres (Fig. 2c, d), and applied pulsed blue light to mimic the observed increase in LC-NA activity preceding pupil dilation, as recorded in photo-tagged LC-NA units (Supplementary Fig. 2g, h). As hypothesized from NA axonal imaging, we observed a robust increase in pupil size after light activation of ChR2-expressing NA neurons (Fig. 2e, h). Pupil dilation was dependent on baseline pupil size, since activating LC-NA neurons in periods of already increased arousal produced smaller increases in pupil size, thus explaining the observed trial to trial variability (Supplementary Fig. 4a, b). Even moderate activation of LC-NA neurons (pulse duration of 0.1 s at a frequency of 5 Hz) was sufficient to dilate the pupil, and this dilation increased with higher intensities of light activation (Supplementary Fig. 4c, d). We did not observe pupil dilation in control experiments using similar patterns of light activation in Dbh-Cre mice expressing only a fluorescent marker (Flex-tdTomato) (Fig. 2h).
Subsequently, we optically silenced LC-NA neurons to examine if their activity was necessary for pupil dilation. After injection of Flex-ArchT-mCherry virus in Dbh-Cre mice and implantation of optic fibers, we silenced spontaneous LC-NA activity with green light, and observed pupil constriction (Fig. 2f, i). While all Dbh-ArchT mice showed pupil constriction with light, this constriction was not observed in mice expressing the fluorophore alone (Fig. 2i). These results demonstrate that LC-NA activity is sufficient to alter pupil dilation and that a change in NA activity is reliably reflected in pupil size.
Our anatomical and slice electrophysiological results suggested that local LC-GABA neurons are positioned to inhibit LC-NA neurons. We tested this hypothesis by implanting an optic fiber over the LC in Gad2-Cre mice locally injected with Flox-ChR2 or VGAT-YFP-ChR2, where all inhibitory neurons express ChR229. Light activation produced a decrease in pupil size following focal stimulation, which was not observed in control animals (Fig 2g, j). Overall, these results demonstrate that local GABA neurons in the LC control the activity of NA neurons, and arousal level as reflected in pupil size.
Inputs to LC-GABA and LC-NA neurons
To further understand the function of LC-GABA neurons with respect to LC-NA neurons, we targeted a modified rabies virus (RV) separately to each subpopulation to examine the anatomical sources of their presynaptic inputs30. We injected two Cre dependent (AAV) “helper” viruses to express the avian-specific retroviral receptor (TVA) and the rabies glycoprotein in Gad2-Cre or Dbh-Cre mice. Three weeks after the first injection, we injected the modified RV (rabies-deleted-glycoprotein-mCherry + EnvA) that only infected cells expressing TVA and spread only from cells expressing the glycoprotein (Fig. 3a). We waited an additional week and examined coronal sections of the entire brain. Both experiments showed neurons positive for mCherry in a wide range of locations (Fig. 3b, c; and Supplementary Table 1). We counted input neurons and assigned them to different brain regions. To visualize the projection patterns to LC-GABA and LC-NA neurons, we created a map of the relative contribution of each brain region to the two subpopulations (Fig. 3d, e: showing regions with > 0.5% total inputs). Brain regions contacting LC-NA neurons directly were similar to those reported previously, consisting of diverse structures related to sensory, cognitive, autonomic and motor functions14,31,32 (Fig. 3d). Nearly all of the approximately 50 regions providing input to LC-NA neurons also projected to LC-GABA neurons (Supplementary Table 1; Fig. 3e). However, there were variations in the extent of projections; mapping the differential contribution of input regions to the two LC neuron subtypes showed 7 core regions projecting preferentially to LC-GABA versus 2 regions to LC-NA neurons (Fig. 3f). Thus, these findings demonstrate that the two neuronal subtypes in the LC receive largely similar inputs whereas a few regions provide preferential input to one neuronal subtype or another.
Figure 3: LC-NA and LC-GABA neurons receive inputs from similar as well as different sources.
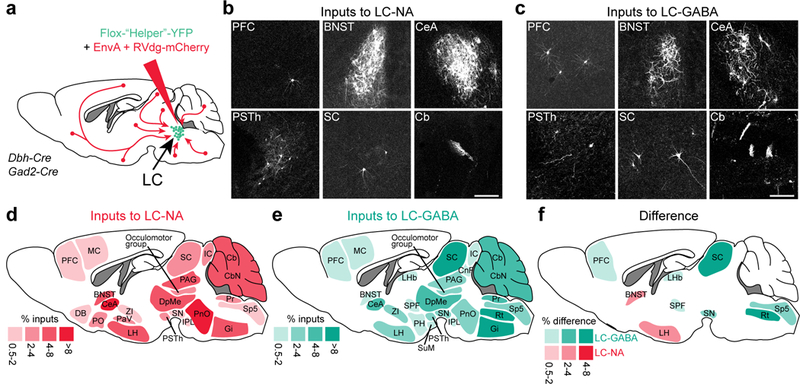
a. Schematic for targeting pseudo-rabies virus to LC-NA and LC-GABA subpopulation. b,c. Transynaptically labelled neurons in different brain regions following injection of targeted pseudo-rabies virus in LC of Dbh-Cre or Gad2-Cre mice. Repeated in N = 8 and 4 mice for LC-NA and GABA respectively. Scale bars: 200 μm. d,e. Map of brain regions providing the largest fraction of inputs to LC-NA and LC-GABA neurons. Regions providing less than 0.5% of total inputs are not displayed. N = 8 and 4 mice for LC-NA and LC-GABA respectively. f. Map of the difference in inputs to LC-NA and LC-GABA neurons. Only regions showing significant difference are displayed (p < 0.05 using paired t-test; see Supplementary Table 1). BNST: bed nucleus of the stria terminalis; Cb: cerebellum; CbN : cerebellar nuclei; CeA: central amygdala; CnF: cuneiform nucleus; DB: diagonal band; DpMe: deep mesencephalic nucleus; Gi: gigantocellular nucleus; IC: inferior colliculus; IPL: interpeduncular nucleus; LH: lateral hypothalamus; LHb: lateral habenular nucleus; MC: motor cortex; PAG: periaqueductal gray; PaV: paraventricular nucleus; PFC: prefrontal cortex; PH: posterior hypothalamus; PnO: pontine nucleus; PO: preoptic nucleus; Pr: prepositus nucleus; PSTh: parasubthalamic nucleus; Rt: reticular nucleus; SC: superior colliculus; SN: substantia nigra; Sp5: spinal trigeminal tract; SPF subparafascicular thalamic nucleus; SuM: supramammillary nucleus; ZI: zona incerta.
Two types of arousal-related neuronal activity in the LC
To understand how LC-NA and LC-GABA neurons integrate their inputs to influence arousal levels in the brain, we recorded from Dbh and Gad2 expressing neurons identified with optogenetics (photo-tagging). Dbh-Cre or Gad2-Cre mice were injected with a Flox-ChR2 virus, and light activated neurons were recorded with a 16-channel silicon probe equipped with an optic fiber connected to a laser source (Fig. 4a). The probe was coated with DiI crystals to verify the recording location, together with immunohistochemistry against TH to identify the LC, after each successful session (Fig. 4b). Using this multichannel probe and the use of automated spike sorting, we isolated single units from our extracellular recordings (Fig. 4c). Brief laser pulses (< 5 ms) were applied and units responding to laser pulses with a short delay (< 10 ms) were identified as Dbh-ChR2 or Gad2-ChR2 expressing (Fig. 4d, e). Of 433 units recorded in 21 sessions from 13 mice, 19 Dbh-ChR2 and 18 Gad2-ChR2 units were photo-tagged using this method (Fig. 4f-j). The delay and jitter of light-elicited spikes were similar for the Dbh- and Gad2-ChR2 conditions (Fig. 4f-g). The Gad2 units showed higher levels of spontaneous activity and had shorter spike durations than Dbh units (Fig. 4h-j).
Figure 4: Extracellular spike recordings in LC of identified NA and GABA units.
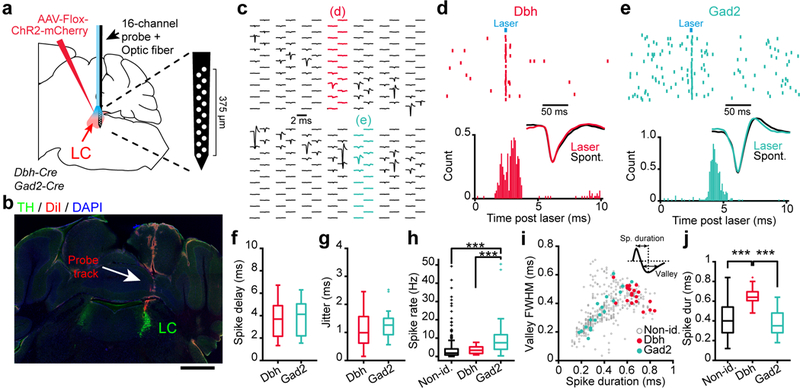
a. Methods for photo-tagging Dbh- or Gad2-ChR2 units using a 16-channel silicone probe equipped with a 100 μm optic fiber. b. Probe track (DiI coating) verified with immunohistochemistry staining for TH to identify LC. Scale bar: 1 mm. c. Examples of isolated units and their respective probe location during two sessions (Top – Dbh-ChR2; Bottom – Gad2-ChR2). d, e. Top – Spike rasters from two units responding to 5 ms laser pulses recorded in Dbh-ChR2 (d) or Gad2-ChR2 (e) expressing mice. Bottom – Distribution of delay from laser onset. Inset – Comparison of spontaneous versus laser-evoked spike waveforms. f, g. Average spike delay and jitter following light activation of Dbh-ChR2 and Gad2-ChR2 neurons. p = 0.763 (t35 = −0.304) for (f), and p = 0.379 (t35 = −0.8909) for (g) using two-tailed unpaired t-test. h. Comparison of spontaneous spike rate for all three types of units (one-way ANOVA, F2,430= 15.88, p = 10−7 using Tukey post-hoc test). i. Scatter plot of spike duration and valley full width at half maximum values (see inset for definition) for non-identified, Dbh- and Gad2-ChR2 units. j. Comparison of spike duration for all three types of units (one-way ANOVA, F2,430= 19.57, p = 10−9 using Tukey post-hoc test). n = 19, 18 and 396 Dbh-ChR2, Gad2-ChR2 and non-identified units from 13 mice. Box plots indicate the median (center line), first quartiles (box edges), minimum/maximum values (whiskers) and outliers (+).
We next examined the relationship of Dbh- and Gad2-ChR2 photo-tagged units to pupil size (Fig. 5a). As expected from the axonal calcium imaging data from LC-NA neurons (Supplementary Fig. 2a-f) and from responses of photo-tagged LC-NA units (Supplementary Fig. 2g, h), pupil dilation was associated with an increase in activity of photo-tagged Dbh-ChR2 units. In contrast, the activity of Gad2-ChR2 units was more heterogeneous, with individual units showing negative or positive correlation with pupil size (Fig. 5a). The Pearson correlation coefficient between firing rates of LC units and pupil size (Fig. 5b) showed that all Dbh units correlated positively with pupil size (Fig. 5b, c). This matched the correlation recorded with two-photon calcium imaging of LC-NA axons in the cortex (Supplementary Fig. 2c) On the other hand, Gad2 units correlated both positively (Gad2+) and negatively (Gad2-) with pupil size (61% and 33% of Gad2 units respectively; Fig. 5c). The activity of Gad2- neurons globally increased during periods of low pupil constriction while Gad2+ and Dbh neurons increased their activity during pupil dilation (Fig. 5d).
Figure 5: Identified LC-GABA units display two types of activity with respect to pupil size.
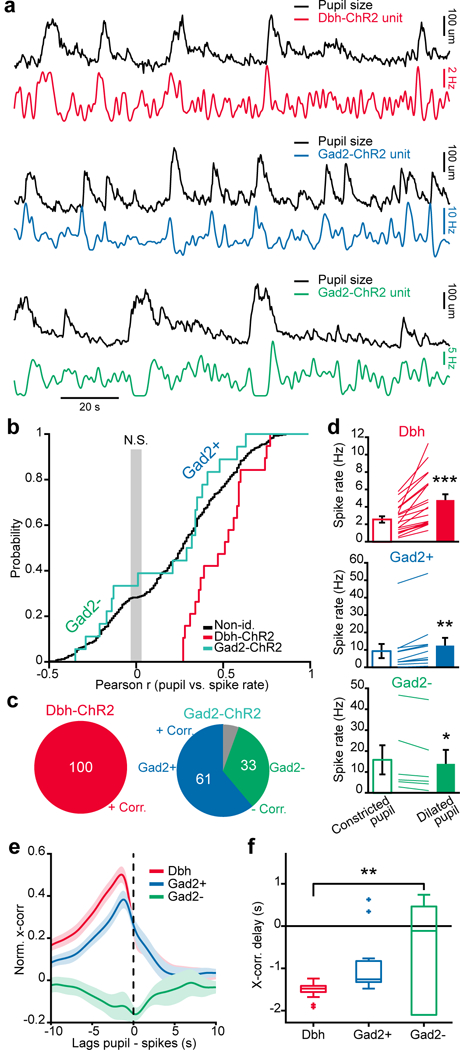
a. Examples of simultaneous recordings of pupil size and photo-tagged Dbh- (upper panel) or Gad2-ChR2 (middle and lower panels) LC units. Note the Gad2 unit in the middle panel is positively correlated (Gad2+) while that in the lower panel is negatively correlated with pupil size (Gad2-). b. Cumulative probability distribution of the Pearson correlation coefficient of LC unit spike rate with pupil size for all units. The gray area marks non-significant correlations, p < 0.05. n = 19, 18 and 396 Dbh-ChR2, Gad2-ChR2 and non-identified units from 13 mice. c. Percentage of Dbh- and Gad2-ChR2 units that are positively or negatively correlated with pupil size. Proportions were significantly different for the two groups (19/19 versus 11/18 in the Dbh and Gad2 groups; χ2: 9.11; p = 0.0025). The gray portion indicates non-significant correlations, p < 0.05. d. Average spike rate for different type of units during periods of constricted versus dilated pupil. Each line represents a single unit. Two-tailed paired t-test: ***p = 0.0005 (t18 = 5.36) for Dbh; **p = 0.0014 (t10 = 4.38) for Gad2+; *p = 0.0208 (t5 = −3.33) for Gad2-. e, f. Normalized cross-correlation and delay of pupil size to LC firing activity for the classes of units sorted in (b, c). One-way ANOVA, F2,33 = 6.33, **p = 0.0088 using Tukey post-hoc test. Box plots indicate the median (center line), first quartiles (box edges), minimum/maximum values (whiskers) and outliers (+). Error bars in (d, e) indicates s.e.m. In (d-f) n = 19, 11, and 6 Dbh, Gad2+ and Gad2- units taken from 13 mice.
We also examined the relationship of 396 units, which were recorded in the same mice but were not photo-tagged, to pupil dilation (Fig. 5b). We classified these units as fast-spiking (FS) or regular-spiking (RS) based on their spike shape, and extracted two clusters by fitting a gaussian mixture model to the data (Supplementary Fig. 5a). The FS and RS clusters overlapped the spikes recorded in Gad2 and Dbh mice (11/18 and 17/19 overlap between Gad2 and FS, and Dbh and RS neurons respectively). Spike shapes of some Gad2 neurons were not well separated from Dbh neurons, demonstrating the difficulty of cell-type identification based on spike shape alone33. Still, as for photo-tagged Dbh and Gad2 units, RS units were positively correlated with pupil size whereas FS units were both positively (FS+) and negatively (FS-) correlated in similar proportion to Gad2+ and Gad2- neurons (Supplementary Fig. 5b-e), indicating a robust classification of these neuron types based on their pupillary effects.
We examined more closely the effect of the different types of units on pupil dilation by calculating the cross correlation between spike rate and pupil size (Fig. 5e). The peak in cross-correlation for Dbh and Gad2+ units overlapped, whereas the Gad2- units showed a broad trough in cross-correlation (Fig. 5e, f; see also Supplementary Fig5 f,g). To get a better understanding of the timing of different LC units, we aligned their activity to dilation events (Supplementary Fig. 6a). Dbh and Gad2+ units showed a significant increase in their activity preceding dilation, whereas Gad2- units showed no significant modulation in activity during dilation (Supplementary Fig. 6b,c). As a net effect, Gad2+ and Dbh activity correlated tightly during dilation and arousal, whereas Gad2- activity was broadly anti-correlated to the rest of LC activity. These two types of Gad2 units did not differ in their spontaneous firing rate, their waveform duration or their light evoked response (Supplementary Fig. 7). Thus, Gad2+ and Gad2- units do not necessarily represent separate subpopulations of interneurons based on their firing properties, but rather subpopulations that differ in the inputs they receive. Hence, brain regions targeting similarly LC-GABA and LC-NA neurons (e.g. LH, CeA, DpMe, PnO or Gi) would be the inputs to Gad2+ (Fig. 3 d,e), whereas Gad2- neurons are wired more toward regions that differentially target LC-GABA neurons (e.g. PFC, LHb, SPF, SN, deep layers of SC or some regions of the medulla) (Fig. 3f).
Overall, the two types of activity recorded from photo-tagged Gad2-ChR2 neurons are consistent with the findings of tracing experiments demonstrating similar as well as preferential inputs to LC-NA and LC-GABA neurons (Fig. 3), and they lead to specific hypotheses about their role. In one case, regions providing similar inputs may drive both LC-GABA and LC-NA neurons leading to correlated activity in these neurons, and inhibition could act as a feedforward gain control mechanism for arousal (similar to that seen in the cortex with thalamic inputs34, 35). In the other case, LC-GABA neurons that are broadly anti-correlated to arousal may be driven by a different input source than LC-NA neurons, allowing for independent positive and negative control of arousal.
Coincident inputs to LC-GABA neurons provide gain control of LC-NA neurons
Our anatomical and electrophysiological results imply that a subset of LC-GABA neurons receives coincident inputs with LC-NA neurons. This suggests that feedforward inhibition is present at the level of LC and that local GABA neurons provide gain control to LC-NA neurons. We assessed this hypothesis by presenting auditory tone pips that varied randomly in frequency and amplitude. Tone pips activate LC neurons15, 18, 19, potentially by direct inputs from the inferior colliculus, the reticular formation of the pons, and the gigantocellular nucleus of the medulla; all these regions provide similar magnitude of input to LC-NA and LC-GABA neurons, as revealed by our anatomical tracer experiments (Fig. 3d-f). Recordings from GCaMP6s-expressing NA axons in the cortex confirmed that LC-NA neurons respond to tone pips (Supplementary Fig. 8a, b). Unit recordings of Dbh- and Gad2-ChR2 neurons (Fig. 6a, b) showed that both responded to tone pips (Fig. 6c). The delay of peak response from the onset of tone pip was 80 ± 14 ms and 51 ± 14 ms for the recorded population of Dbh and Gad2 units respectively (n = 14 and 7 tone responsive units, p = 0.2, two-tailed unpaired t-test, t19 = 1.3272). These data suggest that auditory stimuli activate principally coincident inputs to LC-GABA and LC-NA neurons.
Figure 6: LC-GABA neurons control the gain of LC-NA mediated pupil responses.
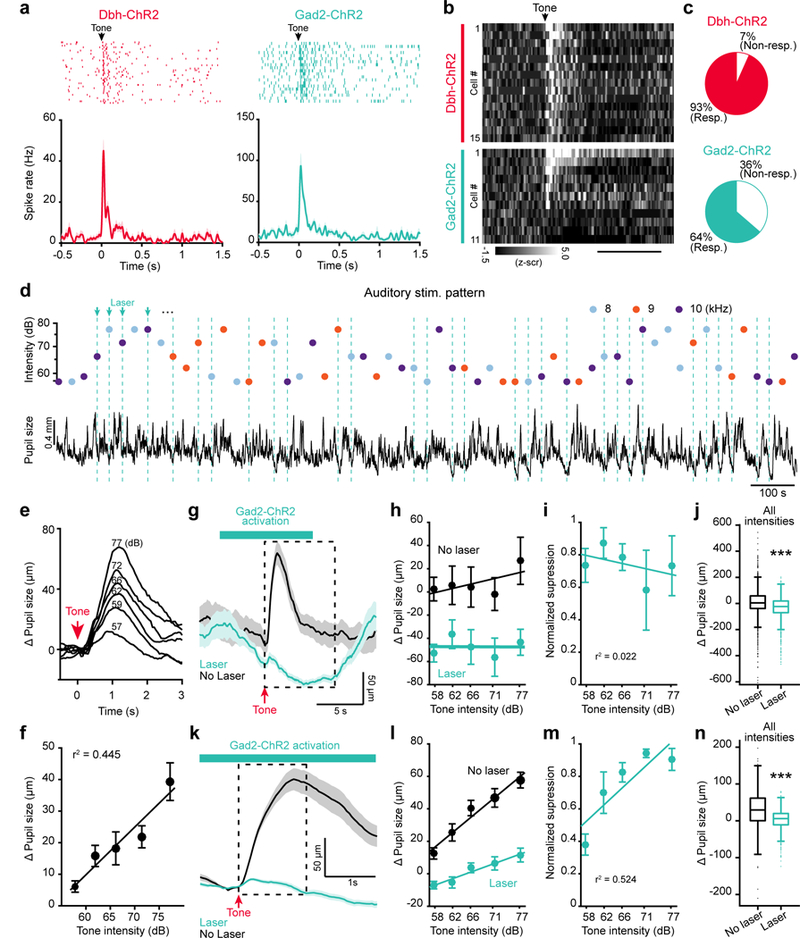
a. Tone-pips presented during the recording of LC photo-tagged units in Dbh- (left) and Gad2-ChR2 (right) expressing units. Top panels – Spike raster plot aligned to tone onset. Bottom panels – Session spike rate average. b. Raster plots of average responses to tone pips sorted between Dbh and Gad2 units. n = 15 and 11 Dbh and Gad2 units respectively. Scale bar: 1 s. c. Percentage of responsive neurons for the two types of units. Proportions were not significantly different for the two groups (14/15 versus 7/11 in the Dbh and Gad2 groups; χ2: 3.60; p = 0.058). d. Top – Example of an auditory stimulus pattern used to test the effect of LC-GABA activation on LC-NA responses. Bottom – Corresponding pupil size measurement. e. Average of pupil size response to tones of different intensities for an example mouse. Each trace is an average of 32 to 70 trials depending on intensities. f. Change in pupil response amplitude with tone intensity (data for N=8 mice recorded in the normal condition, without laser activation. p = 0.00008, one-way ANOVA: F4,35 = 8.27). g. Average traces for 77 dB tones with and without laser activation of LC-GABA neurons for one mouse. The dashed box delineates the averaging window use in (h-j). h. Pupil size at different tone intensities, with and without laser activation, for the example mouse in (g). i. Normalized suppression of tonic pupil response due to activation of LC-GABA neurons. (p = 0.763 using one-way ANOVA, F4,15 = 0.46). j. Comparison of laser to no laser trials for all trials regardless of tone intensity or frequency (***p = 10−29 using two-tailed unpaired t-test, t2973 = 11.37). k. Average traces for the same mouse and condition as in (g), showing the phasic post-tone-onset response. The dashed box delineates the averaging window used in (l-n). l. Pupil size at different tone intensities, with and without laser activation. m. Normalized suppression of phasic pupil response to tone intensity due to activation of LC-GABA neurons (p = 0.00075 using one-way ANOVA, F4,15 = 8.75). n. Comparison of laser to no laser trials for all trials regardless of tone intensity or frequency (***p = 10−89 using two-tailed unpaired t-test, t2973 = 20.7995). For panels (j) and (n) box plots indicate the median (center line), first quartiles (box edges), minimum/maximum values (whiskers) and outliers (+), n = 1494 and 1481 laser off and laser on trials respectively. For all other panels, data are displayed as mean ± s.e.m. N = 4 mice in (i), (j), (m), and (n).
Since tone pips evoked responses in both type of LC neurons, we used these stimuli to assess the possible modulation of LC-NA responses by LC-GABA neurons. We presented a random and sparse sequence of auditory stimuli of different frequencies and intensities to a group of mice, while recording pupil diameter (Fig. 6d). Simultaneous recording of pupil diameter and LC-NA activity showed that increase in pupil size followed the increase in LC-NA activity to auditory stimuli (Supplementary Fig. 8b). Silencing NA neurons prevented this pupil dilation response (Supplementary Fig. 8c-d), demonstrating that pupil size can be used to track NA activation with these stimuli. The pupil dilation response to auditory stimuli increased with the intensity of auditory tone independent of tone frequency (Fig. 6e, f and Supplementary Fig. 9a-c). Then, we used Gad2-Cre mice injected in the LC with flox-ChR2, with implanted optic fiber, to examine the role of LC-GABA activity on LC-NA responses involving coincident inputs. The trial averaged traces with or without laser activation demonstrated that activating LC-GABA neurons produced a constricting effect on pupil size, while mild pupil dilation was still detectable after the tone presentation (Fig. 6g). Similar to activating LC-GABA neurons during spontaneous fluctuations of arousal (Fig. 2g,j), we observed a uniform sustained (spanning several secs) reduction of pupil size across all sound intensities (Fig. 6g-j). To examine the effect of activating LC-GABA neurons on the transient response of LC-NA neurons to sensory stimuli, we removed the tonic effect of LC-GABA activation. We normalized the response for each tone to a 0.5 sec baseline period preceding the tone onset when the laser was already on, and averaged the pupil response for 1.5 sec after tone pips (Fig. 6k; Supplementary Fig. 9a). Doing so, we observed that increasing the activity of LC-GABA neurons had a divisive effect on the tone intensity-pupil dilation relationship, as seen by a reduction of slope (or gain) of the pupil size change vs stimulus intensity line (Fig. 6l). This led to enhanced normalized suppression during presentation of tones of higher intensities independent of tone frequency (Fig. 6m,n; Supplementary Fig. 9d), similar to other examples of coincident feedforward inhibition34,35. We also tested the effect of activating LC-GABA neurons on the pupil gain response in VGAT-ChR2 transgenic mice and obtained similar results (Supplementary Fig. 10). Altogether, these results demonstrate that activating LC-GABA neurons alone sets the baseline tone of pupil size, and that coincident activation regulates the gain of LC-NA mediated arousal.
Non-coincident inputs to LC-GABA neurons non-specifically suppress LC-NA neurons
The results from our retrograde labelling experiments suggested that along with similar, coincident, activation of LC-NA and LC-GABA neurons, some input regions also provide preferential, potentially non-coincident, drive to LC-GABA neurons. Moreover, our electrophysiological data showed that LC-GABA neurons displayed two types of activity, where the activity of Gad2+ (and FS+) neurons was correlated with LC-NA neurons while the activity of Gad2- (and FS-) neurons was broadly anti-correlated with LC-NA activity. We thus wished to examine if activation of non-coincident inputs to LC-GABA neurons would non-specifically suppress LC-NA activity, and hence regulate arousal tone.
We chose to target inputs from the prefrontal cortex (PFC), as our anatomical data supported the existence of a preferential drive to LC-GABA neurons originating from this region (Fig. 3d-f and Supplementary Fig. 11a). We injected a virus expressing ChR2-mCherry, under the CaMKII promoter to target excitatory neurons, in the orbitofrontal part of the prefrontal cortex and implanted an optic fiber above the LC to activate PFC axons (Fig. 7a and Supplementary Fig. 11b). Coronal sections of the LC demonstrated the existence of PFC axons in the LC, confirming our results with monosynaptic retrograde labelling (Fig. 7b, c). Most of the PFC axons projected to the anterior and medial part of the LC, where the density of GABA neurons peaks (Fig. 1e; Fig. 7c). We activated PFC axons to the LC and indeed recorded significant sustained pupil constriction (lasting several secs) following laser activation (Fig. 7d). This constriction of pupil size was independent of tone intensity (Fig. 7e-g). Along with activating non-coincident inputs by PFC axonal activation, we activated coincident inputs to LC-NA and LC-GABA neurons with randomly varying auditory tone pips and recorded a transient increase in pupil dilation (Fig. 7h). However, analyzing the tone-induced pupil dilation with and without laser activation revealed no effect of PFC activation on the gain of the transient pupil response (Fig. 7i-k). In contrast to the divisive effect of LC-GABA activation on pupil responses (Fig. 6m), the major effect of PFC activation was a non-specific reduction in pupil size (Fig. 7g), and hence a net decrease in arousal. Overall, these results demonstrate that non-coincident inputs such as from the PFC control the level or tone of LC-NA mediated arousal but not the gain, via their preferential targeting of LC-GABA neurons.
Figure 7: Projections from PFC to LC-GABA neurons control LC-NA mediated pupil tone.
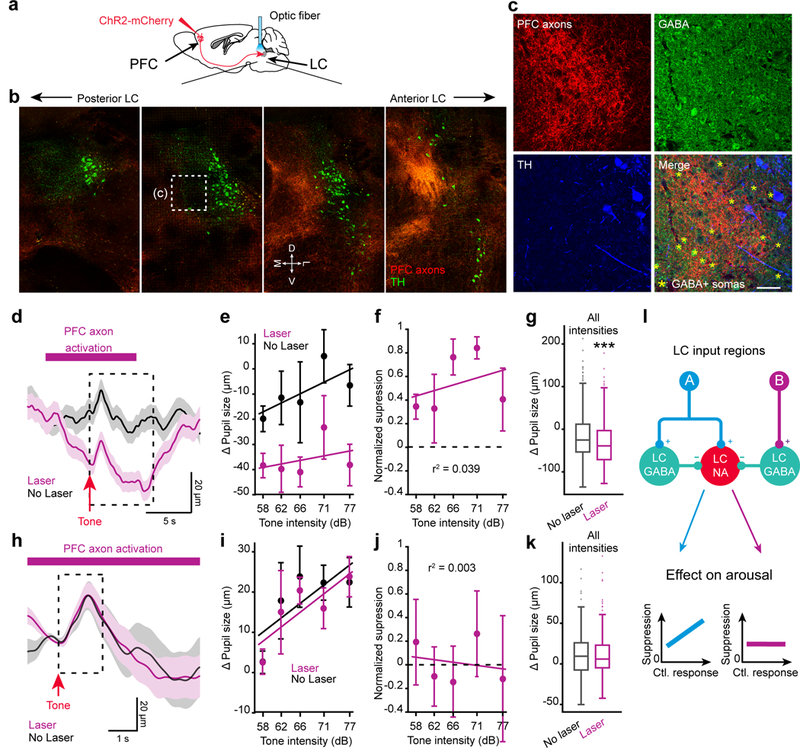
a. Methodology used to target PFC projections to LC. b. Coronal sections from posterior to anterior LC showing PFC axons in LC and TH staining. M: medial, D: dorsal, L: lateral, and V: ventral directions. Scale bar: 200 μm. c. Confocal images of the region highlighted in (b). Asterisks indicate GABA+ somata. Scale bar: 50 μm. Experiments in (b,c) were repeated in 3 mice with similar results. d. Pupil size in response to tone pips with or without PFC axon activation. Average of all trials for one mouse. The dashed box delineates the averaging window use in (e-g). e. Pupil size at different tone intensities, with and without laser activation, for the example mouse in (d). f. Normalized suppression of pupil response due to activation of PFC axons in LC (p = 0.3921 using one-way ANOVA, F4,10 = 1.14). g. Comparison of laser to no laser trials for all trials regardless of tone intensity or frequency (***p = 0.00004 using two-tailed unpaired t-test, t577 = 4.14). h. Average traces for the same mouse and condition as in (d), showing the phasic post-tone onset response. The dashed box delineates the averaging window used in (i-k). i. Pupil size at different tone intensities, with and without laser activation. j. Normalized suppression of phasic pupil response to tone intensity due to activation of LC-GABA neurons (p = 0.9493 using one-way ANOVA, F4,10 = 0.17). k. Comparison of laser to no laser trials for all trials regardless of tone intensity or frequency (p = 0.9315 using two-tailed unpaired t-test, t577 = 0.086). l – Proposed model of interaction between LC inputs and LC-GABA/LC-NA neurons. Excitatory coincident inputs from region A activate both LC-GABA and LC-NA neurons simultaneously. LC-GABA inhibition scales LC-NA activity divisively, thus controlling the gain of response. Non-coincident inputs from region B target LC-GABA neurons but not LC-NA neurons (as illustrated here), thus regulating overall NA tone without affecting the response gain. For panels (g) and (k) box plots indicate the median (center line), first quartiles (box edges), minimum/maximum values (whiskers) and outliers (+), n = 249 and 280 laser off and laser on trials respectively. For all other panels, data are displayed as mean ± s.e.m. N = 3 mice in (f), (g), (j) and (k).
Discussion
We demonstrate anatomically and functionally the existence of a local population of GABA neurons in the LC, which inhibits NA activity and thus controls arousal level in the brain, as reflected in pupil size. The pattern of LC afferents is mostly coincident to LC-NA and LC-GABA neurons (Fig. 7l), as shown by tracing experiments and correlated neuronal activity among the two subpopulations. This input pattern supports a role for local LC inhibition in controlling the gain of LC responses. On the other hand, some functionally distinct input regions exert stronger influence on one LC subpopulation over the other, suggesting that the general NA tone and accompanying arousal level can be set by these inputs (Fig. 7l). An example of this second projection type is the PFC that projects preferentially to the LC-GABA sub-region and alters the tone of NA activity without altering its response gain.
Coincident and non-coincident inputs to LC-GABA neurons impact LC-NA modes of activity on many levels. By regulating the response gain of NA activity to novel stimuli, coincident inputs enable phasic LC activity to be maintained within a certain range, potentially restricting NA activity to an optimal level required for cognitive processing12,23. By preferentially targeting LC-GABA neurons, non-coincident inputs set thresholds for NA activation and enable modulation of tonic LC activity during different contexts. For example, PFC inputs involved in utility assessment can gate incoming sensory signals to convey the presence or absence of novelty via LC responses1,36. Non-coincident drive to LC-GABA neurons can also impact attentional shifts by interfering with the ability of LC-NA neurons to respond to novel sensory stimuli. Indeed, recordings in the LC of behaving mice have shown adaptation of LC responses to novelty7,20,37 and a switch of their response to different components of fear conditioning behavior17. Alterations in inhibition provided by the regions preferentially driving LC-GABA neurons can explain fluctuations in tonic LC activity observed within sessions in animals performing a visual discrimination task22, or during the sleep-wake cycle21,38.
Our results show that LC-GABA neurons are an important source of inhibition for LC-NA neurons. However, we do not exclude other types of inhibitory mechanisms controlling LC activity. First, inhibition in the LC can originate from distal sources. Electrical stimulation of pontine and medulla nucleus such as the prepositus nucleus, pontine reticular nucleus and gigantocellular reticular nucleus yield significant reduction in the firing rate of LC neurons39,40. However, these studies never confirmed if inhibition arose from direct inhibitory projection from these nuclei, or from disynaptic pathways such as from the preferential activation of local GABA neurons. In addition, retrograde labeling studies have shown that a significant GABAergic neuronal population from the posterior lateral hypothalamic area and the central amygdala projects directly to the LC region, but we do not know the function of these projections in vivo41. Second, inhibition in the LC can arise from NA mediated inhibition. A brief period of inhibition following the phasic response of LC neurons to sensory stimuli15 has been attributed, in part, to NA-mediated collateral inhibition, since blocking alpha-2 noradrenergic receptors moderately suppresses it39,42. However, other mechanisms such as feedforward and feedback inhibition from neighboring LC-GABA neurons could also explained this post-activation inhibition. Finally, inhibition in the LC can originate from presynaptic release modulation. An example of this is κ-opiate receptors that colocalize with glutamate- and corticotropin releasing factor- positive axons in the LC43; activation of these receptors reduces the response of LC neurons to sensory stimuli43.
The effect of PFC activation on LC activity has remained controversial. Pharmacologically silencing the prefrontal cortex in rats increases LC activity44, while direct activation of the prefrontal cortex tends to also increase LC activity44,45. It has been an open question whether the PFC sends direct descending excitatory or inhibitory projections to LC, and whether an inhibitory influence arises from an indirect pathway. Our monosynaptic tracing results (Fig 3) reconcile these studies, since both LC-NA and LC-GABA subpopulations receive direct inputs from the PFC, albeit with a significant preference for LC-GABA neurons. In line with the tracing experiments, we find in some animals a brief period of pupil dilation at the onset of laser activation, reflecting direct inputs to LC-NA neurons (Supplementary Fig. 12). However, an extended period of activation of PFC axons in the LC shows a net pupil constriction effect, consistent with a greater influence on LC-GABA than LC-NA neurons.
Early reports using cholera-toxin B retrograde tracing found a limited number of regions that target the LC region31,32, which were mostly concentrated in the region adjacent to LC (e.g. parabrachial nuclei and Gi), mesencephalic areas (PAG and DpMe), and some nuclei of the hypothalamus (e.g. PO, LH). Notably, these studies found almost no retrogradely labeled neurons in the cortex, CeA, BNST, superior colliculus, and cerebellum, as reported by us here and another recent report using similar techniques to trace afferent projections to LC (which used Dbh-Cre mice and Cre-dependent monosynaptic modified rabies virus)14. It should be noted that larger injections of cholera-toxin B in the LC yielded similar results as ours32, showing inputs from CeA, BNST, and from cortical areas. We and others14 show that inputs also exist from the cerebellum and superior colliculus. These findings are consistent with the observation that rabies-mediated trans-synaptic tracing reveals direct synaptic connections14,46, and provides a more sensitive assay of inputs to LC-NA and LC-GABA circuits than what was reported in the literature with earlier tracers.
Our results highlight the causal relationship between LC-NA activity and pupil dilation. The link between neuronal activity in the LC and pupil size had been previously established in different species1,5,6; however previous studies had not shown that specifically activating or silencing LC-NA neurons increases or decreases pupil size respectively. LC-NA neurons could control pupil dilation by direct inputs to parasympathetic and sympathetic preganglionic neurons47,48. Importantly, our results demonstrate that LC-GABA neurons play an essential role in regulating LC-NA activity. In addition to maintaining the dynamic range of LC-NA responses via coincident feedforward inhibition, non-coincident inhibition driven by pathways such as from PFC to LC regulates the global tone of LC activity, and can potentially switch the mode of LC activity in a manner that is dependent on the internal state of the brain.
Methods
Animals
All procedures were approved by the Massachusetts Institute of Technology’s Animal Care and Use Committee and conformed to NIH guidelines. Adult mice (> 2 month old) from a C57BL/6J background were in this study. Male or female mice were randomly selected for each experiment. We used the following mouse lines for the specific expression of various viruses in noradrenergic, GABAergic, and cholinergic neurons: TH-Cre (B6.Cg-Tg(Th-cre)1Tmd/J, Jackson Laboratory), Dbh-Cre (B6.FVB(Cg)-Tg(Dbh-cre)KH212Gsat/Mmucd, MMRRC), Gad2-IRES-Cre (Gad2tm2(cre)Zjh/J, Jackson Laboratory). Optogenetic activation of LC GABAergic neurons (LC-GABA) was also done on VGAT-YFP-ChR2 mice (B6.Cg-Tg(Slc32a1-COP4*H134R/EYFP)8Gfng/J, Jackson Laboratory). Some experiments were carried out on C57Bl/6 wild-type (WT) mice.
Stereotactic surgeries
The preparation of animals was similar for all surgical procedures. They were performed under isoflurane anesthesia while maintaining body temperature at 37.5°C using an animal temperature controller (ATC2000, World Precision Instruments). After deep anesthesia was confirmed, mice were placed in a stereotaxic frame (51725D, Stoelting), scalp hairs were removed with hair-remover cream, the underlying skin was cleaned with 70% alcohol and betadine, and an incision was made in the scalp. The conjunctive tissue was removed by rubbing hydrogen peroxide on the skull. The skull was positioned such that the lambda and bregma marks were aligned on the anteroposterior and dorsoventral axes. For all surgeries, analgesic was given once before and for 3 days following surgery.
For viral injections, a small hole was drilled through the skull at the location of interest. We used the following coordinates (according to bregma – in mm): LC: −5 to −5.2 anteroposterior, ± 0.9 mediolateral, and 2.9 to 3 dorsoventral; orbitofrontal cortex (PFC): 2.6 anteroposterior, ±1.3 mediolateral, and 2.0 dorsoventral. Viruses were delivered with a thin glass pipette at a rate of 100–200 nL per min by an infuser system (QSI 53311, Stoelting). The following viruses (titer: ~10−12 virus molecules/mL) were injected for imaging and optogenetic experiments: Flex-GCaMP6s (AAV1.Syn.Flex.GCaMP6s.WPRE.SV40, U. Penn. Vector Core), Flox-ChR2-mCherry (AAV1.EF1.dflox.hChR2-(H134R).mCherry.WPRE.Hgh, U. Penn. Vector Core); Flex-ArchT-tdTomato (AAV2-CAG-Flex-ArchT-tdTomato, UNC Vector Core); Flex-tdTomato (AAV1-Flex-tdTomato, UNC Vector Core); and (AAV5/CamKIIalpha-hChR2-(H134R)-mCherry-WPRE-pA, UNC Vector Core). We delivered a volume of 400 to 500 nL per injection site in the LC of Dbh-Cre, and in the PFC of WT mice. For experiments using TH-Cre and Gad2-Cre mice, 200 nL injections were done in the LC to avoid infection of other areas. We confirmed that the virus infection was limited to the LC region for TH-Cre animals injected with Flex-GCamP6s, and did not spread to the VTA. After injection, the skin was sutured and we let mice recovered for 4–6 weeks after injection of virus for optimal opsin or calcium-indicator expression. For rabies monosynaptic tracing experiments, we injected rAAV1/SynP-DIO-sTpEpB helper virus in the LC of Dbh-Cre, Gad2-Cre or WT mice. 3 weeks after the first virus injection, we injected the EnVA-RΔG.mCherry (400–500 nL) in the same location.
200 μm diameter optic fibers were implanted with the following procedures. After anesthesia and animal preparation, the scalp was removed, the skulled was cleared of conjunctive tissue and the neck muscles were retracted from the interparietal and occipital plates. After careful alignment of the skull, the optic fiber cannula was held by a stereotaxic manipulator and inserted at different locations (see virus injections for coordinates) slightly on top of (~200 μm dorsoventral) the targeted region. Two-ferrule cannulas (TFC_200/245–0.37_4mm_TS2.0_FLT, Doric Lenses) were used for LC implantation. A single fiber optic cannula (CFM12L05, Thorlabs) was implanted in LC for activation of LC PFC axons. For LC PFC axon activation, the cannula was implanted using the following coordinates to target the anterior and medial part of LC: −4.5 to −4.8 anteroposterior, ± 0.5 mediolateral, and 2.5 dorsoventral. The cannulas was attached to the skull with dental cement (Teets Denture Material, or C&B Metabond, Parkell). To avoid light reflection and absorption, dental cement was mixed with black ink pigment (Black Iron Oxide #18727, Schmincke). A custom-designed head plate49 was also implanted at the end of the surgery for head fixation.
To perform LC single unit recording in awake head-fixed mice, we implanted a head plate 1–2 weeks before recording. We used a custom design stereotactic arm to align the head plate parallel to the median and dorsal line of the skull during implantation. The head plate was attached to the skull using dental cement. The exposed skull was protected using rapid curing silicone elastomer (Kwik-Cast, WPI) topped with a fine layer of dental cement.
Two-photon calcium imaging was done through a cranial window. Following virus injection of GCaMP6s in the LC of TH-Cre or Dbh-Cre mice, we drilled a 3 mm circular window centered over the anterior part of V1 (~ 3.5 mm posterior and ~ 2 mm lateral to bregma) or the medial prefrontal cortex (~2 mm anterior to bregma and centered on the midline). A 3 mm centered on a 5 mm coverslip (CS-5R and CS-3R, Warner Instruments), and glued together with UV adhesive (NOA 61 UV adhesive, Norland Products) was positioned over the craniotomy and attached to the skull using dental cement (C&B Metabond, Parkell). A head plate was also attached to the skull for head fixation.
Pupil and body movement monitoring
After fixing the mouse head using a previously implanted head plate, a high resolution CMOS Camera (DCC1545M, Thorlabs) camera equipped with a 1.0X telecentric lens (58–430, Edmund Optics) was pointed at either the left or right eye depending on the experimental set up. 780 nm infrared illumination was provided by a LED array light source (LIU780A, Thorlabs). Illumination was done at an angle of ~60° for the corneal reflection spot to be cleared of pupil visualization. Video acquisition of eye images (240 × 184 pixels) was performed at 20 Hz by a custom-made MATLAB script. The ambient illumination was controlled by a 7” monitor (700YV, Xenarc Direct) placed 8 cm in front of the mouse and displayed a full field gray stimulus at an illuminance of ~57 Lx (#403125, Extech Instruments). This level of ambient illumination was sufficient to keep pupil constricted within the space between the two eyelids. In all experiments, a master computer, controlling the visual and auditory stimuli, triggered pupil camera acquisition, as well as 2-photon imaging, optogenetic manipulations, or extracellular electrophysiology recordings via various data aquisition cards depending on the experiment (PCI-DIO24, Measurement Computing, NI USB-6259 or BNC-2110, National Instruments). Time-stamps of every pupil frame were saved for further alignment with imaging, electrophysiology or optogenetic experiments.
We segmented the images of a black pupil on a gray iris background by a sequence of image processing manipulations done with a custom-made MATLAB script. We adjusted the min and max pixel intensity of pupil images. We then normalized pixel values by the convolution of pupil frames by a 5*5 pixel kernel matrix of equal values. The images were binarized by a threshold value manually decided for each experiment. The binary images were filtered to extract the largest components located in the center of the image. The isolated binarized pupil image was then fitted with a least square fit of ellipse. From this fit we estimated the diameter of the pupil for each frame. The pupil segmentation was either done online, during the experiments, or offline on saved images of the pupil. Using this pipeline for pupil segmentation, very few frames had to be dropped due to poor fitting of the pupil. Most of the dropped frames were due to eye blinking or excessive micro-saccades and the diameter for these frames were estimated by interpolation.
To monitor body movement we used a 720p HD camera pointed at the mouse (LifeCam Cinema, Microsoft). The sampling rate used was 10 Hz. Movement data was synced with other experiments by displaying an indicator on the monitor. The movement metric was calculated by extracting the pixel data in time for regions around the nose, the neck, the paws and the ears of the animal. The mean difference in pixel value between each frame was calculated for each region and we normalized this value over a region of the image where no movements were expected. Periods of activity or quietness were isolated using a threshold value of 0.5 standard-deviation on the movement trace.
Optogenetic modulation of LC
We used solid state laser illumination at 473 and 532 nm for activating ChR2 and ArchT respectively (MBL-III-473/1~200 mW or MGL-III-532/1~300 mW, Opto Engine LLC). A 200 μm / 0.39 NA patch cable (M72L02, Thorlabs) was connected to the laser output and to an intensity division cube (DMC_1×2i_VIS_FC, Doric Lenses) for bilateral LC modulation. The patch cable (200 μm / 0.39 NA; M83L01 or M81L01, Thorlabs) was attached to the animal ferrule implant using corresponding ceramic mating sleeves. To block any light emitting from the interface between the patch cable and the implanted ferrule, a piece of black electrical tape was wrapped around the connection. The laser pulse duration, frequency and shape was controlled by a data acquisition system (Digidata 1440A, Molecular Devices) connected directly to the analog port of the laser power supply. For ChR2 activation of NA+, 10 ms pulses at a frequency of 3, 5, 10 or 30 Hz for 0.1, 0.5, 1, and 2 s were applied depending on the experiment. The peak power of every pulse was 4 to 5 mW at the laser output. For ChR2 activation of LC-GABA neurons, a sine wave at 25 Hz was used for various durations. A small ramp up (duration 0.5 sec) and ramp down (duration ~ 5 sec) in power was applied on top of the sine wave. Low power light stimulation (peak power < 3 mW) was used for VGAT-ChR2-YFP mice to keep the spread of optical activation in the vicinity of the optic fiber end, thus increasing neuronal activity only in GABA neurons surrounding LC. For direct inactivation of LC-NA+ neurons with ArchT, 15 to 17 mW of power was applied for 4 seconds. The rebound effect of inactivation was prevented by ramping down the laser power at the end of each laser pulse for 1 sec. For activation of PFC axons in the LC, 10 ms pulses at a frequency of 20 Hz applied for 10 sec. The peak power for those experiments ranged from 12 to 18 mW. At the end of each experiments, the location of the optic fibers was verified with respect to neurons expressing the opsin in the brain. For Gad2-Cre, VGAT-ChR2-YFP and LC-PFC experiments, location was also verified with respect to LC-NA by immunohistochemistry for TH.
Slice electrophysiology
4 to 6 weeks after virus injection of Flox-ChR2 in the LC of Gad2-Cre mice, deeply anesthetized animals (Isoflurane) were transcardially perfused with modified ice cold ACSF containing (in mM): 210.3 sucrose, 2.5 KCl, 1 NaH2PO4, 26 NaHCO3, 7 MgSO4, 0.5 CaCl2, and 11 D-glucose. The posterior brain was then quickly removed, placed in a microtome (Leica VT1200 S) and sliced in the coronal plane at a thickness of 0.3 mm. Slice recovery was performed at 37°C for 30 minutes in normal ACSF containing (in mM): 128 NaCl, 2.5 KCl, 1 NaH2PO4, 26 NaHCO3, 1.3 MgSO4, 2 CaCl2, and 10 D-glucose. After recovery, slices were maintained at room temperature for the remaining of the experiment in normal ACSF. ACSF was bubbled with a mixture of 95% O2 and 5% CO2 throughout the entire experiment.
For recording, slices were placed in a chamber perfused with oxygenated ACSF at a rate of 2mL/min. To block glutamatergic transmission 10 μM CNQX (1045, Tocris) and 10 μM D-AP5 (0106, Tocris) was added to the bath solution for all recordings. We used a cesium chloride based intracellular solution for voltage clamp recordings of inhibitory currents (in mM): 135 CsCl, 10 HEPES, 1 EGTA, 4 Mg*ATP, 1 Na2*GTP, 8 Na2-phosphocreatine, 3 biocytin; and a K-gluconate base solution for current clamp recordings (in mM): 135 K-gluconate, 6 KCl, 10 HEPES, 4 Mg*ATP, 0.3 Na2*GTP, 0.1 EGTA, Na2-phosphocreatine. Osmolality was set to 290–295 (mOsm) and pH to 7.2. Electrode resistance ranged from 3 to 5 MΩ. To block glycinergic receptors we bath applied 1 μM of strychnine (ab120416, Abcam) and to block GABAA receptors we applied 20 μM of bicuculline (0131, Tocris). Light activation was performed by pulsing for 5 ms at 10–15 mW every 2 s a solid-state blue laser (MBL-F-473–300mW, Opto Engine LLC) connected to the light path of our microscope (BX61WI, Olympus; CBH-1.0, Siskiyou). Neurons were visualized through DIC or fluorescence using a CCD camera (ORCA-R2 C10600, Hamamatsu). Gad-ChR2 positive neurons were targeted by their expression of mCherry fluorophores. LC-NA neurons were identified by fixing the slice overnight with PFA 4% and immunohistochemistry against TH (see histology section). Recordings were performed with a Multiclamp 700b (Molecular Devices) amplifier, digitized at 10 kHz and low-pass filtered at 1 kHz with a Digidata 1440 and pClamp10 software (Molecular Devices). We recorded the spontaneous spiking activity of TH+ neurons by performing cell-attached recordings for 2 min before opening the cell membrane to achieve whole-cell configuration. Neurons were voltage-clamped at a membrane potential of −70mV to record light-evoked currents. The VCl reversal potential was = 0.10 mV for the CsCl based solution. To measure the effect of Gad-ChR2 activation on the spike rate of TH positive neurons, we compared the average spike rate of 50 ms periods taken before light activation and right after the onset of the 5 ms pulse. The amplitude of evoked IPSCs were measured as the peak current after light activation for each condition. Access resistance ranged from 10 to 15 MΩ and recordings with variations greater than 15% of the baseline resistance value were excluded.
Single unit recordings of photo-identified LC units in awake mice
One or two days before the experiments, mice were head-fixed for 1 hr to habituate to head fixation. On the day of the experiments, the mice were anesthetized with isoflurane and the dental cement and silicone elastomer on the skull were removed. The mouse was placed on the stereotaxic frame and a 500 μm diameter craniotomy was performed on top of the inferior colliculus (from bregma: −4.9 to −5.4 mm anteroposterior and 0.6 to 1.1 mm mediolateral). The dura was removed and the craniotomy was protected with saline and a piece of gelfoam (Pfizer pharmaceutical). The skull was covered again with silicone and the animal was allowed to recover for at least 2 to 3 hours for the anesthesia effect to washout completely. The awake animal was then headfixed and the silicone and gelfoam removed gently. 0.9% NaCl solution was used to keep the surface of the brain wet for the duration of the recordings.
After placing the animal in the recording set up, we submerged a reference silver wire in the NaCl solution on the skull surface. The position of the 16-channel silicone probe was referenced on bregma and the surface of the brain and lowered slowly (1 min per mm) to 2.0 mm in the ventral axis using a motorized micromanipulator (MP – 285; Sutter Instrument Company). The extracellular signal was amplified using a 1× gain headstage (model E2a; Plexon) connected to a 50× preamp (PBX-247; Plexon) and digitized at 50 kHz. The signal was highpass filtered at 300Hz.
For optical identification (photo-tagging) of LC-NA and LC-GABA units, we used a solid-state blue laser (MBL-III-473/1~200 mW, Opto Engine LLC) connected via a 105 μm / 0.22 NA patch cable (M61L01, Thorlabs) to an optic fiber glued to 16 channel recording probes (A1×16-Poly2–5mm-50s-177-OA16LP, NeuroNexus). 2 to 5 ms-long light pulses at various light intensities (0.1 to 15 mW) were then repeatedly delivered in the tissue (frequency: 1 or 2 Hz), and each channel was screened for light-evoked events. Spikes were considered as light responsive if they responded within 10 ms after light stimulus onset. We also kept only units responding to at least 75% of laser pulses, and whose light evoked waveforms closely matched the spontaneous ones. During our recordings we minimized the power of light excitation in order to minimize the light-induced artifact. Recording sessions without light-responsive units were excluded from analysis.
For verifying the probe location after recordings, the silicone probe was gently retracted and the recording tract was marked by re-entering the DiI coated probe (2 mg/mL – D3911, ThermoFisher Scientific) at the same location. The brain was harvested post-experiment and immunohistochemistry for confirming the probe location was performed. Spikes were monitored online with amplitude threshold using Plexon Recorder software, but re-sorted offline using a fully automated spike sorting algorithm50. Spike curation was done manually to remove artifacts picked by the algorithms (ill-shaped spikes) and spikes with low amplitudes or low spontaneous spike rate (< 0.1 spikes/sec). We verified spike times with cross-correlograms to eliminate duplicates. We excluded parts of the recordings with obvious drift (units jumping from one channel to another).
Two-Photon imaging of LC-NA axons
4 weeks after virus injection, GCaMP6s+ noradrenergic axons were imaged in the cortex using a Prairie Ultima IV 2-photon microscopy system. Mice were head fixed and a light-shield was attached to their head plate, and the 25X/1.05 NA objective (XLPlan N, Olympus) was lowered on top of their cranial window. The 920 nm excitation of GCaMP6s was provided by a Ti:Sapphire tunable laser (Mai-Tai eHP, Spectra-Physics). Power at the objective ranged from 10 to 30 mW depending on GCaMP6s expression levels. After locating axons at 4X optical zoom, their activity was acquired at 5 frames per second for 10 minute blocks while simultaneously imaging the pupil using 8X optical zoom. Axons with significant signal to noise ratio were selected for analysis. We imaged 3 to 8 axons per mouse. The majority of our imaging field of view contained only one axon. After recording one field of view, we moved at least 1 mm away to find new axons. Care were taken to select axons from different branches, even though we cannot exclude the possibility that axons we considered as arising from different neurons were actually branches arising outside our imaging window. Using these criteria 31 axons were recorded from 6 mice.
After acquisition, time-lapse imaging sequences were corrected for x and y movement using template matching ImageJ plugins51. Multiple circular region of interests (3 to 7) were taken along each axon to extract the fluorescence intensity. The intensity in time for each region was then averaged together to minimize the noise in our signal. The dF/F signal was then calculated from this average by taking the mode of the signal as the reference value.
Sound stimuli
Tone pips were delivered using a single speaker (HK195, Harman/Kardon) located at a distance of 30 cm from the mouse. Sound stimuli were created and delivered using Psych-toolbox in MATLAB. Tone sequence was randomized in intensity and frequency to avoid habituation of the response. The inter-stimulus interval was set at 30 seconds. Tone intensities was set to 75 dB and 15 seconds inter-stimulus interval for electrophysiological recordings. The duration of each stimulus was fixed at 0.5 s. The speaker frequency range was calibrated using a USB calibrated measurement microphone (UMIK-1, Mini DSP) and the Room EQ Wizard software. The ambient noise in the room was estimated around 50 dB and the sound stimulus intensities were recorded by a sound level meter. To obtain the pupil response to different tone intensities and frequencies, an average of 63 ± 5 trials per tone intensity were recorded. To avoid long sessions and habituation, we limited each mouse to one 1-hour session per day. 5 ± 1 sessions were recorded per animal. For trials with laser activation of LC-GABA neurons in Gad2-ChR2, VGAT-ChR2 and PFC-LC implanted mice, the laser was turned on 5 s before the auditory tone onset and kept on for a total duration of 10 second (5 s baseline and 5 s after auditory stimulus). Laser activation were applied on 50% of trials distributed randomly during the session. To calculate the effect of laser activation on NA tone, we used a 7-second long averaging window aligned to sound onset and compared the z-scored laser and non-laser trials. For measuring the modulation of pupil response created by laser activation, a baseline period of 0.5 second before tone onset was used to calculate the increase in pupil size to different tone intensities and the response over a 1.5-second-long averaging window aligned to sound onset was evaluated. Trials with high (2 times standard deviation) or low (1 time standard deviation) were excluded from the analysis.
Histology
Under very deep anesthesia, mice were perfused transcardially with 0.9% NaCl followed by 4% PFA. The brains were harvested and post-fixed in 4% PFA at 4 °C overnight. In some experiments, brains were extracted without transcardial perfusion and only immersed in PFA overnight. Coronal sections (50 or 100-μm-thick) were cut using a vibratome (VT1200S, Leica) and were incubated overnight at 4 °C in PBS-T (0.1% Triton) + 3% bovine serum albumin and the following primary antibodies were used: 1:1000 chicken anti-tyrosine hydroxylase (TYH, Aves Labs lot no. TYH8727985), 1:1000 rabbit anti-VGAT (131002, Synaptic Systems lot no. 131002/34), 1:1000 rabbit anti-GABA (A2052, Sigma lot no. 126M4791V), 1:500 rabbit anti-neuropeptide S (ab18252 Abcam), and 1:200 streptavidin-488 conjugated antibodies (S32354 ThermoFisher Scientific). We used the following secondary antibodies at a dilution of 1:500: goat anti-chicken 647 nm (A21449, ThermoFisher Scientific), goat anti-chicken 488 nm (A11039, ThermoFisher Scientific), goat anti-rabbit 488 nm (A11034, ThermoFisher Scientific), and goat anti-mouse 488 nm (A21121, ThermoFisher Scientific). For acute slices from whole-cell electrophysiological recordings, after fixing overnight in 4% PFA, slices were washed 3×10min in PBS and permeabilized with (1% Triton) + 3% bovine serum albumin before incubation with primary antibodies. For GAD67 staining, slices were permeabilized for 1h in 3% BSA and 10% normal goat serum, and then incubated for 48h at room temperature in 3% BSA, 10% normal goat serum and 1:200 mouse anti-GAD67 (MAB5406 EMD Millipore lot no. 2923238). (Note that no detergent was used at any steps for the staining). Slices were mounted in Vectashield hard set mounting medium with DAPI (H-1500, Vector labs). The resulting immunofluorescence was imaged with a confocal system (TCS SP8, Leica) with 10X / 0.40 NA, 20X / 0.75 NA, or 63X / 1.40 NA objectives (Leica).
For quantification of Gad2-Cre neurons coexpressing GABA, GAD67, TH and neuropeptide S, 20X z-stack images were acquired for 2–3 fields of view surrounding the LC of each slice. The percentage of Gad2-Cre cells, as identified by their expression of Flox-mCherry, overlapping with the different markers was calculated for each field of view. For the reconstruction of LC structures and surrounding areas, we collected the brain from Flex-tdTomato virus injected Dbh-Cre mice. We performed staining of GABA by immunohistochemistry on the slices covering a region of 1 to 1.5 mm on the anteroposterior axis that covered the full extent of the LC. The GABA+ and Dbh+ neurons of the LC were imaged by performing tiling reconstruction with a 20X objective zoomed 2X. We also took low magnification (10X) images of each slice for later registration across the different slices. The location of GABA neurons located within 200 μm of Dbh+ somas was then marked using ImageJ, and the whole LC was 3D reconstructed by exporting those values in a custom-made MATLAB program. Due to the different penetration properties of antibodies, quantification was performed within 10 μm of the surface of the slice. All slices were aligned with respect to the center of mass of LC-Dbh neuron. To obtain the neuronal density of each LC-NA and LC-GABA neurons, we counted the number of somas in each bin (bin size: 50 or 100 μm) and normalized to the total number of somas counted.
For analysis of inputs to LC-NA versus LC-GABA populations, we collected the brain 1 week after injection of EnVA-RΔG.mCherry. 100 μm-thick coronal sections were produced, and one section every 200 μm was serially mounted on microscope slides. We analyzed sections from the middle of the olfactory bulb (+4.5 mm from bregma) to the end of the brain stem (- 8mm posterior to bregma). Somata positive for mCherry were counted from all selected slices except for regions surrounding LC. The Paxinos and Franklin52 mouse atlas was used as a reference for identifying brain regions. We also verified our data against the Allen Mouse Brain Atlas53 and found similar results. Regions adjacent to LC were not considered for analysis due to non-specific expression of virus at the site of injection. The fraction of total inputs for each animal was obtained by dividing the number of mCherry+ soma for each brain region by the total number of somas counted. Animals with too few presynaptic neurons were not considered for analysis. The injection of the same combination of Cre-dependent helper virus and deleted glycoprotein in the LC of 2 WT mice showed a small number of neurons positive for mCherry at the injection site, but almost no neurons retrogradely labelled (n = 9 and 14 compared to 240 ±99 and 1767 ±733 neurons in the Dbh- and Gad2-Cre conditions) confirming that retrogradely labelled neurons were targeted to Cre-expressing starter cells.
Data processing
All data analysis, unless noted, was performed using custom-made MATLAB scripts. In single unit recordings, we extracted two classes of unit (RS and FS) based on their waveform shape. For each unit, we calculated the full width at half maximum of the valley portions of the average spike and the spike duration defined by the time from peak to valley. A Gaussian mixture distribution model with 3 components was fitted to the data. The 3 clusters were then classified as FS for short spike duration or RS for long spike duration and the third cluster for non-classified units. Valley FWHM and spike duration were used due to the best possible dissociation between FS and RS units. Spike delay to laser activation for photo-tagged Gad2 and Dbh units was calculated as the average timing for the first peak after the light onset. The jitter was defined as the standard deviation of this peak onset distribution. We calculated the spontaneous firing rate by averaging the number of spikes during a 10-minute period, where no sensory stimulus was presented. Instantaneous spiking rate (r(t)) were obtained by using a kernel density estimation54 using the following equations:
where ti is the time if the ith spike and N is the total number of spikes. fΔ represent the following exponential kernel:
Different methods were employed to evaluate how neuronal or behavioral activity correlates with arousal. For measuring the general association between LC single unit activity and pupil size, we first obtained an estimation of the instantaneous spike rate sampled at 5 Hz. We then computed Pearson’s linear correlation coefficient between the pupil size and activity of LC. The value of Pearson’s correlation was done at a lag between pupil and neuronal activity corresponding to the peak in cross correlation. P-values for Pearson’s correlation were calculated using a Student’s t-distribution for a transformation of the correlation. A LC unit correlated significantly with pupil size if p < 0.05. The activity of different class of units during global pupil constriction or dilation was measured by averaging the spike rate during pupil values lower than the 25th percentile (for constriction) or higher than the 75th percentile (for dilation). To measure the timing of correlation with pupil, we computed the normalized cross-correlation. Pupil traces and neuronal or behavioral activity metrics were re-sampled (for extracellular LC recordings: 200 Hz, LC-NA Ca2+ axonal imaging: 5 Hz, and for facial movements video analyses: 10 Hz) and both normalized using z-score before computing cross-correlation. The delay between arousal and NA activity or movement was derived from the average lag value at maximum cross-correlation. To evaluate the increase in activity preceding pupil dilation or constriction, we band-pass filtered the pupil trace between 0.1 and 2 Hz using a second-order Butterworth filter. We then isolated pupil events by locating either the time point of minimas (dilation event) or maximas (constriction event) and extracted the pupil and spike rate traces for a window of −1 to 4 s around those time points. The amplitude of spike rate was evaluated from 0 to 0.5 after the onset of dilation or constriction. Alternatively, we also aligned NA activity (spike rate and calcium imaging) to maximas or minimas of the derivative of pupil size (variation of pupil diameter in time).
The effect of activating diverse populations of the LC on arousal was assessed by measuring the alteration in pupil size following light-activation or inactivation of neurons expressing ChR2 or ArchT. For each trial, we subtracted the baseline pupil diameter, evaluated for each trial on a period of 2 seconds before light onset. We then calculated the change in pupil size by averaging for a period of 1.5 to 8 s following the onset of the stimulus (Dbh-ChR2: 1.5 to 2 s depending on stimulus duration; Dbh-ArchT: 4 s and VGAT-ChR2: 8 s). Since there is a delay between increase or decrease in LC-NA activity and pupil dilation, we averaged the response of optical activation 0.7 sec after switching on the laser. The average variation in pupil size was then calculated for each animal. We used trials without laser as control to compensate for spontaneous changes in pupil size.
To evaluate how LC-NA and LC-GABA neurons respond to salient sensory stimuli, we recorded the response of units to tone pips. A unit was considered as auditory responsive if there was a significant increase (p < 0.05 using one-tailed paired t-test). of activity between a baseline period of 500 ms and the amplitude calculated over a 500-ms-period following the onset of tone pip. To evaluate the delay between neuronal response and stimulus onset, we calculated the average time for the response to reach a value above half the standard deviation. For two-photon imaging of LC-NA GCaMP6s+ axon, we compared the response with a 2-second baseline period preceding the auditory stimulus onset.
The effect of LC-GABA neurons on LC-NA mediated increase in arousal was assessed by recording the pupil diameter while animals were presented auditory stimuli of different intensities. LC-GABA neurons were optically activated by a 25Hz sine wave (max power ~3 mW) on half the trials and the order of trials were randomized. Pupil response was calculated by subtracting a baseline pupil size value for each trial before the auditory stimulus (calculated over 0.5 s before tone onset). Since the effect of auditory stimulus on pupil dilation is usually delayed by a few ms, we calculated the average amplitude of pupil for a 1.5-second-window 0.5 second after the tone onset. This response was then averaged for each trial type to obtain the tone intensity – pupil size increase relationship. The suppression by LC-GABA neuron activation was defined as the difference between the response for trials with and without light activation. This difference was then normalized to the maximum value of suppression for each animal. The same procedure was used for the optical inactivation of LC-NA neurons with ArchT during sound stim. Optical silencing was performed for a total of 4 s (1s baseline and 3 sec post-stimulus) baseline and amplitude of pupil size was calculated for 1.4 and 1.6 s respectively surrounding the stimulus.
Statistics
Throughout the paper we used paired and unpaired Student’s two-sided t-test for evaluating P values of experiments with two conditions. P values for experiments with multiple conditions were computed using ANOVA with Tukey post-hoc test. Significance level were marked as *: p < 0.05; **: p < 0.01; and ***: p < 0.001. P-value for Pearson’s correlation were calculated using a Student’s t-distribution for a transformation of the correlation. LC unit correlated significantly with pupil size if p < 0.05. Proportions of cells positively or negatively correlated with pupil for Dbh and Gad2 units were tested for significance using a χ2 test. For all experiments, sample sizes were pre-determined using a power analysis to provide at least 80% power to detect an effect. Data distribution was assumed to be normal but this was not formally tested. Data collection and analysis were not performed blind to the conditions of the experiments.
Supplementary Material
Acknowledgements
We thank I. Wickersham (Massachusetts Institute of Technology) for his gift of the AAV helpers and dG-Rabies virus used for monosynaptic tracing. We thank V. Pham and L. Gunter for technical assistance on histology experiments. We thank S. Flavell, A. Bari, R. Huda, G. Sipe and other members of the Sur lab for helpful comments. This work was supported by NIH grant EY007023 (M.S.), EY028219 (M.S.), and NS090473 (M.S.), and postdoctoral fellowships from FRQS 31677 and NSERC PDF-48724–2016 (V.B.-P.).
Footnotes
Competing Interests Statement
The authors declare no competing financial interests.
Data and code availability statement
The data and code used for analyses that support the findings of this study are available from the corresponding author upon request.
References
- 1.Aston-Jones G & Cohen JD An integrative theory of locus coeruleus-norepinephrine function: adaptive gain and optimal performance. Annual review of neuroscience 28, 403–450 (2005). [DOI] [PubMed] [Google Scholar]
- 2.Sara SJ The locus coeruleus and noradrenergic modulation of cognition. Nature reviews. Neuroscience 10, 211–223 (2009). [DOI] [PubMed] [Google Scholar]
- 3.Sara SJ & Bouret S Orienting and reorienting: the locus coeruleus mediates cognition through arousal. Neuron 76, 130–141 (2012). [DOI] [PubMed] [Google Scholar]
- 4.Carter ME, et al. Tuning arousal with optogenetic modulation of locus coeruleus neurons. Nature neuroscience 13, 1526–1533 (2010). [DOI] [PMC free article] [PubMed] [Google Scholar]
- 5.Joshi S, Li Y, Kalwani RM & Gold JI Relationships between Pupil Diameter and Neuronal Activity in the Locus Coeruleus, Colliculi, and Cingulate Cortex. Neuron 89, 221–234 (2016). [DOI] [PMC free article] [PubMed] [Google Scholar]
- 6.Reimer J, et al. Pupil fluctuations track rapid changes in adrenergic and cholinergic activity in cortex. Nature communications 7, 13289 (2016). [DOI] [PMC free article] [PubMed] [Google Scholar]
- 7.Takeuchi T, et al. Locus coeruleus and dopaminergic consolidation of everyday memory. Nature 537, 357–362 (2016). [DOI] [PMC free article] [PubMed] [Google Scholar]
- 8.Tervo DGR, et al. Behavioral variability through stochastic choice and its gating by anterior cingulate cortex. Cell 159, 21–32 (2014). [DOI] [PubMed] [Google Scholar]
- 9.McCall JG, et al. CRH Engagement of the Locus Coeruleus Noradrenergic System Mediates Stress-Induced Anxiety. Neuron 87, 605–620 (2015). [DOI] [PMC free article] [PubMed] [Google Scholar]
- 10.Reimer J, et al. Pupil fluctuations track fast switching of cortical states during quiet wakefulness. Neuron 84, 355–362 (2014). [DOI] [PMC free article] [PubMed] [Google Scholar]
- 11.Vinck M, Batista-Brito R, Knoblich U & Cardin JA Arousal and locomotion make distinct contributions to cortical activity patterns and visual encoding. Neuron 86, 740–754 (2015). [DOI] [PMC free article] [PubMed] [Google Scholar]
- 12.McGinley MJ, David SV & McCormick DA Cortical Membrane Potential Signature of Optimal States for Sensory Signal Detection. Neuron 87, 179–192 (2015). [DOI] [PMC free article] [PubMed] [Google Scholar]
- 13.Polack PO, Friedman J & Golshani P Cellular mechanisms of brain state-dependent gain modulation in visual cortex. Nature neuroscience 16, 1331–1339 (2013). [DOI] [PMC free article] [PubMed] [Google Scholar]
- 14.Schwarz LA, et al. Viral-genetic tracing of the input-output organization of a central noradrenaline circuit. Nature 524, 88–92 (2015). [DOI] [PMC free article] [PubMed] [Google Scholar]
- 15.Aston-Jones G & Bloom FE Norepinephrine-containing locus coeruleus neurons in behaving rats exhibit pronounced responses to non-noxious environmental stimuli. The Journal of neuroscience : the official journal of the Society for Neuroscience 1, 887–900 (1981). [DOI] [PMC free article] [PubMed] [Google Scholar]
- 16.Martins AR & Froemke RC Coordinated forms of noradrenergic plasticity in the locus coeruleus and primary auditory cortex. Nature neuroscience 18, 1483–1492 (2015). [DOI] [PMC free article] [PubMed] [Google Scholar]
- 17.Uematsu A, et al. Modular organization of the brainstem noradrenaline system coordinates opposing learning states. Nature neuroscience (2017). [DOI] [PubMed] [Google Scholar]
- 18.Herve-Minvielle A & Sara SJ Rapid habituation of auditory responses of locus coeruleus cells in anaesthetized and awake rats. Neuroreport 6, 1363–1368 (1995). [DOI] [PubMed] [Google Scholar]
- 19.Grant SJ, Aston-Jones G & Redmond DE Jr. Responses of primate locus coeruleus neurons to simple and complex sensory stimuli. Brain research bulletin 21, 401–410 (1988). [DOI] [PubMed] [Google Scholar]
- 20.Vankov A, Herve-Minvielle A & Sara SJ Response to novelty and its rapid habituation in locus coeruleus neurons of the freely exploring rat. The European journal of neuroscience 7, 1180–1187 (1995). [DOI] [PubMed] [Google Scholar]
- 21.Aston-Jones G & Bloom FE Activity of norepinephrine-containing locus coeruleus neurons in behaving rats anticipates fluctuations in the sleep-waking cycle. The Journal of neuroscience : the official journal of the Society for Neuroscience 1, 876–886 (1981). [DOI] [PMC free article] [PubMed] [Google Scholar]
- 22.Usher M, Cohen JD, Servan-Schreiber D, Rajkowski J & Aston-Jones G The role of locus coeruleus in the regulation of cognitive performance. Science 283, 549–554 (1999). [DOI] [PubMed] [Google Scholar]
- 23.Yerkes RM & Dodson JD The relation of strength of stimulus to rapidity of habit-formation. Journal of Comparative Neurology and Psychology 18, 459–482 (1908). [Google Scholar]
- 24.Aston-Jones G, Zhu Y & Card JP Numerous GABAergic afferents to locus ceruleus in the pericerulear dendritic zone: possible interneuronal pool. The Journal of neuroscience : the official journal of the Society for Neuroscience 24, 2313–2321 (2004). [DOI] [PMC free article] [PubMed] [Google Scholar]
- 25.Jin X, et al. Identification of a Group of GABAergic Neurons in the Dorsomedial Area of the Locus Coeruleus. PloS one 11, e0146470 (2016). [DOI] [PMC free article] [PubMed] [Google Scholar]
- 26.Boucetta S, Cisse Y, Mainville L, Morales M & Jones BE Discharge profiles across the sleep-waking cycle of identified cholinergic, GABAergic, and glutamatergic neurons in the pontomesencephalic tegmentum of the rat. The Journal of neuroscience : the official journal of the Society for Neuroscience 34, 4708–4727 (2014). [DOI] [PMC free article] [PubMed] [Google Scholar]
- 27.Cox J, Pinto L & Dan Y Calcium imaging of sleep-wake related neuronal activity in the dorsal pons. Nature communications 7, 10763 (2016). [DOI] [PMC free article] [PubMed] [Google Scholar]
- 28.Xu YL, et al. Neuropeptide S: a neuropeptide promoting arousal and anxiolytic-like effects. Neuron 43, 487–497 (2004). [DOI] [PubMed] [Google Scholar]
- 29.Zhao S, et al. Cell type-specific channelrhodopsin-2 transgenic mice for optogenetic dissection of neural circuitry function. Nature methods 8, 745–752 (2011). [DOI] [PMC free article] [PubMed] [Google Scholar]
- 30.Wickersham IR, Sullivan HA & Seung HS Production of glycoprotein-deleted rabies viruses for monosynaptic tracing and high-level gene expression in neurons. Nature protocols 5, 595–606 (2010). [DOI] [PubMed] [Google Scholar]
- 31.Aston-Jones G, et al. Chapter 4 - Afferent regulation of locus coeruleus neurons: anatomy, physiology and pharmacology in Progress in Brain Research (ed. Barnes CD & Pompeiano O) 47–75 (Elsevier, 1991). [DOI] [PubMed] [Google Scholar]
- 32.Luppi PH, Aston-Jones G, Akaoka H, Chouvet G & Jouvet M Afferent projections to the rat locus coeruleus demonstrated by retrograde and anterograde tracing with cholera-toxin B subunit and Phaseolus vulgaris leucoagglutinin. Neuroscience 65, 119–160 (1995). [DOI] [PubMed] [Google Scholar]
- 33.Totah NK, Neves RM, Panzeri S, Logothetis NK & Eschenko O The Locus Coeruleus Is a Complex and Differentiated Neuromodulatory System. Neuron 99, 1055–1068.e1056 (2018). [DOI] [PubMed] [Google Scholar]
- 34.Wilson NR, Runyan CA, Wang FL & Sur M Division and subtraction by distinct cortical inhibitory networks in vivo. Nature 488, 343–348 (2012). [DOI] [PMC free article] [PubMed] [Google Scholar]
- 35.Atallah BV, Bruns W, Carandini M & Scanziani M Parvalbumin-expressing interneurons linearly transform cortical responses to visual stimuli. Neuron 73, 159–170 (2012). [DOI] [PMC free article] [PubMed] [Google Scholar]
- 36.Stalnaker TA, Cooch NK & Schoenbaum G What the orbitofrontal cortex does not do. Nature neuroscience 18, 620–627 (2015). [DOI] [PMC free article] [PubMed] [Google Scholar]
- 37.Bouret S & Sara SJ Reward expectation, orientation of attention and locus coeruleus-medial frontal cortex interplay during learning. The European journal of neuroscience 20, 791–802 (2004). [DOI] [PubMed] [Google Scholar]
- 38.Nitz D & Siegel JM GABA release in the locus coeruleus as a function of sleep/wake state. Neuroscience 78, 795–801 (1997). [DOI] [PMC free article] [PubMed] [Google Scholar]
- 39.Ennis M & Aston-Jones G Evidence for self- and neighbor-mediated postactivation inhibition of locus coeruleus neurons. Brain research 374, 299–305 (1986). [DOI] [PubMed] [Google Scholar]
- 40.Mileykovskiy BY, Kiyashchenko LI, Kodama T, Lai YY & Siegel JM Activation of pontine and medullary motor inhibitory regions reduces discharge in neurons located in the locus coeruleus and the anatomical equivalent of the midbrain locomotor region. The Journal of neuroscience : the official journal of the Society for Neuroscience 20, 8551–8558 (2000). [DOI] [PMC free article] [PubMed] [Google Scholar]
- 41.Dimitrov EL, Yanagawa Y & Usdin TB Forebrain GABAergic projections to locus coeruleus in mouse. Journal of Comparative Neurology 521, 2373–2397 (2013). [DOI] [PMC free article] [PubMed] [Google Scholar]
- 42.Aghajanian GK, Cedarbaum JM & Wang RY Evidence for norepinephrine-mediated collateral inhibition of locus coeruleus neurons. Brain research 136, 570–577 (1977). [DOI] [PubMed] [Google Scholar]
- 43.Kreibich A, et al. Presynaptic inhibition of diverse afferents to the locus ceruleus by kappa-opiate receptors: a novel mechanism for regulating the central norepinephrine system. The Journal of neuroscience : the official journal of the Society for Neuroscience 28, 6516–6525 (2008). [DOI] [PMC free article] [PubMed] [Google Scholar]
- 44.Sara SJ & Herve-Minvielle A Inhibitory influence of frontal cortex on locus coeruleus neurons. Proceedings of the National Academy of Sciences of the United States of America 92, 6032–6036 (1995). [DOI] [PMC free article] [PubMed] [Google Scholar]
- 45.Jodo E, Chiang C & Aston-Jones G Potent excitatory influence of prefrontal cortex activity on noradrenergic locus coeruleus neurons. Neuroscience 83, 63–79 (1998). [DOI] [PubMed] [Google Scholar]
- 46.Callaway EM & Luo L Monosynaptic Circuit Tracing with Glycoprotein-Deleted Rabies Viruses. The Journal of Neuroscience 35, 8979 (2015). [DOI] [PMC free article] [PubMed] [Google Scholar]
- 47.Szabadi E Modulation of physiological reflexes by pain: role of the locus coeruleus. Frontiers in integrative neuroscience 6, 94 (2012). [DOI] [PMC free article] [PubMed] [Google Scholar]
- 48.Samuels ER & Szabadi E Functional neuroanatomy of the noradrenergic locus coeruleus: its roles in the regulation of arousal and autonomic function part I: principles of functional organisation. Current neuropharmacology 6, 235–253 (2008). [DOI] [PMC free article] [PubMed] [Google Scholar]
Methods-only References:
- 49.Goard MJ, Pho GN, Woodson J & Sur M Distinct roles of visual, parietal, and frontal motor cortices in memory-guided sensorimotor decisions. eLife 5, e13764 (2016). [DOI] [PMC free article] [PubMed] [Google Scholar]
- 50.Chung JE, et al. A Fully Automated Approach to Spike Sorting. Neuron 95, 1381–1394.e1386 (2017). [DOI] [PMC free article] [PubMed] [Google Scholar]
- 51.Schneider CA, Rasband WS & Eliceiri KW NIH Image to ImageJ: 25 years of image analysis. Nature methods 9, 671–675 (2012). [DOI] [PMC free article] [PubMed] [Google Scholar]
- 52.Paxinos G & Franklin KB J. The Mouse Brain in Stereotaxic Coordinates (Academic Press, San Diego, California, 2001). [Google Scholar]
- 53.Lein ES, et al. Genome-wide atlas of gene expression in the adult mouse brain. Nature 445, 168–176 (2007). [DOI] [PubMed] [Google Scholar]
- 54.Grün S & Rotter S Analysis of Parallel Spike Trains: Chapter 2 Estimating the Firing Rate (Springer US, 2010). [Google Scholar]
Associated Data
This section collects any data citations, data availability statements, or supplementary materials included in this article.