Watch a video presentation of this article
Abbreviations
- CT
computed tomography
- IVC
inferior vena cava
- MR
magnetic resonance
- MRI
magnetic resonance imaging
- US
ultrasound
The liver serves many essential physiological functions, among them glycogen storage, biliary metabolism, and coagulation factor synthesis. It is important for the radiologist to recognize compromise to the hepatic arterial and venous systems, including iatrogenic, malignant, and infectious causes. This article will explore computed tomography (CT), magnetic resonance imaging (MRI), and ultrasound (US) imaging features of hepatic arterial and venous flow abnormalities.
Hepatic Hypoperfusion
Decreased hepatic vascular inflow, secondary to portal vein and/or hepatic arterial abnormalities, may result in a wide range of clinical presentations ranging from little effect, ischemia, which is generally reversible, or infarction, which can lead to permanent or emergent liver failure. A global hypotensive or hypoxic event, such as severe acute blood loss, may result in “shock liver” or “ischemic hepatitis,” an entity describing hypoperfusion of the liver. This condition may manifest with hypoenhancement of all or part of the hepatic parenchyma on contrast‐enhanced images.1 Shock liver is uncommonly seen due to the dual hepatic blood supply and sympathetic autoregulation of the hepatic arteries, but when present, it is often accompanied by hypoperfusion of other abdominal viscera.2 If the cause of hypovolemia is addressed, the liver parenchyma usually recovers.
Hepatic Artery Occlusion
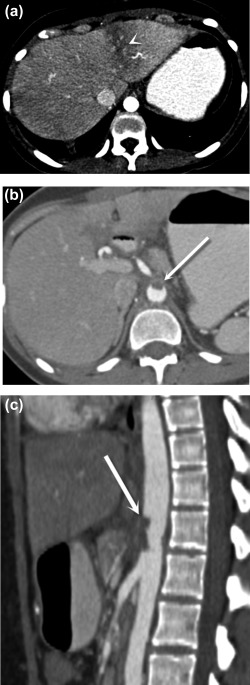
In centers that offer liver transplantation, posttransplant patients comprise the largest population affected by hepatic artery occlusion. Other iatrogenic causes include endovascular procedures, in which thrombosis may develop at sites of catheterization (Fig. 1), and unintentional ligation of an artery during surgery, most commonly during laparoscopic cholecystectomy, leading to thrombosis. Alternatively, vasculitis, which can cause severe arterial narrowing, may put a patient at risk for occlusion. Atherosclerosis can lead to thrombosis; this cause would be favored if other areas of arterial plaque formation are present on imaging. Thrombosis may also occur at sites of aneurysm or focal dilation of a vessel caused by changes in blood flow dynamics. Aortic dissection can extend into branch vessels and impede hepatic blood flow.3 In the obstetric population with HELLP (hemolysis, elevated liver enzymes, low platelets) syndrome, fibrin deposition can lead to microvascular occlusion, placing these patients at risk for infarction and rupture.
Figure 1.

Postoperative aortic and celiac thrombosis. Axial (A, B) and sagittal (C) postcontrast CT images demonstrate a wedge‐shaped area of low attenuation in the left hepatic lobe (A) (arrowhead), representing transient hepatic attenuation difference secondary to hypoperfusion caused by aortic thrombus extending into the celiac trunk, (B, C) (arrows) which formed after endovascular treatment for median arcuate ligament syndrome.
US is the first line modality for evaluating liver transplants for arterial occlusion. This typically manifests on US with low resistive indices in the distal hepatic arteries, prompting evaluation of the arterial anastomosis. If visible under US, a severe stenosis may cause elevated flow velocities, tissue vibration, and aliasing. Complete occlusion will show an absence of flow on color Doppler. When not seen under US, CT or magnetic resonance (MR) angiography may demonstrate occlusion of a hepatic artery, characterized by a nonenhancing filling defect on CT or MRI. If one or more of the hepatic arteries is occluded, particularly in the setting of simultaneous portal venous compromise, the liver is at risk for infarction. On contrast‐enhanced CT or MRI, infarction appears as a wedge‐shaped area(s) of hypoattenuation at the periphery. These areas are T1‐hypointense and T2‐hyperintense on MRI and may be hypoechoic on US. Potential sequelae of infarction include bile duct necrosis and biloma formation (Fig. 2), atrophy of the affected segments, and potentially superimposed infection,4 which could be suspected if gas is present on imaging. It is important to note that this is a nonspecific finding, because gas formation may be seen in sites of hepatic necrosis that are not infected.
Figure 2.

Bile duct necrosis and biloma formation after arterial occlusion complicating liver transplantation. Arterial phase (A) and portal venous phase (B) postcontrast fat‐saturated T1‐weighted MRI sequences show an occluded arterial conduit for transplant (arrows). Biliary necrosis resulted in multiple intrahepatic biliary strictures, seen on the T2‐weighted maximum intensity projection MRCP image (C), and intrahepatic fluid collections consistent with bilomas (arrowheads), seen on the T2‐weighted single‐shot fast spin‐echo MR image (D).
Portal Vein Occlusion
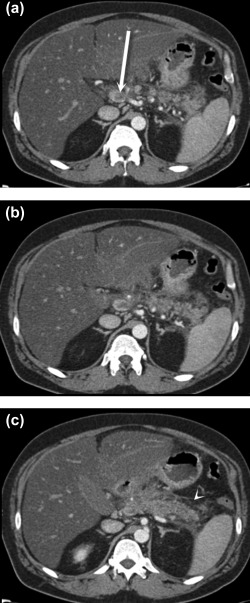
Responsible for approximately 75% of overall hepatic perfusion, the portal vein must also be closely evaluated by the radiologist for thrombosis. Patients who have acute development of portal vein thrombus present with abdominal pain, fever, and possibly diarrhea, ileus, and gastrointestinal bleed. Hypercoagulable states, cirrhosis, pancreatitis (Fig. 3), and history of splenectomy are risk factors for the development of bland portal vein thrombus. Portal venous thrombosis, similar to arterial thrombosis, can be readily diagnosed with US showing a filling defect on grayscale imaging and lack of flow on color Doppler, although the latter finding may also be seen with low‐velocity flow as well. CT and MRI can also diagnose thrombosis of the portal vein as a nonenhancing filling defect acutely. In contrast, chronic portal vein thrombosis presents with a small‐caliber, potentially calcified vein and collateral formation, including cavernous transformation, collateral flow with multiple small tortuous vessels in the liver hilum. Signs of portal hypertension may also be seen including splenomegaly and varices.
Figure 3.

Portal venous thrombosis secondary to pancreatitis. Axial postcontrast CT images (A‐C) demonstrate retroperitoneal fluid and fat stranding surrounding the pancreatic body and tail (C) (arrowhead), consistent with acute pancreatitis. There is associated thrombosis of the splenic vein that extends to the portosplenic confluence, where there is nearly occlusive thrombus in the main portal vein (A) (arrow).
Portal vein tumor thrombus should be considered if the clot enhances after contrast administration. The “thread and streak” sign, vascular channels running through and around the intraluminal tumor cast, can be seen on angiographic studies.5 On US, the combination of color flow within the thrombus and Doppler pulsatility is a strong indicator of tumor thrombus.6 Hepatocellular carcinoma, pancreatic cancer, cholangiocarcinoma, and metastatic gastrointestinal adenocarcinomas are classically associated with portal vein tumor thrombus (Fig. 4).
Figure 4.

Portal vein tumor thrombus. Axial noncontrast (A) and postcontrast arterial (B) and portal venous (C) phase T1 three‐dimensional gradient‐echo fat‐saturated MR images demonstrate a hypointense lesion in the right lobe of the liver (arrowhead), consistent with hepatocellular carcinoma. An enhancing tumor thrombus is seen in the adjacent portal vein (C) (arrow).
Suppurative thrombophlebitis of the portal vein, or pylephlebitis, may also result in occlusion. It often develops adjacent to a pyogenic hepatic abscess and is usually secondary to an ascending cause such as diverticulitis or appendicitis.7 The presence of a visible ascending infection or an adjacent hepatic abscess allows radiologists to suggest this diagnosis. Follow‐up CT or MRI is often necessary, however, due to the overlap in the imaging features of malignant and inflammatory venous thrombosis.
Hepatic Vein Occlusion
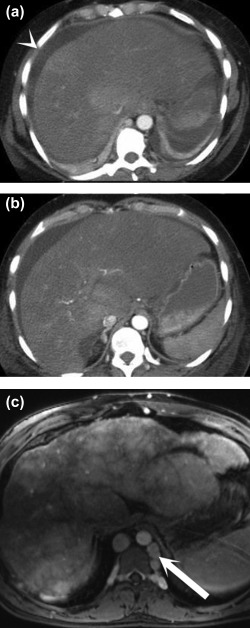
Hepatic venous outflow obstruction results in hepatic congestion, which can interfere with perfusion because of increased sinusoidal pressure. Budd‐Chiari syndrome occurs with obstruction of the hepatic veins or inferior vena cava (IVC). Most commonly caused by hypercoagulable states, it may also be secondary to malignant invasion, most commonly in the setting of hepatocellular carcinoma, but also with primary renal, adrenal, and IVC tumors. Acutely, imaging findings include hepatomegaly with mottled or “nutmeg” appearance of the parenchyma, venous filling defects, and ascites. In chronic Budd‐Chiari syndrome, the liver continues to demonstrate a nutmeg appearance, with atrophy of the affected segments and collateral formation (Fig. 5); if the caudate was not involved (because of its separate venous drainage), it may be hypertrophied with relatively increased enhancement.8
Figure 5.

Acute versus chronic Budd‐Chiari syndrome. Postcontrast axial CT images (A and B) show a large, heterogeneous liver, ascites (arrowhead), and nonvisualization of the hepatic veins. Postcontrast T1‐weighted MR image (C) demonstrates the classic “nutmeg” appearance of the parenchyma, surface nodularity (a sign of atrophy), and collateral formation (arrow).
Similar in pathophysiology to Budd‐Chiari syndrome, hepatic veno‐occlusive disease can be seen after radiation or ingestion of pyrrolizidine alkaloids. Nonvisualization of the hepatic veins along with periportal and gallbladder wall edema should prompt a suspicion for this diagnosis in at‐risk patients.9 When this disease occurs in patients who have undergone bone marrow transplantation after ablative chemotherapy, it is termed sinusoidal obstruction syndrome. In this case, the hepatic veins may remain patent, with reversal of flow within the portal vein due to sinusoidal obstruction. Long‐term oxaliplatin administration has caused a similar phenomenon.10
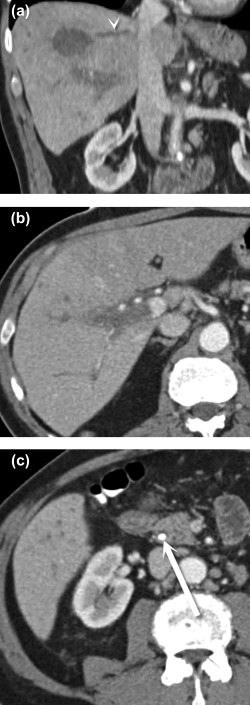
Comparable with pylephlebitis, hepatic vein thrombophlebitis is usually associated with an adjacent hepatic abscess (Fig. 6). Klebsiella pneumoniae abscesses are classically associated with hepatic vein thrombophlebitis, but it has also been described in cases of Escherichia coli, nonhemolytic streptococci, and anaerobic abscesses.11 Diabetic and immunocompromised patients are at relatively greater risk for acquiring abscesses, which can develop secondary to biliary or hematogenous spread or trauma.
Figure 6.

Hepatic vein thrombophlebitis. Coronal (A) and axial (B, C) CT images show an abscess in the dome of the liver (A), which has associated thrombosis of the middle hepatic vein (A) (arrowhead), as well as the right main portal vein (B). The patient improved after treatment for cholangitis arising from an obstructing common bile duct stone (C) (arrow).
A multitude of conditions can affect the hepatic vasculature. Familiarity with these entities, their short‐ and long‐term manifestations, and their presentation on multiple imaging modalities is vital for providing accurate diagnostic information to clinicians, appropriately guiding management, and gauging prognosis.
Potential conflict of interest: Nothing to report.
REFERENCES
- 1. Ryan MF, Hamilton PA, Sarrazin J, Chu P, Benjaminov O, Lam K. The halo sign and peripancreatic fluid: useful CT signs of hypovolaemic shock complex in adults. Clin Radiol 2005;60:599‐607. [DOI] [PubMed] [Google Scholar]
- 2. Lubner M, Demertzis J, Lee JY, Appleton CM, Bhalla S, Menias CO. CT evaluation of shock viscera: a pictorial review. Emerg Radiol 2008;15:1‐11. [DOI] [PubMed] [Google Scholar]
- 3. Oderich G, Panneton JM, Bower TC, Ricotta JJ 2nd, Sundt TM 3rd, Cha S, Gloviczki P. Aortic dissection with aortic side branch compromise: impact of malperfusion on patient outcome. Perspect Vasc Surg Endovasc Ther 2008;20:190‐200. [DOI] [PubMed] [Google Scholar]
- 4. Holbert B, Baron RL, Dodd GD 3rd. Hepatic infarction caused by arterial insufficiency. AJR Am J Roentgenol 1996;166:815‐820. [DOI] [PubMed] [Google Scholar]
- 5. Raab BW. The thread and streak sign. Radiology 2005;236:284‐285. [DOI] [PubMed] [Google Scholar]
- 6. Furuse J, Matsutani S, Yoshikawa M, Ebara M, Saisho H, Tsuchiya Y, Ohto M. Diagnosis of portal vein tumor thrombus by pulsed Doppler ultrasonography. J Clin Ultrasound 1992;20:439‐446. [DOI] [PubMed] [Google Scholar]
- 7. Schiff E, et al. Schiff's Diseases of the Liver. 10th ed. Schiff ER, Sorrell MF, Maddrey WC, eds. Lippincott, Williams, and Wilkins; 2006. [Google Scholar]
- 8. Erden A. Budd‐Chiari syndrome: a review of imaging findings. Eur J Radiol 2007;61:44‐56. [DOI] [PubMed] [Google Scholar]
- 9. Erturk SM, Mortelé KJ, Binkert CA, Glickman JN, Oliva MR, Ros PR, Silverman SG. CT features of hepatic venoocclusive disease and hepatic graft‐versus‐host disease in patients after hematopoietic stem cell transplantation. AJR Am J Roentgenol 2006;186:1497‐1501. [DOI] [PubMed] [Google Scholar]
- 10. Seo A, Kim H. Sinusoidal obstruction syndrome after oxaliplatin‐based chemotherapy. Clin Mol Hepatol 2014;20:81‐84. [DOI] [PMC free article] [PubMed] [Google Scholar]
- 11. Maffioloa C, Novellas S, Chevallier P, Brunner P, Mourou MY, Bruneton JN. Thrombophlebitis of the hepatic veins: complication of a Klebsiella liver abscess. Clin Imaging 2006;61:44‐56. [DOI] [PubMed] [Google Scholar]


