Watch a video presentation of this article
Watch the interview with the author
Abbreviations
- ALP
alkaline phosphatase
- ALT
alanine transaminase
- AST
aspartate transaminase
- CECT
contrast enhanced CT
- CT
computed tomography
- GGT
gamma-glutamyltransferase
- HCC
hepatocellular carcinoma
- MRI
magnetic resonance imaging
- MRCP
magnetic resonance cholangiopancreatography
- NAFLD
nonalcoholic fatty liver disease
- NASH
nonalcoholic steatohepatitis
- NECT
nonenhanced CT
- SAG
sagittal
- US
ultrasound
In the age of electronic health records, physicians have the opportunity to integrate data from a patient's clinical presentation, laboratory values, and imaging. The following guide provides imaging correlation for common patterns of liver enzyme abnormalities.
Patterns of Liver Enzyme Abnormalities
Liver enzyme abnormalities typically present in either of two patterns: hepatocellular injury or cholestasis. Hepatocellular injury is indicated by a disproportionate elevation of aspartate transaminase (AST) and alanine transaminase (ALT) relative to alkaline phosphatase (ALP), whereas cholestatic injury is indicated by a disproportionate elevation in ALP relative to AST and ALT.1 The main tool in the evaluation of liver enzyme abnormalities is abdominal ultrasound (US), with more in‐depth evaluation by computed tomography (CT), magnetic resonance imaging (MRI)/magnetic resonance cholangiopancreatography (MRCP), or cholescintigraphy as detailed later.
Hepatocellular Injury
Mild AST and ALT Elevations
Mild AST and ALT elevations (AST:ALT ≤1) are seen in several disease processes including chronic hepatitis B and C (Fig. 1), celiac disease (Fig. 2), alpha‐1‐antitrypsin deficiency (Fig. 3), nonalcoholic fatty liver disease (NAFLD), and infiltrative liver disease. Medications, hyperthyroidism, autoimmune liver disease, and metabolic/genetic diseases also result in this pattern.2
Figure 1.
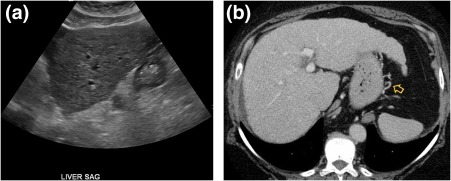
Chronic hepatitis C. (A) Ultrasound demonstrating hepatic surface nodularity and a coarsened echotexture, consistent with patient's biopsy‐proven cirrhosis. (B) CT in the same patient shows a hypertrophied left and caudate lobe, liver surface nodularity, and small perigastric varicosities (yellow arrow). SAG, sagittal.
Figure 2.
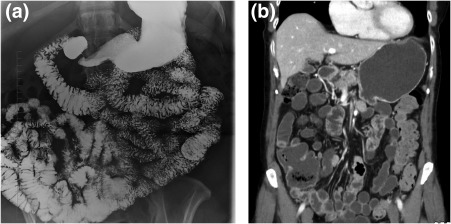
Celiac disease. (A) Small‐bowel follow‐through and (B) CT exhibiting reversal of the jejunoileal mucosal fold pattern, such that the jejunum has a decreased number of folds, whereas the ileum has an increased number of folds.
Figure 3.
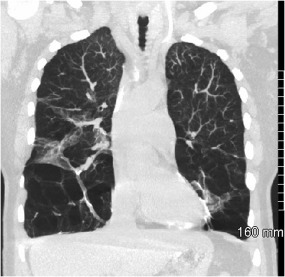
Alpha‐1‐antitrypsin deficiency. CT demonstrating severe basilar predominant paraseptal/centrilobular emphysema and scarring. Hepatic involvement may result in cirrhosis (not shown).
The primary hepatic sequela of the chronic viral hepatitides is fibrosis, which can progress to cirrhosis and portal hypertension. Imaging characteristics of cirrhosis include a nodular hepatic contour, widened fissures, an enlarged caudate lobe, ascites, varices, and splenomegaly.3 US is excellent for surveillance for hepatocellular carcinoma (HCC) in patients with chronic liver disease. New advances in US elastography have proven accurate in predicting significant hepatic fibrosis.4
NAFLD (Fig. 4) is highly prevalent, affecting 20% to 30% of adults, including 69% of individuals with type 2 diabetes and more than 90% of patients with severe obesity.5, 6, 7 There is no specific enzyme elevation pattern, although in general ALT is higher than AST and levels are rarely greater than 300 IU/L.1 US findings of hepatic steatosis manifest as coarsened echotexture and increased echogenicity of the liver.8 Diffuse hypoattenuation of the liver on nonenhanced CT (NECT) and a drop in signal intensity in the liver on out‐of‐phase MR sequence are compatible with intracellular lipid deposition.9 Some patients progress from NAFLD to nonalcoholic steatohepatitis (NASH), characterized by inflammation and fibrosis with potential to progress to cirrhosis (Fig. 5).1
Figure 4.

NAFLD. (A) Ultrasound demonstrates diffuse increased echogenicity and (B) CT demonstrates diffuse decreased attenuation. (C) in‐phase and (D) out‐of‐phase MR imaging exhibits diffuse, homogenous signal loss on out‐of‐phase images. SAG, sagittal.
Figure 5.
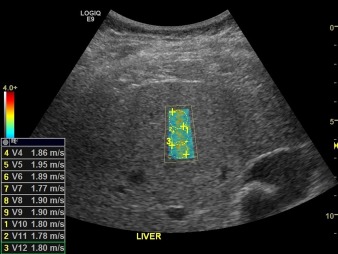
NASH. Shear wave elastography demonstrating elevated median velocity of 1.8 m/second, consistent with stage F3 fibrosis.
Other infiltrative diseases include HCC (Fig. 6), tuberculosis, metastasis, sarcoidosis (Fig. 7), amyloidosis, and hemochromatosis (Fig. 8).
Figure 6.
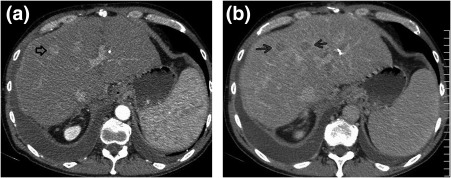
HCC. (A) Arterial‐phase CT shows a 14‐mm enhancing lesion (black open arrow) with capsular enhancement. There is washout on (B) venous phase in this and an adjacent lesion (black arrows).
Figure 7.
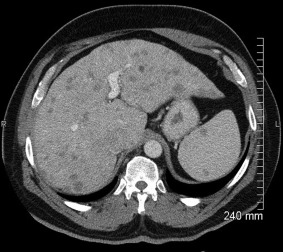
Sarcoidosis. CT exhibiting hepatomegaly with numerous small hypodense lesions in the liver and spleen.
Figure 8.

Hemochromatosis. (A) T2‐weighted MRI demonstrates diffuse low signal, whereas (B) out‐of‐phase and (C) in‐phase MRI exhibit loss of signal on the in‐phase images because of the longer TE.
The best imaging tools for detecting and characterizing HCC are multiphasic contrast‐enhanced CT (CECT) or MRI, which are often specific enough to guide therapy without tissue confirmation.10 HCC typically appears as heterogenous, hypervascular mass(es) on hepatic arterial phase with washout of contrast enhancement on delayed phase, with or without a pseudocapsule.10, 11 US has a lower sensitivity and specificity than CT/MRI and is predominantly used as a screening tool in high‐risk patients.10
In sarcoidosis, NECT may show scattered intrahepatic and intrasplenic hypoattenuating lesions that rapidly isoattenuate after contrast administration. MRI shows the granulomas as hypointense intrahepatic and intrasplenic nodules on T1 and T2.9
AST Predominant Mild AST and ALT Elevations
AST:ALT ≥1 is seen with cirrhosis, rhabdomyolysis, hemolysis, Budd‐Chiari syndrome (Fig. 9), and Wilson's disease (Fig. 10).
Figure 9.
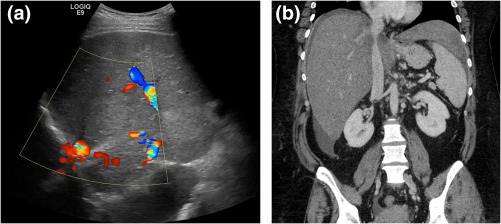
Budd‐Chiari syndrome. (A) Ultrasound illustrating nonvisualization of the hepatic veins, consistent with chronic occlusion. (B) CT demonstrating inferior vena cava (IVC) narrowing.
Figure 10.
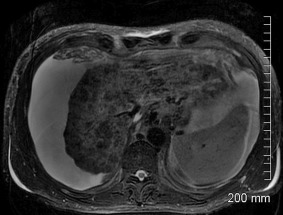
Wilson's disease. T2‐weighted MRI exhibiting a shrunken liver with severe parenchymal atrophy and nodular hypointense foci.
In Budd‐Chiari syndrome, alteration of venous drainage ultimately leads to peripheral hepatic atrophy and compensatory caudate lobe hypertrophy.9 The sensitivity of US in diagnosing hepatic vein thrombosis is high when relying on two criteria: visualized hepatic veins with no detectable flow or reversed flow or nonvisualization of the hepatic veins.8 CECT visualizes thrombotic material that either narrows or occludes the hepatic veins or shunts, and angiographic MRI can analyze flow and demonstrate flow reversal.9
Moderate and Severe AST and ALT Elevations
Moderate and severe AST and ALT elevations (5‐15× normal and >15× normal, respectively) may be seen in acute viral hepatitis, ischemia, and hepatotoxic drugs.1
Cholestasis
Conditions with direct hyperbilirubinemia include gallstone pancreatitis (Fig. 11) and acute cholecystitis (Fig. 12), which usually present with elevated AST, ALT, total bilirubin, and ALP, as well as chronic cholestasis, which presents with direct hyperbilirubinemia with elevated ALP, but normal or mildly elevated AST and ALT.12, 13 Other conditions with direct hyperbilirubinemia include local inflammation, heart and kidney failure, and gallbladder carcinoma (Fig. 13).12, 13
Figure 11.
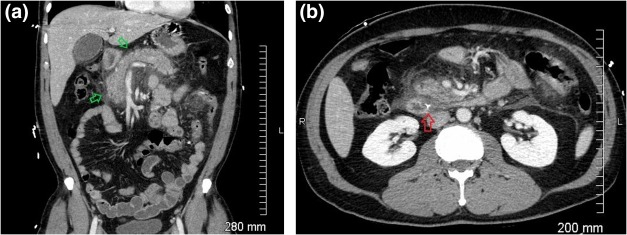
Gallstone pancreatitis. (A and B) CT demonstrating a calcified stone (B, red arrow) in the distal common bile duct near the sphincter of Oddi, peripancreatic fluid, and inflammatory stranding (A, green arrows).
Figure 12.
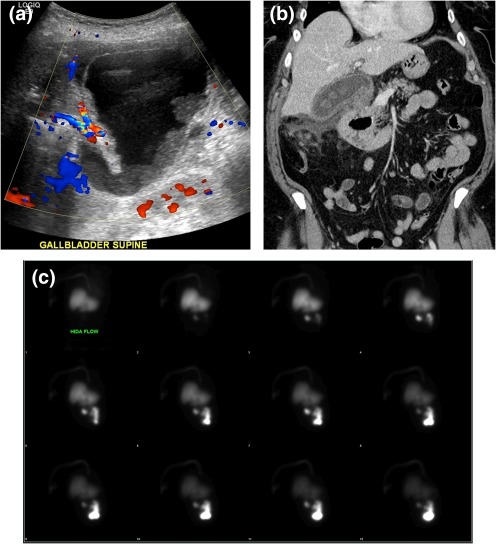
Acute cholecystitis. (A) Ultrasound demonstrating a distended gallbladder with wall thickening, dependent sludge, pericholecystic fluid, and hyperemia. (B) CT illustrates gallstones, gallbladder wall thickening, and pericholecystic fluid. (C) Nuclear medicine hepatobiliary scan (cholescintigraphy) shows normal uptake and excretion of radiotracer into the gastrointestinal tract. The gallbladder was not visualized at 2 hours, despite morphine augmentation.
Figure 13.
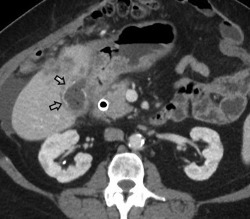
Gallbladder carcinoma. CT of a patient with biopsy‐proven gallbladder carcinoma demonstrates loss of the fat plane between the gallbladder and adjacent liver, and a thickened gallbladder wall with calcifications (black arrows).
Imaging in acute pancreatitis of less than 72 hours in duration is often unwarranted, because the diagnosis is made clinically and complications take time to manifest radiologically.14 When imaging is required, dual‐phase (arterial and venous) CECT is the best initial study. Acute interstitial pancreatitis is characterized by an enlarged and edematous pancreas with loss of normal fatty lobulation, peripancreatic fat stranding, edema and free fluid, although in mild pancreatitis imaging may be normal.14, 15 MRCP is helpful in assessing the integrity of the pancreatic duct and is very sensitive for gallstones and other biliary pathology that may cause pancreatitis.15 US evaluation for pancreatitis is usually limited because the pancreas is partially or completely obscured by overlying bowel gas, although it may be useful in confirming or excluding the presence of stones or biliary dilatation.15
The best initial imaging tool for acute cholecystitis is US.16 US findings include pericholecystic fluid/abscess, gallbladder distension (>4 cm), a thickened gallbladder wall (>3 mm), and wall edema.8, 17 Equivocal cases may be confirmed by cholescintigraphy where biliary excretion of radioisotope within 10 minutes without gallbladder accumulation within 1 hour is typical of acute cholecystitis. Imaging is usually continued for another 3 hours to exclude delayed filling, and morphine is administered to contract the sphincter of Oddi and encourage gallbladder filling.17 Cholescintigraphy has a sensitivity and specificity of 96% and 90%, respectively, in patients suspected of having acute cholecystitis.18
Consider hemolysis, Gilbert's syndrome, and fulminant Wilson's disease when more than 80% of total bilirubin is indirect (unconjugated) and ALP is relatively low.19 Also consider ineffective erythropoiesis, large hematoma resorption, and rhabdomyolysis.2, 13
Elevated ALP with normal bilirubin should prompt a search for ductal abnormalities as in primary biliary cirrhosis and primary sclerosing cholangitis, primarily with contrast‐enhanced MRCP.13 In addition, if ALP is elevated with normal gamma‐glutamyltransferase (GGT) and bilirubin, Paget's disease or metastatic prostate carcinoma should be considered.20
Conclusion
A solid understanding of imaging findings associated with common patterns of liver enzyme abnormalities allows the integration of radiology, clinical, and laboratory data to arrive at a more informed and comprehensive diagnosis.
Potential conflict of interest: Nothing to report.
REFERENCES
- 1. Kwo PY, Cohen SM, Lim JK. ACG Clinical Guideline: evaluation of abnormal liver chemistries. Am J Gastroenterol 2017;112:18‐35. [DOI] [PubMed] [Google Scholar]
- 2. Krier M, Ahmed A. The asymptomatic outpatient with abnormal liver function tests. Clin Liver Dis 2009;13:167‐177. [DOI] [PubMed] [Google Scholar]
- 3. Kreuer S, Elgethun M, Tommack M. Imaging findings of cirrhosis. J Am Osteopath Coll Radiol 2016;5:5‐13. [Google Scholar]
- 4. Barr RG, Ferraioli G, Palmeri ML, et al. Elastography assessment of liver fibrosis: Society of Radiologists in Ultrasound Consensus Conference Statement. Radiology 2015;276:845‐861. [DOI] [PubMed] [Google Scholar]
- 5. Neuschwander‐Tetri B. Non‐alcoholic fatty liver disease. BMC Med 2017;15:45. [DOI] [PMC free article] [PubMed] [Google Scholar]
- 6. Chalasani N, Younossi Z, Lavine JE, et al. The diagnosis and management of non‐alcoholic fatty liver disease: Practice Guideline by the American Association for the Study of Liver Diseases, American College of Gastroenterology, and the American Gastroenterological Association. Hepatology 2012;55:2005‐2023. [DOI] [PubMed] [Google Scholar]
- 7. Leite NC, Salles GF, Araujo ALE, Villela‐Nogueira CA, Cardoso CRL. Prevalence and associated factors of non‐alcoholic fatty liver disease in patients with type‐2 diabetes mellitus. Liver Int 2009;29:113‐119. [DOI] [PubMed] [Google Scholar]
- 8. Middleton W, Kurtz A, Hertzberg B. Liver. Ultrasound: the requisites. 2nd ed St. Louis, MO: Mosby; 2003:68‐77. [Google Scholar]
- 9. Boll DT, Merkle EM. Diffuse liver disease: strategies for hepatic CT and MR imaging. RadioGraphics 2009;29:1591‐1614. [DOI] [PubMed] [Google Scholar]
- 10. Willatt J, Ruma JA, Azar SF, Dasika NL, Syed F. Imaging of hepatocellular carcinoma and image guided therapies ‐ how we do it. Cancer Imaging 2017;17:9. [DOI] [PMC free article] [PubMed] [Google Scholar]
- 11. Wald C, Russo MW, Heimbach JK, Hussain HK, Pomfret EA, Bruix J. New OPTN/UNOS Policy for Liver Transplant Allocation: standardization of liver imaging, diagnosis, classification, and reporting of hepatocellular carcinoma. Radiology 2013;266:376‐382. [DOI] [PubMed] [Google Scholar]
- 12. Roche SP, Kobos R. Jaundice in the adult patient. Am Fam Physician 2004;69:299‐304. [PubMed] [Google Scholar]
- 13. Green RM, Flamm S. AGA technical review on the evaluation of liver chemistry tests. Gastroenterology 2002;123:1367‐1384. [DOI] [PubMed] [Google Scholar]
- 14. Zhao K, Adam SZ, Keswani RN, Horowitz JM, Miller FH. Acute pancreatitis: revised Atlanta classification and the role of cross‐sectional imaging. Am J Roentgenol 2015;205:W32‐W41. [DOI] [PubMed] [Google Scholar]
- 15. Busireddy KK, AlObaidy M, Ramalho M, et al. Pancreatitis‐imaging approach. World J Gastrointest Pathophysiol 2014;5:252‐270. [DOI] [PMC free article] [PubMed] [Google Scholar]
- 16. Yarmish GM, Smith MP, Rosen MP, et al. ACR appropriateness criteria right upper quadrant pain. J Am Coll Radiol 2014;11:316‐322. [DOI] [PMC free article] [PubMed] [Google Scholar]
- 17. O'Connor OJ, Maher MM. Imaging of cholecystitis. Am J Roentgenol 2011;196:W367‐W374. [DOI] [PubMed] [Google Scholar]
- 18. Kiewiet JJS, Leeuwenburgh MMN, Bipat S, Bossuyt PMM, Stoker J, Boermeester MA. A systematic review and meta‐analysis of diagnostic performance of imaging in acute cholecystitis. Radiology 2012;264:708‐720. [DOI] [PubMed] [Google Scholar]
- 19. Limdi JK, Hyde GM. Evaluation of abnormal liver function tests. Postgrad Med J 2003;79:307‐312. [DOI] [PMC free article] [PubMed] [Google Scholar]
- 20. Burke MD. Liver function: test selection and interpretation of results. Clin Lab Med 2002;22:377‐390. [DOI] [PubMed] [Google Scholar]


