

Abstract
Oxidative stress is an important contributor to the pathogenesis of many retinal diseases including age-related macular degeneration and retinal dystrophies. Light-induced retinal degeneration (LIRD) can serve as a model in which to study the response of the retina to stress. Of note, many genetic mutant mice are in a C57BL/6J background and are thus resistant to the usual LIRD models. We recently developed a new model of fundus camera-delivered light- induced retinal degeneration (FCD-LIRD) which is effective in strains of mice expressing the light-resistant variant of RPE65 (450Met), including C57BL/6J. In this work we investigated whether FCD-LIRD would be useful as a model in which to test the effect of genetic mutations on the response of the retina to stress. Furthermore, we tested whether oxidative stress plays an important role in the setting of this new FCD-LIRD model. FCD-LIRD was applied to C57BL/6J mice and to mice simultaneously deficient in three proteins that are important in the response of the retina to oxidative stress (SOD1, DJ-1 and Parkin). Using fundus photography, we found that retinal damage was dramatically increased in the SOD1/DJ-1/Parkin deficient mice compared to C57BL/6J. Outer retinal OCT volume and RPE cell morphology analysis in ZO-1-stained flat mounts added support to these findings. Gene expression analysis confirmed a strong oxidative stress response after FCD-LIRD, which was differentially altered in the SOD1/DJ1/Parkin deficient mice. We conclude that FCD-LIRD is useful to study the effect of genetic mutations on the response of the retina to light stress in light-resistant strains of mice. Furthermore, oxidative stress seems to be an important component of FCD-LIRD. Finally, we have established protocols to quantify the effect of FCD-LIRD on the retina and RPE which will be useful for future studies. Further dissection of the mechanisms by which the retina responds to light-induced oxidative stress may result in new strategies to modulate this response, which could lead to a reduction in retinal and RPE damage.
Keywords: Light induced retinal degeneration, oxidative stress, RPE65, Met450, OCT volume, RPE morphology, retina
1. Introduction
The retina is in a highly pro-oxidant environment due to the combination of high levels of light absorption, high oxygen tension and high concentration of oxidizable lipids. In fact, there is evidence supporting a role for oxidative stress in many retinal diseases including age-related macular degeneration (Aredo et al. 2015; Brantley et al., 2012; Ding et al., 2009; Hollyfield et al., 2008; Rohrer et al., 2016; Shaw et al., 2012; Shen et al., 2007; Weismann et al., 2011; Zhao et al., 2011;) and retinal dystrophies (Campochiaro et al., 2015; Komeima et al., 2006; Punzo et al., 2012). The possible role of light as a stressor in retinal diseases has generated great interest (Delcourt et al., 2014; Paskowitz et al., 2006; Tomany et al., 2004; White et al., 2007). In fact, light-induced retinal degeneration (LIRD) has been a useful model to study mechanisms of disease in the retina (Hadziahmetovic et al., 2012; Joly et al., 2009; O’Koren et al., 2016; Rohrer et al., 2007; Song D et al., 2012; Wenzel et al., 2005; Zheng et al., 2006). Although very informative, most LIRD studies have been done on albino mice and rats, which develop severe retinal degeneration after just 1 h of exposure to only 5,000 lux of light. This is just a fraction of the light that we humans are exposed to daily. As a reference, the light intensity on a sunny day is 10,000–20,000 lux in the shade, and up to 100,000 lux in direct sunlight. In humans, the retina is exposed to varying levels of light for an average of 16 hours a day every day (Monk et al., 2000).
Mice expressing the Leu450Met variant of RPE65 are resistant to LIRD (Wenzel et al., 2001). Resistant mice include C57BL6/J (B6J) mice and genetically-modified mice on a B6J background. The level of susceptibility to light injury in humans is more similar to that of C57BL/6J mice. Since the molecular mechanisms of cell death and of oxidative stress response may vary in the setting of a higher resistance to light damage, we believe that studying LIRD in resistant mice is relevant. We recently described a new model of fundus camera-delivered LIRD (FCD-LIRD) which is fast, reproducible, and effective in RPE65 450Met mice (Zhong et al., 2016). Another model of LIRD was reported recently in Leu450Met B6J mice (Natoli et al., 2016). That model relies on a similar light intensity compared to our FCD-LIRD model, but still uses a cage system and applies the light stimulus over a 1d to 7d period.
In this work our goal was to evaluate the importance of oxidative stress in the development of FCD-LIRD in mice expressing the light-resistant variant of RPE65 (450Met). We analyzed the retinal changes seen after FCD-LIRD in mice simultaneously deficient in SOD1, Parkin and DJ-1 in comparison to B6J control mice. These three proteins have been shown to be active in the retina and to regulate oxidative stress in the retinal environment (Bonilha et al., 2017; Bonilha et al., 2015; Dong et al., 2006; Esteve-Rudd et al., 2010; Hashizume et al., 2008; Shadrach et al., 2013). In addition to fundus changes, we evaluated the effect of FCD-LIRD in outer retinal volume by OCT. We also examined gene expression changes and looked at the effect on RPE morphology.
2. Methods
2.1. Animals and Genotyping of Mice
All animal experiments complied with the National Institutes of Health guide for the care and use of Laboratory animals and were done in accordance with the ARVO Statement for the Use of Animals in Ophthalmic and Vision Research. All procedures were approved by the UT Southwestern Medical Center Institutional Animal Care and Use Committee (Protocol # 2015–100937). Six to ten week old male and female SOD1/DJ1/Parkin triple KO mice, and age- and gender-matched C57BL/6J mice (“B6J”; Jackson Laboratory, Bar Harbor, ME, USA) were used in the experiments. SOD1/DJ1/Parkin KO mice (“triple KO” or “TKO”) were kindly provided by Matthew Goldberg, PhD. Knock out lines had been backcrossed to C57BL/6J mice for 10 generations (personal communication: Matthew Goldberg 2013). However, upon receiving the mice, genotyping and sequencing for the RD8 mutation of the Crb1 gene (Luhmann et al., 2009; Mattapallil et al., 2012) revealed some expression of this mutation in the knock-out lines. The lines were thus back-crossed to C57BL/6J mice for three generations and then intercrossed to generate SOD1/DJ1/Parkin triple KO mice. Further genotyping and sequencing confirmed the absence of both the RD8 mutation and also the 450Leu variant of RPE65 in the resulting mice. For RPE65 sequencing we used the following primers to amplify a 326 bp genomic DNA fragment containing the region coding for the Leu450Met variants: forward primer-CGGACTTGGGTTGAATCACT, and reverse primer- GCCCAACCCCTTTCCTAATA. The PCR product was purified using ExoSAP-IT PCR Product Cleanup (Affymetrix P/N, 78201). Forward primer (5 μl) was then added for a final concentration of 6 μM. The sample was then processed by the UT Southwestern Sanger Sequencing Core.
Mice were acclimated to our animal facility for at least 1 week before being used for experiments. Mice were bred and kept in a barrier animal facility at UTSW under normal lighting conditions with 12-hour-on/12hour-off cycles. Before performing all procedures, mice were anesthetized with a ketamine-xylazine cocktail (100mg/kg-5mg/kg) one at a time. Mouse eyes were dilated using one drop per eye of tropicamide 1% solution (Alcon Laboratories, Inc., Fort Worth, TX, USA) and phenylephrine hydrochloride 2.5% solution (Alcon, Inc. Lake Forest, IL, USA).
2.2. Fundus Photography
Fundus photographs of mice were obtained using a Micron IV mouse fundus camera (Phoenix Research Laboratories, Pleasanton, CA, USA) as described before (Ufret-Vincenty et al., 2010). Images centered on the optic nerve head were obtained.
2.3. Light Exposure
Following overnight dark adaptation, each mouse was anesthetized and the pupils dilated. Light intensity from the Micron IV mouse fundus camera was measured using a light meter (Fisher Scientific, Cat # S90199) to ensure that equal illumination was provided to all eyes. The eye was centered as described before (Zhong et al., 2016). For the “Light-only” model of light injury, the Micron IV fundus camera was focused on the RPE layer and light was applied to the retina at an intensity of 100,000 lux for a one time exposure of 30 min. This intensity was lower than the 125,000 lux that we used in our prior work (Zhong et al. 2016), because we wanted to increase our chances of detecting a differential effect in the experimental vs. control mice. Of note, we have not seen any heat damage to anterior segment structures in over 300 mice that have been treated in our laboratory with the FCD-LIRD model, even at the 125,000 lux level. The image was monitored to ensure that focus and centration were maintained during the entire application time. For the fluorescein-assisted model, fluorescein was administered as a single intraperitoneal injection of 100 μl of a 1:5 dilution of commercially available 10% fluorescein solution (total dose of 2mg of fluorescein). Light was then applied at an intensity of 54,000 lux for 4 min. The illumination was started 3 min after the fluorescein injection (Fl-4@3Light). Mice were kept under normal lighting conditions after the procedure.
2.4. OCT Volume
Mice were anesthetized and the pupils were dilated. GenTeal liquid gel (Novartis, East Hanover, NJ) was applied to the corneal surface. Optical Coherence Tomography images were taken using an image-guided tomographer (Micron IV-OCT2; Phoenix Research Laboratories, Pleasanton, CA, USA), and OCT volume was measured from a block of retinal images using the Reveal OCT2 system. In brief, a 3D volume image was captured in a standard square region generated by the system (approximately 5 DD × 5 DD in size) centered on the optic nerve head (ONH). The images were then opened with InSight 3D Voxeleron software for the quantitative assessment of the specific outer retinal regions. The software allows the investigators to manually identify the retinal layers of interest in six computer-generated views: one horizontal, one vertical, two diagonal, an inner circle and an outer circle. It then uses that information to perform the segmentation in the entire block of images and calculate a segmentation volume. This process allows for the determination of the volume of tissue between two specified layers, and also as a consequence, the elimination of the optic disc region from the analysis. Of note, prior work using the Spectralis OCT to measure segmented OCT volumes in mice has shown that manual segmentation protocols are more accurate than fully automated protocols (Dysli et al., 2015). Finally, the data were exported to excel worksheets for quantitative analysis.
2.5. ZO-1 staining, imaging and analysis of RPE flat mounts
2.5.1. Preparing RPE flat mounts and staining the cells with ZO-1:
After marking the superior aspect of the cornea for orientation, eyes were collected from FCD-LIRD-treated and control mice. Each eye was then fixed in 4% PFA for 1 hr at room temperature, followed by 3 × 10min washes in 1x PBS. The anterior segment (cornea, iris and lens) was removed by cutting around the limbus, and the retina was peeled away from the RPE-choroid. After making 4–6 cuts from the edge to the center to flatten it, the remaining RPE-choroid-sclera was incubated in blocking buffer (5% BSA, 0.3% Triton X-100) for 2 h on a rocking shaker. This was followed by incubation in ZO-1 primary antibody (diluted 1:100 in 1% BSA, 0.3% Triton X-100) overnight at 4°C on a rocking shaker. After washing 3 × 10 min in 1x PBS, the tissues were incubated with appropriate secondary antibody (diluted in 1% BSA, 0.3% Triton X-100) for 2 h at RT on a rocking shaker. Following 3 × 10min washes in 1x PBS, the tissues were placed with the RPE facing up on glass slides using fluorescent mounting medium with DAPI. A coverslip was carefully placed (trying to minimize trapped air bubbles), resulting in the RPE flat mount.
2.6. Imaging and quantification of RPE cell morphology
We used CellProfiler software to analyze RPE cell morphology, after modifying previously published protocols (Boatright et al., 2015; Bray et al., 2015; Chalfoun et al., 2014). In brief, Z- stack images of the RPE cells were taken with a water immersion objective at 25x magnification using a Leica TCS SP8 confocal laser scanning microscope equipped with a Leica Application Suite X, LAS X, software (Leica Microsystems Inc.). Four central images were taken; two superiorly and two inferiorly each at 1 disc diameter distance from the center of the ONH. Each image was opened in ImageJ/Fiji software to obtain a maximal projection which was then changed to gray scale, inverted and printed out. For each image the cell boundaries were manually traced onto plastic film cover from the print out to get a clear outlines of RPE cells. The plastic film was scanned and saved as electronic attachment. The attachment was opened in ImageJ to smooth the boundaries and re-saved as a TIFF image file into a CellProfiler Project input folder for quantitative analysis. The input folder was opened in CellProfiler program for cell Area/Shape and other morphometry analyses using a special pipeline (see Supplementary File 1).
2.7. RNA isolation from posterior eye cups
After anesthesia, enucleation and removal of the anterior segment, the posterior eye cup (including the retina and RPE) was rinsed in 1xPBS. RNA was immediately isolated using the miRNeasy Mini Kit (QIAGEN Cat # 217004). In brief, 1 ml of QIAzol Lysis Reagent (QIAGEN Cat # 79306) was added to individual posterior eye cups in 1.5 ml centrifuge tubes and the samples were homogenized with a Bio-Gen PRO200 Homogenizer (PRO Scientific Inc.). After adding 200 μl of chloroform (Sigma-Aldrich, Cat # C2432), the tubes were shaken by hand for 15 seconds. After 2 minutes, the samples were transferred to a Phaselock Gel tube (5 PRIME, Cat # 2302830) and centrifuged for 15 minutes at 13000 rpm (18500 rcf). The supernatant was transferred to a new tube, and 100% ethanol (1:1 volume) was added. The entire sample was transferred to an RNeasy Mini Spin Column and processed according to the QIAgen protocol. The RNA was eluted with RNase-free water. The RNA quality was checked using an Agilent bio-analyzer and samples with an RNA integrity number (RIN) of above 9 were used for further testing.
2.8. Real-Time Quantitative RT-PCR (qPCR)
Genes for qPCR testing (Supplementary File 2: Table S1) were chosen based on a pilot screen (data not shown) on a Mouse Signal Transduction PathwayFinder RT2 profiler PCR Array (QIAGEN Cat # 330231 PAMM-014ZA). The Signal Transduction PathwayFinder RT2 Profiler PCR Array contains 84 genes. We obtained a modified version in which we requested to add Stat3 to the panel. We did this based on our prior results that indicated an increase in Stat3 after FCD-LIRD (see Zhong et al. 2016). We ran two pilot experiments on the array. Combining the two experiments we identified a total of 30 genes that showed a greater than two fold change in expression 4 hours after FCD-LIRD. We selected 14 genes that showed very similar results in the two pilot studies for further confirmation using qPCR analysis. For qPCR testing, 5 μg RNA were first reverse transcribed using the QIAGEN RT2 First Strand Kit (QIAGEN Cat # 330404). The iTaq™ Universal SYBR® Green Supermix (BioRad Cat # 172–5121) was then used in the qPCR reaction with 4 ng cDNA per well. Singlet qPCR reactions were run in triplicate in the ABi QuantStudio™ 6 Real-Time PCR machine at 50°C for 2 minutes, 95°C for 10 minutes, followed by 40 cycles of 95°C for 15 seconds and 60°C for 1 minute. Primers are shown in Supplementary File 2: Table S1. GAPDH served as an endogenous reference gene. The results are based on the calculation of ΔCt (Ct of the gene of interest – Ct of GAPDH). The fold changes in the expression of target genes were calculated using the following formula: Fold Change = 2−ΔΔCt.
2.9. Statistical analysis
SigmaPlot 11.0 (Systat Software, Inc., San Jose, CA, USA) was used for statistical analysis. Data are presented as the mean +/− standard error of mean (SEM). A two-tailed Student’s t-test or the Mann-Whitney U-test was performed when comparing two groups. A p value < 0.05 was considered to be statistically significant.
3. RESULTS
3.1. Mice simultaneously deficient in oxidative stress response proteins SOD1, DJ1 and Parkin (TKO mice) demonstrate increased susceptibility to FCD-LIRD
Having previously found that the model of fundus camera-delivered light-induced retinal degeneration (FCD-LIRD) causes apoptosis and retinal thinning in C57BL/6J mice (Zhong et al., 2016), we wanted to determine how relevant the oxidative stress response is in this process. We took advantage of mice deficient in three oxidative stress response proteins known to be expressed and active in the retina: superoxide dismutase 1 (SOD1), DJ-1 (encoded by the Park7 gene) and Parkin (encoded by the Park2 gene). We exposed young (6–10 wk) SOD1/DJ- 1/Parkin triple KO (TKO) and age and gender-matched B6J mice to FCD-LIRD. Our hypothesis is that FCD-LIRD is mediated by oxidative stress and thus a deficit in oxidative stress response proteins should lead to increased retinal degeneration. We chose to use two levels of severity of FCD-LIRD (Zhong et al.,2016): a “light-only” model which leads to mild LIRD (see methods ; in Figure 1, compare panels G,H,I,L,M,N to A,B,C), and a “fluorescein-assisted” model that leads to a moderate LIRD (see methods ; in Figure 1, compare panels R,S,T to A,B,C). For the “light-only” model we used a lower light intensity than in our prior work (100 Klux instead of 125 Klux; Zhong et al., 2016) in order to try to maximize our ability to detect any differential effect on the two groups of mice. Two separate experiments confirmed that the light-only model led to a marked increase in the clinically visible LIRD in TKO mice compared to B6J (B6J, n=6; TKO, n=5; in Figure 1, compare panels J,K,O,P,Q to G,H,I,L,M,N). This finding was also confirmed in the “fluorescein-assisted” model of FCD-LIRD (B6J, n=3; TKO, n=3; in Figure 1, compare panels U,V,W to R,S,T).
Figure 1.
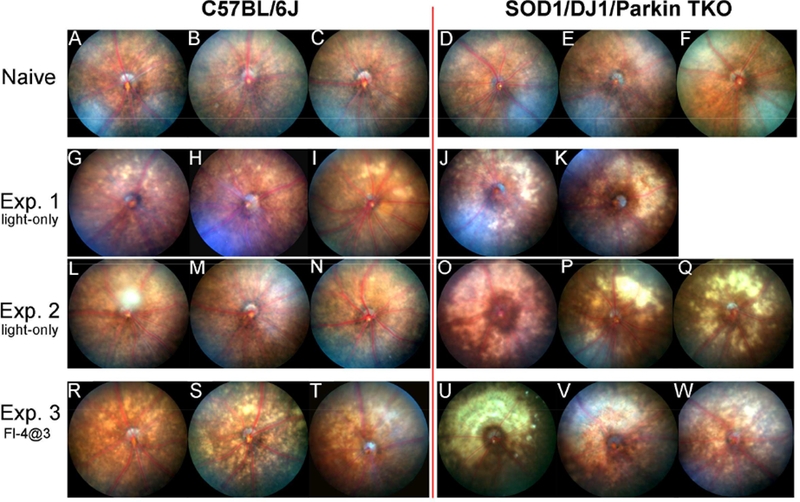
Mice simultaneously deficient in SOD1, DJ-1 and Parkin (triple KO, TKO) have a marked increase in retinal injury after exposure to the fundus camera-delivered light induced retinal degeneration (FCD-LIRD) models, when compared to C57BL/6J mice. Fundus photos were obtained at baseline (A-F) or 5 days after light exposure (G-W). In experiment 1 (G-K) and experiment 2 (L-Q) eyes were exposed to the light-only protocol (30 min of 100 Klux of white light). In experiment 3 (R-W), eyes were exposed to a fluorescein-assisted protocol (2mg of fluorescein i.p., followed 3 min later by a 4 min exposure to 54 Klux of white light).
3.2. Light-induced retinal degeneration can be quantified using OCT volume analysis of the outer retina and is more pronounced in TKO mice
While we had previously shown that FCD-LIRD induces OCT changes that can be quantified in individual B-scan images (Zhong et al., 2016) in order to compare and quantify the degeneration in different genetic mice in which both strains are exposed to FCD-LIRD we needed a parameter that would include a larger portion of the treated retina. In the Micron OCT2 system, OCT volume can be obtained in a square region (approximately 5DD × 5DD; see Figure 2A). This square is included in the area of light treatment in the FCD-LIRD models. The volume between any two layers of the retina can be obtained. Since most of the retinal changes (particularly in the lower intensity FCD-LIRD models that we chose to use in this work) occur in the outer retina, we decided to start by calculating the OCT volume between the external limiting membrane (ELM) and the outer aspect of the RPE hyper-reflective band (for simplicity, we refer to this as Bruchs’ membrane or BM; see Fig. 2B,C,D) in a 5 DD × 5 DD square centered on the ONH. The “BM to ELM” OCT volume in TKO mice (n=4) was similar to B6J (n=6) mice at baseline (Fig. 2E). However, 5 d after “light-only” FCD-LIRD there was a statistically significant decrease in the outer retinal OCT volume in TKO (n=4) compared to B6J (n=4) mice (Fig. 2F). Even 15 days after the treatment, the difference was significant (Fig. 2G). To confirm our findings, we also measured the OCT volume when measured from the top of the outer plexiform layer (OPL) to the bottom of the RPE hyper-reflective band (“BM to OPL”, Fig. 2B, 2E, 2H). At baseline, there was no difference in the BM to OPL volume when comparing B6J (n=6) and TKO (n=4) mice (Fig. 2E). However, 5 days after FCD-LIRD we could again see a significant difference between TKO and B6J mice (Fig. 2H). We confirmed our findings using the “fluorescein-assisted” FCD-LIRD model: we also found a decrease in the OCT volume in TKO mice (n=3) compared to B6J mice (n=5), using either the “BM to ELM” (Fig. 2I) or the “BM to OPL” parameter (Fig. 2J).
Figure 2.
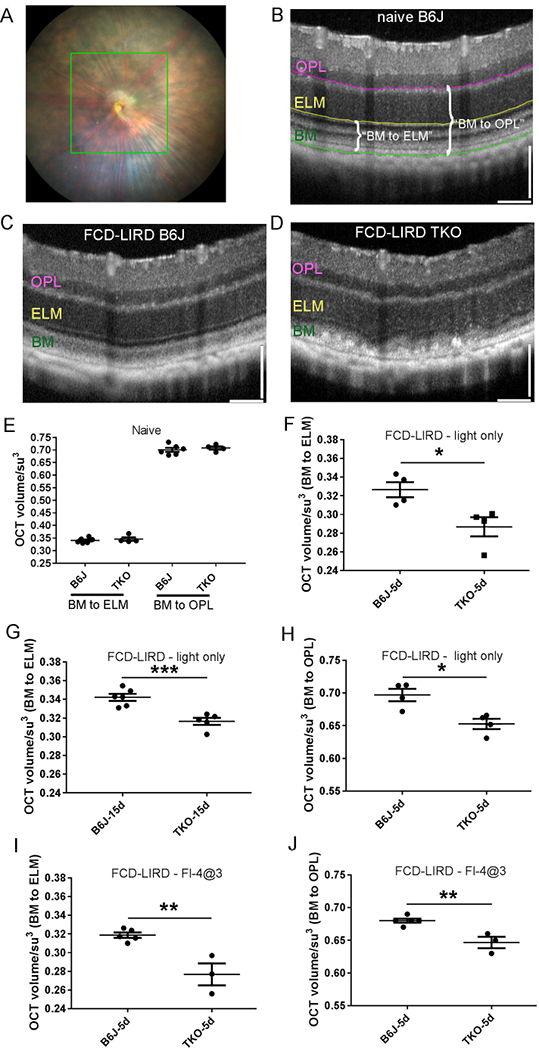
Fundus camera-delivered light induced retinal degeneration (FCD-LIRD) leads to a significant decrease in outer retinal OCT volume in SOD1/DJ1/Parkin-deficient mice (TKO mice) compared to C57BL/6J (B6J). The OCT volume was measured in a 5 disc diameter by 5 disc diameter square centered on the optic nerve head (A). Representative OCT images at baseline (B) and after FCD-LIRD (C, D) are shown. Measurements were made either from the external limiting membrane to the outer aspect of the RPE hyper-reflective band (“BM to ELM”; see E, F, G, I), or from the top of the outer plexiform layer to the bottom of the RPE hyper-reflective band (“BM to OPL”; see E, H, J). A statistically significant decrease in outer retinal volume was seen both after the “light-only” FCD-LIRD protocol (30 min of 100 Klux of white light; see F, G, H), and after the “fluorescein-assisted” FCD-LIRD model (2mg of fluorescein i.p., followed 3 min later by a 4 min exposure to 54 Klux of white light; see I, J). Each symbol represents one eye (one eye per mouse was treated in each experiment). * = p<0.05, ** = p<0.01, *** = p<0.001
3.3. ZO-1 staining of RPE flat mounts demonstrates increased damage of RPE cells in TKO mice
We also evaluated the effect of the FCD-LIRD on the RPE by preparing RPE flat mounts and staining for ZO-1. RPE cell size and morphology was similar in B6J and TKO mice at baseline (Fig. 3 A,B). On the other hand, in TKO mice, the “light-only” protocol, led to an increase in RPE cell size compared to B6J mice (Fig. 3D vs. 3C). Cell morphology was also altered, demonstrating loss of the regular hexagonal pattern. The changes were even more pronounced in the fluorescein-assisted model of FCD-LIRD (Fig. 3F vs. 3E).
Figure 3.
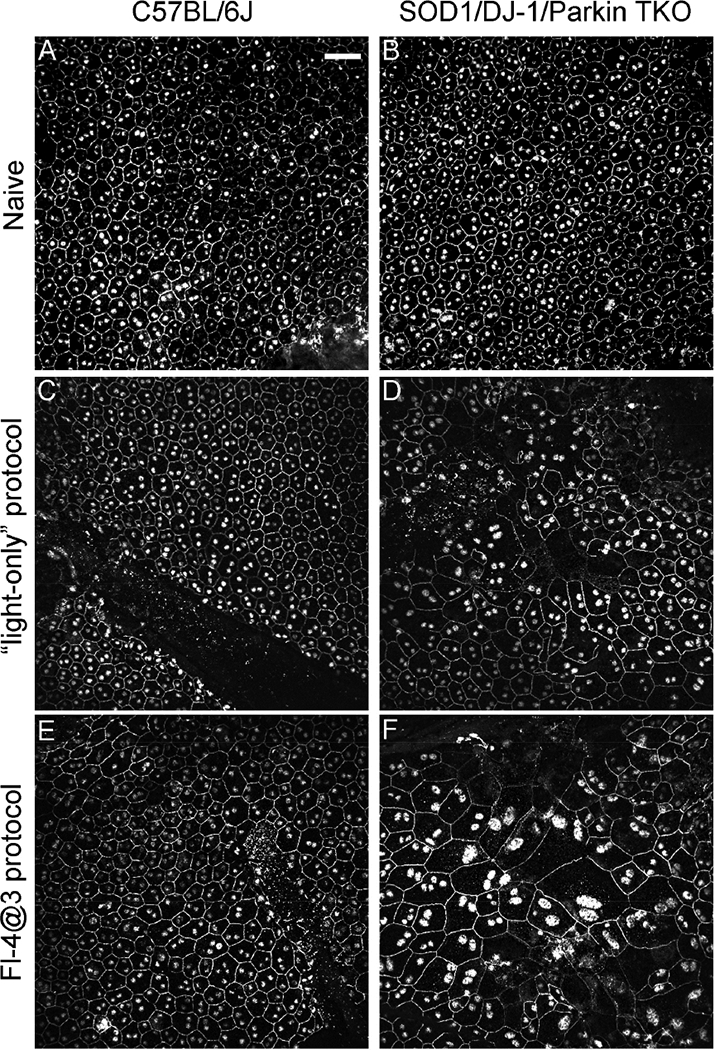
Fundus camera-delivered light induced retinal degeneration leads to more pronounced changes in size and morphology in the RPE cells of SOD1/DJ-1/Parkin-deficient mice (TKO mice) compared to C57BL/6J mice. RPE flat mounts of naive eyes (A,B), eyes treated two weeks earlier with the “light-only” FCD-LIRD protocol (C,D) or the “fluorescein- assisted” (Fl-4@3) FCD-LIRD protocol (E,F) were stained with ZO-1. FCD-LIRD led to increase cell size and increased irregularity in cell shape in both C57BL/6J (A,C,E) and TKO (B,D,F) mice. However, the changes were more prominent in the TKO mice. Scale bar = 50 μm
In order to quantitate these observations, we used modifications (see Supplementary File 1) of previously published CellProfiler pipelines (Boatright et al., 2015; Bray et al., 2015; Chalfoun et al., 2014) to analyze the RPE flat mounts (Fig.4). Examples of CellProfiler- identified RPE cell outlines (4A), and cell segmentation (4B) are shown.
Figure 4.
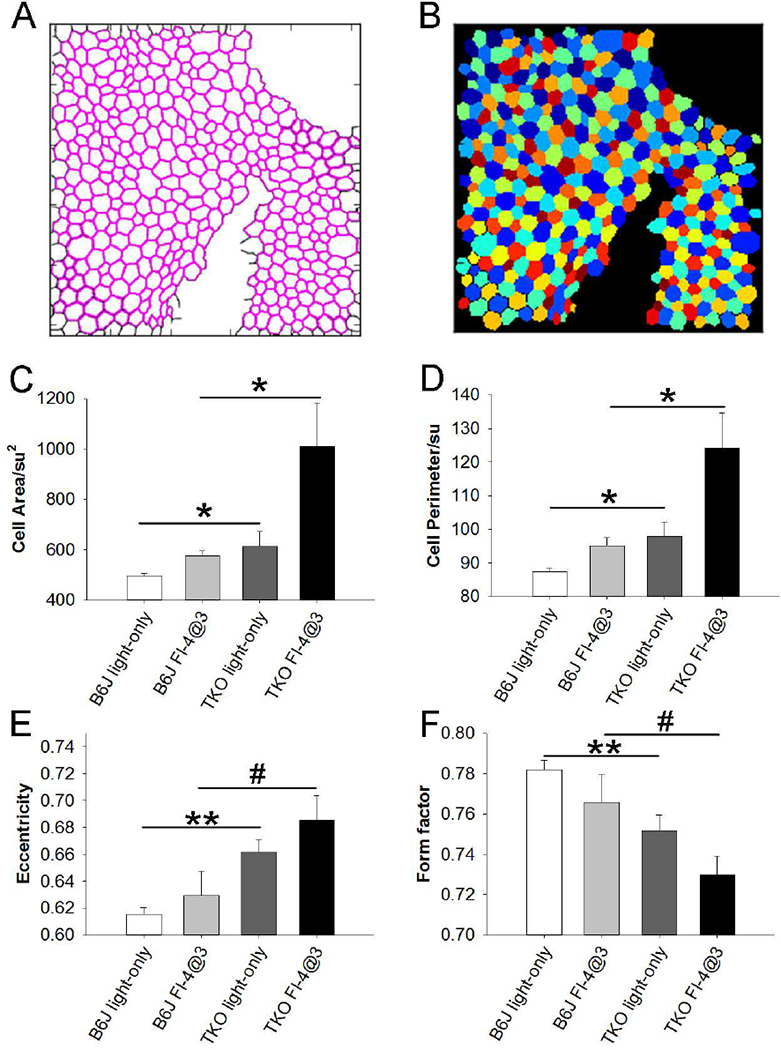
Following the application of fundus camera-delivered light induced retinal degeneration (FCD-LIRD), quantitative analysis (CellProfiler) of RPE cell size and RPE cell morphology in ZO-1-stained RPE flat mounts showed a significant increase is RPE cell size and RPE cell irregularity in SOD1/DJ-1/Parkin-deficient mice (TKO) compared to C57BL/6J mice (B6J). Examples of CellProfiler-identified RPE cell outlines (A), and cell segmentation (B) are shown. In cell segmentation, the colors are randomly assigned, with the only purpose of easily distinguishing neighboring cells. The analysis for cell area (C), cell perimeter (D), eccentricity (E) and form factor (F) are also shown. Eyes were analyzed after either the “light-only” FCD- LIRD protocol (C57BL/6J: n = 7; SOD1/DJ-1/Parkin-deficient mice: n = 5) or after the “fluorescein-assisted” FCD-LIRD protocol (C57BL/6J: n = 6; SOD1/DJ-1/Parkin-deficient mice: n = 6). * = p<0.05, ** = p<0.01, # = approaching significance, p<0.055
For these quantitative experiments we again used both the “light-only” FCD-LIRD protocol (B6J, n=7; TKO, n=5), and the “fluorescein-assisted” FCD-LIRD protocol (B6J, n=6; TKO, n=6). Since our goal was to differentiate the response to FCD-LIRD in TKO vs. B6J mice, we once more used the lower intensity protocols (relative to our previous work in Zhong et al., 2016) described above. We had already shown that the “light-only” protocol used here led to minimal changes in B6J mice, while the “fluorescein-assisted” protocol led to a mild-moderate effect (see Fig. 1). In a preliminary experiment measuring RPE cells (data not shown), we confirmed that we achieved this goal also with regards to the effect on RPE cells. There was only a non-statistically significant trend towards increased RPE cell area in B6J mice after the “light-only” protocol, but a statistically significant increase in RPE cell area (p=0.01) after the “fluorescein-assisted” protocol.
Using these lower intensity protocols we found that the RPE cell area was significantly increased in TKO compared to B6J mice (Fig. 4C). This was the case even in the “light-only” FCD-LIRD model. The difference became more prominent after the fluorescein-assisted protocol was applied (Fig. 4C). The same statistically significant changes between TKO and B6J mice were seen when using the RPE cell perimeter as a correlate of cell size (Fig. 4D).
In order to quantitate cell morphology, two parameters were used: eccentricity (Fig. 4E) and form factor (Fig. 4F). The MeasureObjectSizeShape module of the CellProfiler pipeline calculates morphological features of each identified object (e.g. RPE cells) on the analyzed images. The eccentricity of a created best-fitting ellipse (with the same second moment of area as the original object region) is the ratio of the distance between the foci of the ellipse and its major axis length. It has a value between 0 and 1, (an ellipse whose eccentricity is 0 is a perfect circle). The FormFactor is calculated as 4*π*Area/Perimeter2 (it equals 1 for a perfectly circular object). Therefore, the higher the value of the eccentricity, or the lower the value of the form factor, the further a cell shape is from a circle (cell is more irregular). There was a statistically significant increase in eccentricity (and decrease in form factor) in TKO compared to B6J after the “light-only” FCD-LIRD protocol. Both of these changes indicate increased morphological disruption (irregularity) in TKO compared to B6J. There was also a strong trend (p=0.053 for eccentricity and p=0.055 for form factor) after the fluorescein-assisted protocol.
3.4. Gene expression changes demonstrate a strong activation of the oxidative stress response after FCD-LIRD
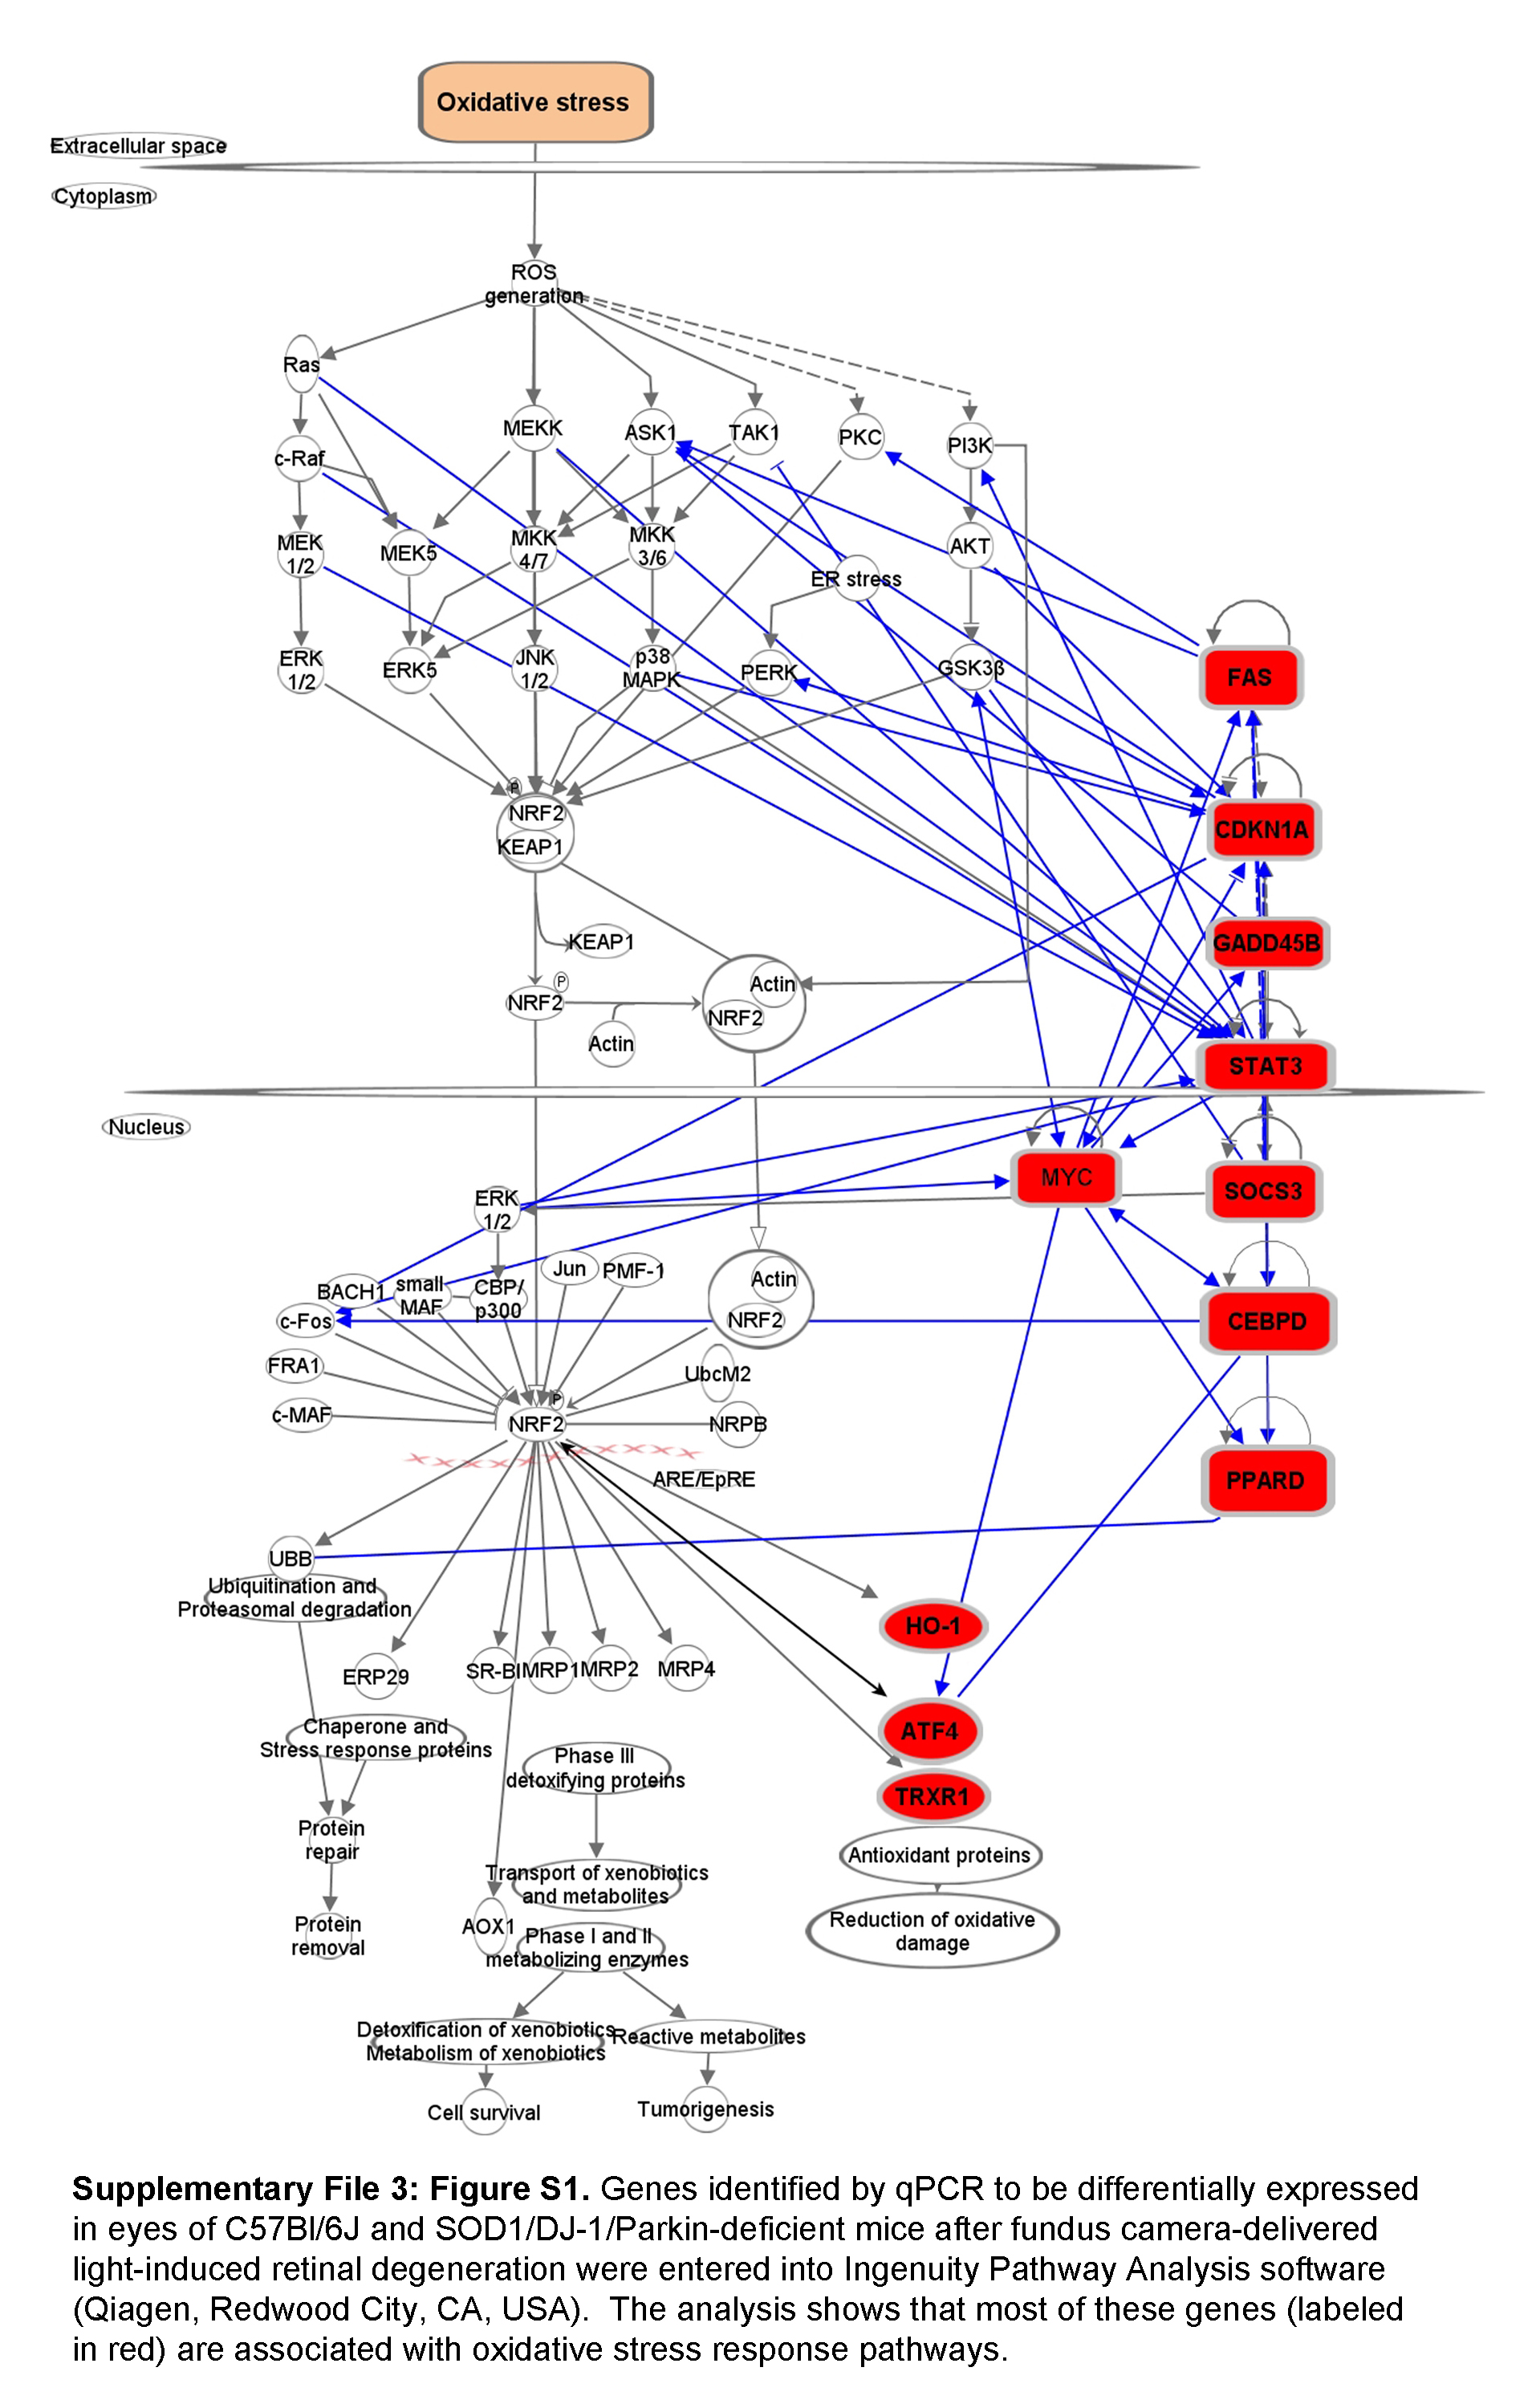
In order to evaluate the signaling that occurs in the retina after FCD-LIRD, we isolated RNA from the posterior eye cups (including the retina and RPE) of eyes 4h and 24h after treatment. We screened the samples with a Mouse Signal Transduction PathwayFinder RT2 profiler PCR Array, and then selected genes that appeared to be activated 4h after treatment for qPCR confirmation. For the analysis, eyes were collected from naive mice (B6J, n=8 eyes; TKO, n=5 eyes), from treated mice 4h after FCD-LIRD (B6J, n=5; TKO, n=4), and from treated mice 24 h after FCD-LIRD (B6J, n=4 eyes; TKO, n=5 eyes). In general, the pattern of genes that were upregulated after FCD-LIRD was remarkably similar in B6J mice and TKO mice (Fig. 5). Many of these genes increase 4h after the stimulus, but move back towards baseline 24 h after the stimulus. The genes involved would suggest the activation of several signaling pathways including: TGF-β pathway (Atf4, Gadd45b and Myc), Stat3 pathway (Cebpd, Lrg1, Socs3 and Stat3), and the p53 pathway (Cdkn1a and Fas). Also, most of these genes have been reported to be involved in the response to oxidative stress or ER stress (see Supplementary File 3: Figure S1). Genes known to have a protective role in response to oxidative stress include Hmox1, Txnrd1, Cebpd, Gadd45b, Ppard, and Socs3. Some of the genes we identified are known to be activated in response to oxidative stress, but may have either a protective effect or a damaging effect depending on the setting. These genes include: Acsl3, Atf4, Cdkn1a, Lrg1, Myc and Stat3.
Figure 5.
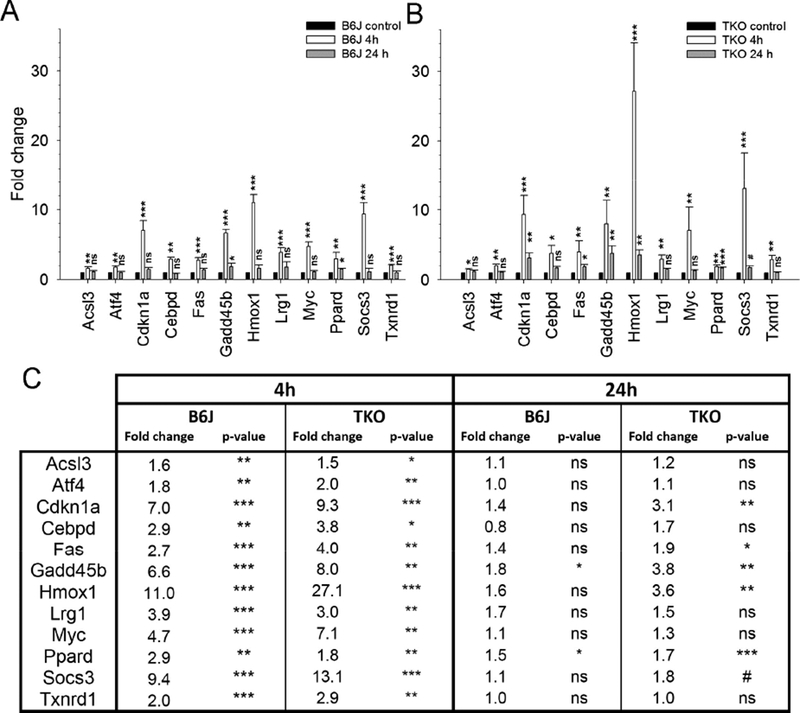
Gene expression analysis using qPCR determined that a large number of oxidative stress-related genes increased after fundus camera-delivered light induced retinal degeneration (FCD-LIRD) in both C57BL/6J (B6J, A) and SOD1/DJ-1/Parkin-deficient (TKO, B) mice. The bars represent gene expression as Fold Change relative to baseline and using GAPDH as an internal control. The expression of most of these genes increased 4h after FCD-LIRD, but moved back towards baseline 24h after treatment (A,B,C). For the analysis, eyes were collected from naive mice (C57BL/6J: n = 8 eyes; SOD1/DJ-1/Parkin-deficient mice: n = 5 eyes), from treated mice 4h after FCD-LIRD (C57BL/6J: n = 5; SOD1/DJ-1/Parkin-deficient mice: n = 4), and from treated mice 24 h after FCD-LIRD (C57BL/6J: n = 4 eyes; SOD1/DJ- 1/Parkin-deficient mice: n = 5 eyes). Statistical analysis is based on a comparison to naive eyes (control). * = p<0.05, ** = p<0.01, *** = p<0.001, ns = no significant difference
On a closer look, there were some differences in the gene expression changes seen in TKO vs. B6J mice (Fig. 6). Bmp4 was upregulated in B6J mice, but not in TKO (Fig. 6A). Fas and Cdkn1a were significantly upregulated in both B6J and TKO at 4 h. However, at 24 h they were still significantly upregulated in TKO, but not in B6J mice (Fig. 6B,6C). Hmox1, an established marker of the severity of oxidative stress, was upregulated in both strains of mice, but the upregulation at 4 h was significantly higher in TKO mice (Fig. 6D; there was still a trend for a higher upregulation compared to B6J at 24h). Finally, Cebpd and Stat3 were similarly upregulated in both strains at 4 h. However, at 24 h, Cebpd and Stat3 were significantly more upregulated in TKO mice compared to B6J mice (Fig. 6E,6F). In fact, upregulation of Stat3 in TKO was higher at 24 h compared to 4 h.
Figure 6.
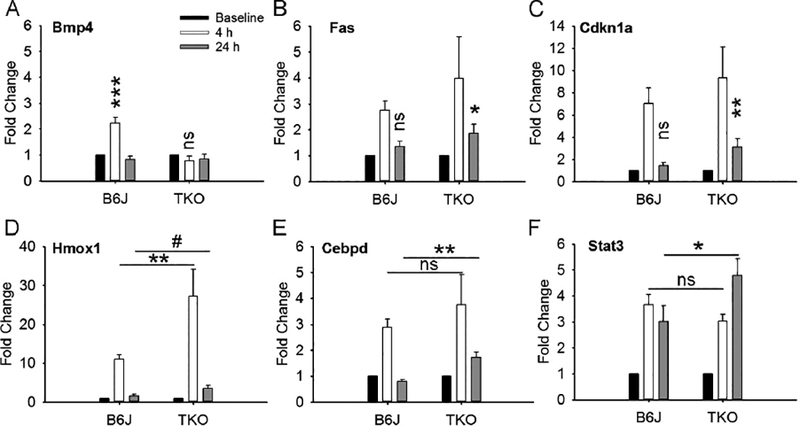
After fundus camera-delivered light induced retinal degeneration (FCD-LIRD), the expression of several genes was differentially altered in SOD1/DJ-1/Parkin-deficient (TKO) eyes relative to C57BL/6J (B6J) eyes. The bars represent gene expression as Fold Change relative to baseline and using GAPDH as an internal control. Analysis is shown for Bmp4 (A), Fas (B), Cdkn1a (C), Hmox1 (D), Cebpd (E) and Stat3 (F). For the analysis, eyes were collected at baseline (C57BL/6J: n = 8; SOD1/DJ-1/Parkin-deficient mice: n = 5), 4h after FCD-LIRD (C57BL/6J: n = 5 eyes; SOD1/DJ-1/Parkin-deficient mice: n = 4 eyes) and 24 h (C57BL/6J: n = 4 eyes; SOD1/DJ-1/Parkin-deficient mice: n = 3 eyes). Statistical significance was calculated relative to baseline (panels A, B and C), or based on the comparisons illustrated by the horizontal lines (for panels D, E, F). * = p<0.05, ** = p<0.01, *** = p<0.001, # = approaching statistical significance (p < 0.1), ns = no significant difference
4. Discussion
Light-induced retinal degeneration models have been very helpful in allowing us to understand the response of the retina and RPE to insults, and in particular to the stress induced by light exposure (Collier et al., 2011; Grimm and Remé, 2013; Kast et al., 2016; Yang et al., 2008). Most of the studies have been done in albino mice, which express a variant of RPE65 (Leu450) that renders them much more susceptible to light-induced retinal degeneration than humans. We recently reported (Zhong et al., 2016) a novel model of LIRD that is effective in B6J mice, which express the “light-resistant” variant of RPE65 (Met450). In the current work, one of our goals was to test whether this FCD-LIRD model could be applied to genetically-modified mice in order to determine the effect of specific genetic factors in the response of the retina to light stress. In particular, we tested the hypothesis that oxidative stress plays an important role in fundus camera-delivered light-induced retinal degeneration using genetically modified mice on the C57BL/6J background: SOD1/DJ-1/Parkin triple KO mice. Our results demonstrate that the absence of SOD1, DJ-1 and Parkin (proteins that are important in the retinal response to oxidative stress), does increase the level of retinal and RPE damage after FCD-LIRD, as demonstrated in clinical photos, OCT outer retinal volume, and on analysis of RPE cell morphology. Of note, as we have previously shown (Zhong et al. 2016), the fluorescein-assisted model of FCD-LIRD causes increased damage both to the retina and RPE. However, it was interesting that in the milder protocols used here, the fluorescein-assisted model may have had a more pronounced impact on the RPE. Yet, since we did not power our studies for this analysis (comparing the “fluorescein-assisted” vs. the “light-only” models with regard to effect in the retina vs. the RPE), we will need to look at this further in future studies.
We chose to use SOD1/DJ-1/Parkin-deficient (“TKO”) mice in our experiments for several reasons. First, several groups have shown that all of these proteins are important for the oxidative response in the retina. Bonilha et al. have shown that DJ-1 plays an important role in protecting photoreceptors and RPE cells from oxidative damage during aging (Bonilha et al., 2017) and in response to a systemic challenge with an oxidizing agent (sodium iodate; Bonilha et al., 2015). They had previously demonstrated that DJ-1 was increased in RPE cells in culture after an oxidative stressor was applied, and that DJ-1 was elevated in the RPE of AMD patients (Shadrach et al., 2013). SOD1 had been found to be important in protecting the retina from oxidative stress induced by paraquat and hyperoxia (Dong et al.,2006), and by aging (Hashizume et al.,2008). Parkin has also been shown to be present in the retina of humans (Esteve-Rudd et al.,2010), and has been found to play an important role in the response to oxidative stress (Brennan et al.,2017; Chen et al., 2013; Hwang et al.,2014; Hyun et al., 2002; Palacino et al., 2004; Yang et al.,2006). So, combining deficits in these 3 proteins we hoped to increase our ability to determine a differential effect (relative to B6J mice) in the response of the retina to the FCD-LIRD-mediated oxidative stress. Also, generating a colony of this TKO model and understanding how their retina behaves in response to oxidative stressors may allow us to further determine if chronic oxidative stress in the retina can lead to the spontaneous development of AMD-like characteristics.
In order to evaluate the effect of LIRD on the retina and RPE it is useful to have parameters that take into consideration a large portion of the treated areas. Here we report that, in the FCD-LIRD model, we can use outer retinal OCT volume as a quantitative measure of retinal damage in a large portion of the targeted tissue. OCT retinal thickness maps have been described before in the setting of LIRD (Aziz et al.,2014) using the Bioptigen OCT system, but were not used to calculate volumes for quantitative comparisons. Since the majority of the damage occurs in the outer retina, we have chosen to calculate the OCT volume of the outer retina (using the Phoenix Research software on the Micron IV system). We also describe an easy to reproduce protocol for quantitative analysis of RPE damage that seems to be relevant for the FCD-LIRD model. It relies on a semi-automated RPE morphology analysis of ZO-1-stained RPE flat mounts using a CellProfiler open source image analysis software.
Although classic models of LIRD applied to albino mice have been shown to be mediated by oxidative stress (Chen et al.,2013; Imai et al., 2010; Organisciak et al., 1999; Tanito et al., 2005) and inflammation (Chen et al., 2004; Rohrer et al., 2007; Rutar et al., 2015 and 2011), our model differs in two important ways: 1. it applies a more intense stimulus over a shorter period of time, and 2. it is applied to mice that are much more resistant to LIRD. Thus, it was relevant to demonstrate that in the FCD-LIRD model, damage is also modulated by the oxidative stress response. We had previously demonstrated that the FCD-LIRD model reproduces many aspects of other well-established models of LIRD including: the geographic distribution of the damage (superior>inferior), histological changes, apoptosis in the outer nuclear layer, and accumulation of subretinal microglia (Zhong et al., 2016). We now demonstrate that deficits in the oxidative stress response exacerbate the damage. Furthermore, gene expression analysis can be easily applied to this model, and our results demonstrate a reproducible pattern of gene expression changes that consistently point towards a significant oxidative stress response.
Differences in gene expression identified in TKO vs. B6J mice may warrant further exploration. We observed that Bmp4, a highly-conserved member of the TGF-β superfamily, was upregulated after FCD-LIRD in B6J mice, but not TKO mice. Others have shown that exogenous Bmp4 reduced NMDA-induced neuronal cell death in the outer retina (Fischer et al., 2004), and that Bmp4 can activate autophagy and inhibit apoptosis (Zhao et al., 2013). Furthermore, overexpression of Bmp4 reduced laser-induced CNV in mice by directly inhibiting MMP-9 and indirectly inhibiting VEGF (Xu et al., 2012). These data in combination with our findings, would suggest that Bmp4 may have a protective role in this setting. On the other hand, several genes appeared to remain upregulated for a longer period of time in TKO mice compared to B6J (e.g. Fas, Cdkn1a, Cebpd and Stat3). It would be interesting to manipulate the expression of these genes in order to determine if they have a protective or a deleterious effect on retinal health in the setting of stressors. One hypothesis would be that these genes are protective, and that they stay elevated longer in TKO mice, because these mice are more susceptible to oxidative damage, and thus the signaling pathways triggering their upregulation for protective purposes stay active longer. Alternatively, it is possible that the fact that they stay elevated longer may be responsible for the increased retinal damage in TKO mice. Interestingly, Stat3 has been proposed to have both protective and deleterious effects on cell survival and retinal health in different settings (Fragoso et al.,2012; Ueki et al.,2008; Zgheib et al.,2012). Experimental manipulation of Stat3 in FCD-LIRD would thus be very helpful in understanding its role in the response of the retina to light-induced oxidative damage.
We are also interested in determining gene expression changes after FCD-LIRD in RPE vs retina (for SOD1, DJ-1, Parkin, Bmp4 and other genes of interest). We have previously developed a technique to isolate RPE cells from posterior eye cups for RNA isolation and analysis (Xin-Zhao-Wang et al., 2012). However, before applying it to FCD-LIRD-treated eyes, we first need to validate it in this model, showing that FCD-LIRD does not affect our ability to separate RPE from retina (at least in early time points).
5. Conclusions
We have shown here that the FCD-LIRD model is an effective and reproducible model to test the effect of genetic mutations in the response of the retina to light-induced stress, even in the common but traditionally “LIRD-resistant” genetic backgrounds. This model also seems well- suited for screening experiments involving relatively large numbers of animals. Our results provide strong evidence for an important role of oxidative stress in the FCD-LIRD model. Finally, we have described simple protocols for the quantitative assessment of retinal and RPE damage after FCD-LIRD.
Having shown that SOD1/DJ-1/Parkin-deficient mice are indeed more susceptible to light-induced retinal degeneration, we plan to start dissecting the pathways involved. It is known that multiple mechanisms may explain the anti-oxidant roles of these proteins. In the future we will use the FCD-LIRD model to further elucidate the mechanisms involved in the protection of the retina from light and oxidative stress. To this end we will study mice deficient in individual proteins (SOD1 vs. DJ1 vs. Parkin) and will evaluate the effects of FCD-LIRD on autophagy, the unfolded protein response, the ubiquitin proteasome system, the Nrf2 signaling pathway and DNA damage response sensors. We have also noticed that, when using lower intensity FCD-LIRD protocols (like the ones described in this work), there appears to be some recovery of retinal volume between days 5 and 15. This suggests that this model could be useful in understanding mechanisms of retinal recovery from injury.
Supplementary Material
Highlights.
Novel retinal degeneration model (FCD-LIRD) is effective in light-resistant mice
Helps study effect of genetic mutations on retinal response to light stress
Oxidative stress is an important component of FCD-LIRD.
We established protocols to quantify the effect of FCD-LIRD on the retina and RPE
Acknowledgments
Funding:
This work was supported by the National Institutes of Health (1R01EY022652, and Visual Science Core Grant EY020799), an unrestricted grant from Research to Prevent Blindness, the Patricia and Col. William Massad Retina Research Fund and a grant from the David M. Crowley Foundation.
Footnotes
Publisher's Disclaimer: This is a PDF file of an unedited manuscript that has been accepted for publication. As a service to our customers we are providing this early version of the manuscript. The manuscript will undergo copyediting, typesetting, and review of the resulting proof before it is published in its final citable form. Please note that during the production process errors may be discovered which could affect the content, and all legal disclaimers that apply to the journal pertain.
References:
- Aredo B, Li T, Chen X, Zhang K, Wang CX, Gou D, Zhao B, He Y, Ufret-Vincenty RL (2015). A chimeric Cfh transgene leads to increased retinal oxidative stress, inflammation, and accumulation of activated subretinal microglia in mice. Invest Ophthalmol Vis Sci. 56, 3427–3440. [DOI] [PMC free article] [PubMed] [Google Scholar]
- Aziz MK, Ni A, Esserman DA, Chavala SH (2014). Evidence of early ultrastructural photoreceptor abnormalities in light-induced retinal degeneration using spectral domain optical coherence tomography. Br J Ophthalmol. 98, 984–989. [DOI] [PubMed] [Google Scholar]
- Boatright JH, Dalal N, Chrenek MA, Gardner C, Ziesel A, Jiang Y, Nickerson JM (2015). Methodologies for analysis of patterning in the mouse RPE sheet. Mol Vis. 21, 40–60. [PMC free article] [PubMed] [Google Scholar]
- Bonilha VL, Bell BA, Rayborn ME, Samuels IS, King A, Hollyfield JG, Xie C, Cai H (2017). Absence of DJ-1 causes age-related retinal abnormalities in association with increased oxidative stress. Free Radic Biol Med. 104, 226–237. [DOI] [PMC free article] [PubMed] [Google Scholar]
- Bonilha VL, Bell BA, Rayborn ME, Yang X, Kaul C, Grossman GH, Samuels IS, Hollyfield JG, Xie C, Cai H, Shadrach KG (2015). Loss of DJ-1 elicits retinal abnormalities, visual dysfunction, and increased oxidative stress in mice. Exp Eye Res. 139, 22–36. [DOI] [PMC free article] [PubMed] [Google Scholar]
- Brantley MA Jr., Osborn MP, Sanders BJ, Rezaei KA, Lu P, Li C, Milne GL, Cai J, Sternberg P Jr. (2012). Plasma biomarkers of oxidative stress and genetic variants in age- related macular degeneration. Am J Ophthalmol. 153, 460–467. [DOI] [PMC free article] [PubMed] [Google Scholar]
- Bray M-A, Vokes MS, & Carpenter AE (2015). Using CellProfiler for Automatic Identification and Measurement of Biological Objects in Images. Curr Protoc in Mol Biol. 109, 14.17.1–14.17.13. [DOI] [PMC free article] [PubMed] [Google Scholar]
- Brennan L, Khoury J, Kantorow M (2017). Parkin elimination of mitochondria is important for maintenance of lens epithelial cell ROS levels and survival upon oxidative stress exposure. Biochim Biophys Acta. 1863(1), 21–32. [DOI] [PMC free article] [PubMed] [Google Scholar]
- Campochiaro PA, Strauss RW, Lu L, Hafiz G, Wolfson Y, Shah SM, Sophie R, Mir TA, Scholl HP (2015). Is There Excess Oxidative Stress and Damage in Eyes of Patients with Retinitis Pigmentosa? Antioxid Redox Signal. 23, 643–648. [DOI] [PMC free article] [PubMed] [Google Scholar]
- Chalfoun J, Majurski M, Dima A, Stuelten C, Peskin A, & Brady M (2014). FogBank: a single cell segmentation across multiple cell lines and image modalities. BMC Bioinformatics. 15(1), 431. [DOI] [PMC free article] [PubMed] [Google Scholar]
- Chen L, Wu W, Dentchev T, Zeng Y, Wang J, Tsui I, Tobias JW, Bennett J, Baldwin D, Dunaief JL (2004). Light damage induced changes in mouse retinal gene expression. Exp Eye Res. 79, 239–247. [DOI] [PubMed] [Google Scholar]
- Chen Y, Sawada O, Kohno H, Le YZ, Subauste C, Maeda T, Maeda A (2013). Autophagy protects the retina from light-induced degeneration. J Biol Chem. 288, 7506–7518. [DOI] [PMC free article] [PubMed] [Google Scholar]
- Collier RJ, Wang Y, Smith SS, Martin E, Ornberg R, Rhoades K, Romano C (2011). Complement deposition and microglial activation in the outer retina in light-induced retinopathy: inhibition by a 5-HT1A agonist. Invest Ophthalmol Vis Sci. 52, 8108–8116. [DOI] [PubMed] [Google Scholar]
- Delcourt C, Cougnard-Gregoire A, Boniol M, Carriere I, Dore JF, Delyfer MN, Rougier MB, Le Goff M, Dartigues JF, Barberger-Gateau P, Korobelnik JF (2014). Lifetime exposure to ambient ultraviolet radiation and the risk for cataract extraction and age-related macular degeneration: the Alienor Study. Invest Ophthalmol Vis Sci. 55, 7619–7627. [DOI] [PubMed] [Google Scholar]
- Ding X, Patel M, Chan CC (2009). Molecular pathology of age-related macular degeneration. Prog Retin Eye Res. 28, 1–18. [DOI] [PMC free article] [PubMed] [Google Scholar]
- Dong A, Shen J, Krause M, Akiyama H, Hackett SF, Lai H, Campochiaro PA (2006). Superoxide dismutase 1 protects retinal cells from oxidative damage. J Cell Physiol. 208, 516–526. [DOI] [PubMed] [Google Scholar]
- Dysli C, Enzmann V, Sznitman R, & Zinkernagel MS (2015). Quantitative Analysis of Mouse Retinal Layers Using Automated Segmentation of Spectral Domain Optical Coherence Tomography Images. Transl Vis Sci Technol. 4(4), 9. [DOI] [PMC free article] [PubMed] [Google Scholar]
- Esteve-Rudd J Campello L, Herrero MT, Cuenca N, Martin-Nieto J (2010). Expression in the mammalian retina of parkin and UCH-L1, two components of the ubiquitin-proteasome system. Brain Res. 1352, 70–82. [DOI] [PubMed] [Google Scholar]
- Fischer AJ, Schmidt M, Omar G, Reh TA (2004). BMP4 and CNTF are neuroprotective and suppress damage-induced proliferation of Muller glia in the retina. Mol Cell Neurosci. 27(4), 531–542. [DOI] [PubMed] [Google Scholar]
- Fragoso MA, Patel AK, Nakamura REI, Yi H, Surapaneni K, & Hackam AS (2012). The Wnt/β-Catenin Pathway Cross-Talks with STAT3 Signaling to Regulate Survival of Retinal Pigment Epithelium Cells. PLoS ONE. 7(10), e46892. [DOI] [PMC free article] [PubMed] [Google Scholar]
- Grimm C, Remé CE (2013). Light damage as a model of retinal degeneration. Methods Mol Biol. 935, 87–97. [DOI] [PubMed] [Google Scholar]
- Hadziahmetovic M, Kumar U, Song Y, Grieco S, Song D, Li Y, Dunaief JL (2012). Microarray Analysis of Murine Retinal Light Damage Reveals Changes in Iron Regulatory, Complement, and Antioxidant Genes in the Neurosensory Retina and Isolated RPE. Invest Ophthalmol Vis Sci. 53(9), 5231–5241. [DOI] [PMC free article] [PubMed] [Google Scholar]
- Hashizume K, Hirasawa M, Imamura Y, Noda S, Shimizu T, Shinoda, Kurihara T, Noda K, Ozawa Y, Ishida S, Miyake Y, Shirasawa T, Tsubota K (2008). Retinal Dysfunction and Progressive Retinal Cell Death in SOD1-Deficient Mice. Am J Pathol. 172(5), 1325–1331. [DOI] [PMC free article] [PubMed] [Google Scholar]
- Hollyfield JG, Bonilha VL, Rayborn ME, Yang X, Shadrach KG, Lu L, Ufret RL, Salomon RG, Perez VL (2008). Oxidative damage-induced inflammation initiates age- related macular degeneration. Nat Med. 14, 194–198. [DOI] [PMC free article] [PubMed] [Google Scholar]
- Hwang M, Lee JM, Kim Y, Geum D (2014). Functional Role of Parkin against Oxidative Stress in Neural Cells. Endocrinol Metab. 29, 62–69. [DOI] [PMC free article] [PubMed] [Google Scholar]
- Hyun DH, Lee M, Hattori N, Kubo S, Mizuno Y, Halliwell B, Jenner P (2002). Effect of wild-type or mutant Parkin on oxidative damage, nitric oxide, antioxidant defenses, and the proteasome. J Biol Chem. 277(32), 28572–28577. [DOI] [PubMed] [Google Scholar]
- Imai S, Inokuchi Y, Nakamura S, Tsuruma K, Shimazawa M, Hara H, (2010). Systemic administration of a free radical scavenger, edaravone, protects against light-induced photoreceptor degeneration in the mouse retina. Eur J Pharmacol. 642(1–3), 77–85. [DOI] [PubMed] [Google Scholar]
- Joly S, Francke M, Ulbricht E, Beck S, Seeliger M, Hirrlinger P, Hirrlinger J, Lang KS, Zinkernagel M, Odermatt B, Samardzija M, Reichenbach A, Grimm C, Reme CE (2009). Cooperative phagocytes: resident microglia and bone marrow immigrants remove dead photoreceptors in retinal lesions. Am J Pathol. 174, 2310–2323. [DOI] [PMC free article] [PubMed] [Google Scholar]
- Kast B, Schori C, Grimm C (2016). Hypoxic preconditioning protects photoreceptors against light damage independently of hypoxia inducible transcription factors in rods. Exp Eye Res. 146, 60–71. [DOI] [PubMed] [Google Scholar]
- Komeima K, Rogers BS, Lu L, Campochiaro PA (2006). Antioxidants reduce cone cell death in a model of retinitis pigmentosa. Proc Natl Acad Sci U S A. 103, 11300–11305. [DOI] [PMC free article] [PubMed] [Google Scholar]
- Luhmann UF, Robbie S, Munro PM, Barker SE, Duran Y, Luong V, Fitzke FW, Bainbridge JW, Ali RR, MacLaren RE (2009). The drusenlike phenotype in aging Ccl2- knockout mice is caused by an accelerated accumulation of swollen autofluorescent subretinal macrophages. Invest Ophthalmol Vis Sci. 50, 5934–5943. [DOI] [PMC free article] [PubMed] [Google Scholar]
- Mattapallil MJ, Wawrousek EF, Chan C-C, Zhao H, Roychoudhury J, Ferguson TA, & Caspi RR (2012). The Rd8 Mutation of the Crb1 Gene Is Present in Vendor Lines of C57BL/6N Mice and Embryonic Stem Cells, and Confounds Ocular Induced Mutant Phenotypes. Investi Ophthalmol Vis Sci. 53(6), 2921–2927. [DOI] [PMC free article] [PubMed] [Google Scholar]
- Monk TH, Buysse DJ, Rose LR, Hall JA, Kupfer DJ (2000). The sleep of healthy people--a diary study. Chronobiol Int. 17(1), 49–60. [DOI] [PubMed] [Google Scholar]
- Natoli R, Jiao H, Barnett NL, Fernando N, Valter K, Provis JM, Rutar M (2016). A model of progressive photo-oxidative degeneration and inflammation in the pigmented C57BL/6J mouse retina. Exp Eye Res.147, 114–127. [DOI] [PubMed] [Google Scholar]
- O’Koren EG, Mathew R, & Saban DR (2016). Fate mapping reveals that microglia and recruited monocyte-derived macrophages are definitively distinguishable by phenotype in the retina. Sci Rep. 6, 20636. [DOI] [PMC free article] [PubMed] [Google Scholar]
- Organisciak DT, Darrow RA, Barsalou L, Darrow RM, Lininger LA (1999). Light induced damage in the retina: differential effects of dimethylthiourea on photoreceptor survival, apoptosis and DNA oxidation. Photochem. Photobiol 70(2), 261–268. [PubMed] [Google Scholar]
- Palacino JJ, Sagi D, Goldberg MS, Krauss S, Motz C, Wacker M, Klose J, Shen J (2004). Mitochondrial dysfunction and oxidative damage in parkin-deficient mice. J Biol Chem. 279, 18614–18622. [DOI] [PubMed] [Google Scholar]
- Paskowitz DM, LaVail MM, Duncan JL (2006). Light and inherited retinal degeneration. Br J Ophthalmol. 90, 1060–1066. [DOI] [PMC free article] [PubMed] [Google Scholar]
- Punzo C,, Xiong W, Cepko CL (2012). Loss of daylight vision in retinal degeneration: are oxidative stress and metabolic dysregulation to blame? J Biol Chem. 287, 1642–1648. [DOI] [PMC free article] [PubMed] [Google Scholar]
- Rohrer B, Bandyopadhyay M, Beeson C (2016). Reduced Metabolic Capacity in Aged Primary Retinal Pigment Epithelium (RPE) is Correlated with Increased Susceptibility to Oxidative Stress. Adv Exp Med Biol. 854, 793–798. [DOI] [PubMed] [Google Scholar]
- Rohrer B, Guo Y, Kunchithapautham K, Gilkeson GS (2007). Eliminating complement factor D reduces photoreceptor susceptibility to light-induced damage. Invest Ophthalmol Vis Sci. 48, 5282–5289. [DOI] [PubMed] [Google Scholar]
- Rutar M, Natoli R, Chia RX, Valter K, Provis JM (2015). Chemokine-mediated inflammation in the degenerating retina is coordinated by Muller cells, activated microglia, and retinal pigment epithelium. J. Neuroinflammation 12, 8. [DOI] [PMC free article] [PubMed] [Google Scholar]
- Rutar M, Natoli R, Kozulin P, Valter K, Gatenby P, Provis JM (2011). Analysis of complement expression in light-induced retinal degeneration: synthesis and deposition of C3 by microglia/macrophages is associated with focal photoreceptor degeneration. Invest Ophthalmol Vis Sci. 52(8), 5347–5358. [DOI] [PubMed] [Google Scholar]
- Shadrach KG, Rayborn ME, Hollyfield JG, & Bonilha VL (2013). DJ-1-Dependent Regulation of Oxidative Stress in the Retinal Pigment Epithelium (RPE). PLoS ONE, 8(7), e67983. [DOI] [PMC free article] [PubMed] [Google Scholar]
- Shaw PX, Zhang L, Zhang M, Du H, Zhao L, Lee C, Grob S, Lim SL, Hughes G, Lee J, Bedell M, Nelson MH, Lu F, Krupa M, Luo J, Ouyang H, Tu Z, Su Z, Zhu J, Wei X, Feng Z, Duan Y, Yang Z, Ferreyra H, Bartsch DU, Kozak I, Zhang L, Lin F, Sun H, Feng H, Zhang K (2012). Complement factor H genotypes impact risk of age- related macular degeneration by interaction with oxidized phospholipids. Proc Natl Acad Sci USA. 109, 13757–13762. [DOI] [PMC free article] [PubMed] [Google Scholar]
- Shen JK, Dong A, Hackett SF, Bell WR, Green WR, Campochiaro PA (2007). Oxidative damage in age-related macular degeneration. Histol Histopathol. 22, 1301–1308. [DOI] [PubMed] [Google Scholar]
- Song D, Song Y, Hadziahmetovic M, Zhong Y, & Dunaief JL (2012). Systemic administration of the iron chelator deferiprone protects against light-induced photoreceptor degeneration in the mouse retina. Free Radic Biol Med. 53(1), 64–71. [DOI] [PMC free article] [PubMed] [Google Scholar]
- Tanito M, Elliott MH, Kotake Y, Anderson RE (2005). Protein modifications by 4- hydroxynonenal and 4-hydroxyhexenal in light-exposed rat retina. Invest Ophthalmol Vis Sci. 46, 3859–3868. [DOI] [PubMed] [Google Scholar]
- Tomany SC, Cruickshanks KJ, Klein R, Klein BE, Knudtson MD (2004). Sunlight and the 10-year incidence of age-related maculopathy: the Beaver Dam Eye Study. Arch Ophthalmol. 122, 750–757. [DOI] [PubMed] [Google Scholar]
- Ueki Y, Wang J, Chollangi S, Ash JD (2008). STAT3 activation in photoreceptors by leukemia inhibitory factor is associated with protection from light damage. J Neurochem. 105, 784–96. [DOI] [PubMed] [Google Scholar]
- Ufret-Vincenty RL, Aredo B, Liu X,. McMahon A, Chen PW, Sun H, Niederkorn JY, Kedzierski W (2010). Transgenic mice expressing variants of complement factor H develop AMD-like retinal findings. Invest Ophthalmol Vis Sci. 51(11), 5878–5887. [DOI] [PubMed] [Google Scholar]
- Weismann D, Hartvigsen K, Lauer N, Bennett KL, Scholl HP, Charbel Issa P, Cano M, Brandstatter H, Tsimikas S, Skerka C, Superti-Furga G, Handa JT, Zipfel PF, Witztum JL, Binder CJ (2011). Complement factor H binds malondialdehyde epitopes and protects from oxidative stress. Nature. 478(7367), 76–81. [DOI] [PMC free article] [PubMed] [Google Scholar]
- Wenzel A, Grimm C, Samardzija M, Reme CE (2005). Molecular mechanisms of light-induced photoreceptor apoptosis and neuroprotection for retinal degeneration. Prog Retin Eye Res. 24, 275–306. [DOI] [PubMed] [Google Scholar]
- Wenzel A, Reme CE, Williams TP, Hafezi F, Grimm C (2001). The Rpe65 Leu450Met variation increases retinal resistance against light-induced degeneration by slowing rhodopsin regeneration. J Neurosci. 21(1), 53–58. [DOI] [PMC free article] [PubMed] [Google Scholar]
- White DA, Fritz JJ, Hauswirth WW, Kaushal S, Lewin AS (2007). Increased sensitivity to light- induced damage in a mouse model of autosomal dominant retinal disease. Invest Ophthalmol Vis Sci. 48, 1942–1951. [DOI] [PubMed] [Google Scholar]
- Xin-Zhao Wang C, Zhang K, Aredo B, Lu H, Ufret-Vincenty RL (2012). Novel method for the rapid isolation of RPE cells specifically for RNA extraction and analysis. Exp Eye Res. 102, 1–9. [DOI] [PMC free article] [PubMed] [Google Scholar]
- Xu J, Zhu D, Sonoda S, He S, Spee C, Ryan SJ, Hinton DR (2012) Over-expression of BMP4 inhibits experimental choroidal neovascularization by modulating VEGF and MMP-9. Angiogenesis. 15, 213–227. [DOI] [PMC free article] [PubMed] [Google Scholar]
- Yang LP, Wu LM, Guo XJ, Li Y, Tso MO (2008). Endoplasmic reticulum stress is activated in light-induced retinal degeneration. J Neurosci Res. 86, 910–919. [DOI] [PubMed] [Google Scholar]
- Yang YX, Muqit MM, Latchman DS (2006). Induction of parkin expression in the presence of oxidative stress. Eur J Neurosci. 24, 1366–1372. [DOI] [PubMed] [Google Scholar]
- Zgheib C, Zouein FA, Kurdi M, & Booz GW (2012). Differential STAT3 Signaling in the Heart: Impact of Concurrent Signals and Oxidative Stress. JAK-STAT, 1(2), 101–110. [DOI] [PMC free article] [PubMed] [Google Scholar]
- Zhao X, Liu J, Peng M, Liu J, Chen F (2013). BMP4 is involved in the chemoresistance of myeloid leukemia cells through regulating autophagy-apoptosis balance. Cancer Invest. 31, 555–562. [DOI] [PubMed] [Google Scholar]
- Zhao Z, Chen Y, Wang J, Sternberg P, Freeman ML, Grossniklaus HE, Cai J (2011). Age-related retinopathy in NRF2-deficient mice. PLoS One. 6(4), e19456. [DOI] [PMC free article] [PubMed] [Google Scholar]
- Zheng L, Anderson RE, Agbaga MP, Rucker EB 3rd, Le YZ. (2006). Loss of BCL-XL in rod photoreceptors: Increased susceptibility to bright light stress. Invest Ophthalmol Vis Sci. 47(12), 5583–5589. [DOI] [PubMed] [Google Scholar]
- Zhong X, Aredo B, Ding Y, Zhang K, Zhao CX, & Ufret-Vincenty RL (2016). Fundus Camera-Delivered Light-Induced Retinal Degeneration in Mice With the RPE65 Leu450Met Variant is Associated With Oxidative Stress and Apoptosis. Invest Ophthalmol Vis Sci. 57(13), 5558–5567. [DOI] [PMC free article] [PubMed] [Google Scholar]
Associated Data
This section collects any data citations, data availability statements, or supplementary materials included in this article.