

Abstract
Cannabis use is a heritable trait that has been associated with adverse mental health outcomes. In the largest genome-wide association study for lifetime cannabis use to date (N=184,765), we identified 8 genome-wide significant independent single nucleotide polymorphisms in 6 regions. All measured genetic variants combined explained 11% of the variance. Gene-based tests revealed 35 significant genes in 16 regions, and S-PrediXcan analyses showed that 21 genes had different expression levels for cannabis users versus non-users. The strongest finding across the different analyses was CADM2, which has been associated with substance use and risk-taking. Significant genetic correlations were found with 14 of 25 tested substance use and mental health traits, including smoking, alcohol use, schizophrenia, and risk-taking. Mendelian randomization analysis showed evidence for a causal positive influence of schizophrenia risk on cannabis use. Overall, our study gives new insights about the etiology of cannabis use and its relation with mental health.
Cannabis is a widely used psychoactive substance and its use is associated with various adverse (mental) health outcomes, including psychosis and schizophrenia 1–3. Successful prevention and intervention efforts aimed at reducing cannabis use, misuse, and related outcomes require a better understanding of why some people use cannabis whereas others do not. Lifetime cannabis use, defined as any use of cannabis during lifetime, is a heritable trait: a meta-analysis of twin studies estimated the heritability to be approximately 45% 4. Twin studies have shown there is substantial overlap in the genetic factors influencing cannabis use and those underlying problematic cannabis use (abuse/dependence) 5,6.
Several genome-wide association studies (GWASs) have tried to identify genetic variants underlying cannabis use phenotypes 7–11. Recently, Demontis et al. 11 performed the largest GWAS for cannabis use disorder to date with a discovery sample of 2,387 cases and almost 50,000 controls, plus a replication sample of 5,501 cases and ~300,000 controls. They found one genome-wide significant risk locus for cannabis use disorder, a single nucleotide polymorphism (SNP) that is a strong marker for CHRNA2 expression. Their follow-up analyses showed that cannabis dependent individuals had a decreased expression of this gene in the cerebellum as well as in other brain regions.
The largest GWAS of lifetime cannabis use to date is from the International Cannabis Consortium (ICC) and is based on a sample size of 32,330 individuals in the discovery sample along with 5,627 individuals in the replication sample 10. Although no individual SNPs reached genome-wide significance, gene-based tests identified four genes significantly associated with lifetime cannabis use: NCAM1, CADM2, SCOC, and KCNT2. Notably, NCAM1 has previously been linked to other substance use phenotypes (e.g. 12,13), and following publication of the manuscript, CADM2 was found to be associated with alcohol consumption 14, personality 15, reproductive succes and risk-taking behavior 16 in other GWASs. These results indicate that CADM2 may play a role in a broader personality profile of sensation seeking and risk taking behaviour in general. In the current paper we present a GWAS of lifetime cannabis use on a substantially larger sample, providing more power to identify genetic variants.
As mentioned, cannabis use has been linked to a variety of mental health outcomes, including substance abuse and dependence and psychiatric disorders 3. In particular, the relationship between cannabis use and schizophrenia has been the subject of intensive research and debate. It has long been established that the prevalence of cannabis use is higher in schizophrenia patients 17,18. A substantial body of evidence supports the hypothesis that cannabis use increases the risk for developing psychoses and schizophrenia 19, but other hypotheses (i.e. schizophrenia increases the use of cannabis, or the association is due to (genetic) pleiotropy) have also been posed. Previous studies have shown that genetic risk factors for cannabis use and schizophrenia are positively correlated 20,21. However, a genetic correlation does not provide insight in the direction of causation. With Mendelian randomization it is possible to examine the causality of the association between cannabis use and schizophrenia, and recently it has become possible to apply this method using summary statistics from GWASs 22. Previous MR studies have investigated the link between lifetime cannabis use and schizophrenia, but findings were inconsistent. Vaucher et al. 23 tested for causal effects from cannabis use to schizophrenia and found evidence for a causal influence of cannabis use on schizophrenia risk. Gage et al. 24 tested bi-directional effects and found weak evidence for a causal effect of cannabis use on schizophrenia and much stronger evidence for a causal effect in the other direction. The results from our GWAS provide more power to examine the causal association between cannabis use and schizophrenia.
In the present study, we performed the largest GWAS for lifetime cannabis use to date. We increased the sample size substantially by meta-analysing GWAS results from the ICC study (N=35,297), along with new data from UK-Biobank (N=126,785) and 23andMe (N=22,683). The combined sample size of this study was N=184,765, a five-fold increase in sample size compared to the previous largest GWAS on lifetime cannabis use. We tested the association of millions of SNPs with lifetime cannabis use, and estimated the heritability of lifetime cannabis use based on all SNPs. Tests of association for individual genetic variants were complemented with gene-based tests of association and S-PrediXcan analysis. The latter was used to identify genes with differential expression levels in cannabis users versus non-users. We further estimated the genetic correlation of lifetime cannabis use with other traits, including use of other substances and mental health traits, such as schizophrenia. Lastly, we performed bi-directional two-sample Mendelian randomization analysis to examine whether there was evidence for a causal relationship from cannabis use to schizophrenia and vice versa.
Results
Genome-wide association meta-analysis
The meta-analysis resulted in 8 independent genome-wide significant SNP associations (linkage disequilibrium [LD] R2<0.1, window size 250 kb) on chromosomes 3, 7, 8, 11, 16, and 17 (Table 1, Supplementary Table S1, and Figure 1). The top SNP and 2 other independent associations were located in CADM2 on chromosome 3 (rs2875907, p=9.38e-17; rs1448602, p=6.55e-11; rs7651996, p=2.37e-09). Other hits were located in ZNF704, SDK1, NCAM1, RABEP2/ATP2A1, and SMG6 (Figure 2). All SNPs combined explained 11% (h2SNP=0.11, SE=0.01) of the individual differences in lifetime cannabis use. Supplementary Figure S1-S3 and Table S2 provide information on results of the individual GWASs (ICC, UK-Biobank, and 23andme).
Table 1.
Association results of 8 independent SNPs that are significantly associated with lifetime cannabis use
| SNP rs | Chr | Gene | BP | A1 | A2 | Freq A1 | N | β | SE | p-value | Direction |
|---|---|---|---|---|---|---|---|---|---|---|---|
| rs2875907 | 3p12.1 | CADM2 | 85,518,580 | A | G | 0.352 | 181,675 | 0.070 | 0.009 | 9.38e-17 | +++ |
| rs1448602 | 3p12.1 | CADM2 | 85,780,454 | A | G | 0.756 | 184,765 | -0.062 | 0.010 | 6.55e-11 | --- |
| rs7651996 | 3p12.1 | CADM2 | 85,057,349 | T | G | 0.477 | 184,765 | 0.049 | 0.008 | 2.37e-09 | +++ |
| rs10085617 | 7p22.2 | SDK1 | 3,634,711 | A | T | 0.416 | 184,765 | 0.046 | 0.008 | 2.93e-08 | +++ |
| rs9773390 | 8q21.13 | ZNF704 | 81,565,692 | T | C | 0.933 | 44,595 | -0.171 | 0.029 | 5.66e-09 | --? |
| rs9919557 | 11q23.2 | NCAM1 | 112,877,408 | T | C | 0.614 | 180,428 | -0.055 | 0.009 | 9.94e-11 | --- |
| rs10499 | 16p11.2 | RABEP2, ATP2A1 | 28,915,527 | A | G | 0.651 | 179,767 | 0.053 | 0.009 | 1.13e-09 | +++ |
| rs17761723 | 17p13.3 | SMG6 | 2,107,090 | T | C | 0.346 | 184,765 | 0.047 | 0.009 | 3.24e-08 | +++ |
Independent hits were defined as R2<0.01, window size 250 kb. The p-value threshold was set at p<5e-08 (conventional genome-wide significant threshold; significance was tested two-sided). Chromosomal region (Chr), gene the SNP is located in or the nearest gene (within 500kb; Gene), base pairs location SNP on Hg19 (BP), allele 1 (A1), allele 2 (A2), frequency of allele 1 (Freq A1), number of individuals for which variant was included (N), beta coefficient of the effect allele A1 (β), standard error (SE).
Direction per sample: allele A1 increases (+) or decreases (−) liability for cannabis use, or sample did not contribute to this SNP (?). Order of samples: ICC, 23andMe, UK-Biobank. Independent SNPs were selected as SNPs with linkage disequilibrium R2<0.1 using a window size of 250 kB.
Figure 1.

a) QQ-plot of the distribution of the −log 10(p-values) observed for the SNP associations with lifetime cannabis use against those expected under the null hypothesis
Expected −log 10(p-values) under the null hypothesis are indicated by the red line. Genomic inflation is indicated with λ in the plot. There was no evidence for population stratification (LD score regression b0=1.00, SE=0.007).
b) Manhattan plot for the SNP-based GWAS meta-analysis
Results are based on N=184,764 individuals and NSNPs=11,733,371 SNPs. The SNP with the lowest p-value per independent (R2<0.1, window size 250 kb) genome-wide significant locus is annotated (red circle with rs-number). The red line represents the conventional genome-wide significance threshold of p<5e-08. The statistical test comprised linear regression; significance was tested two-sided.
Figure 2. Regional plots of the genome-wide significant SNPs.
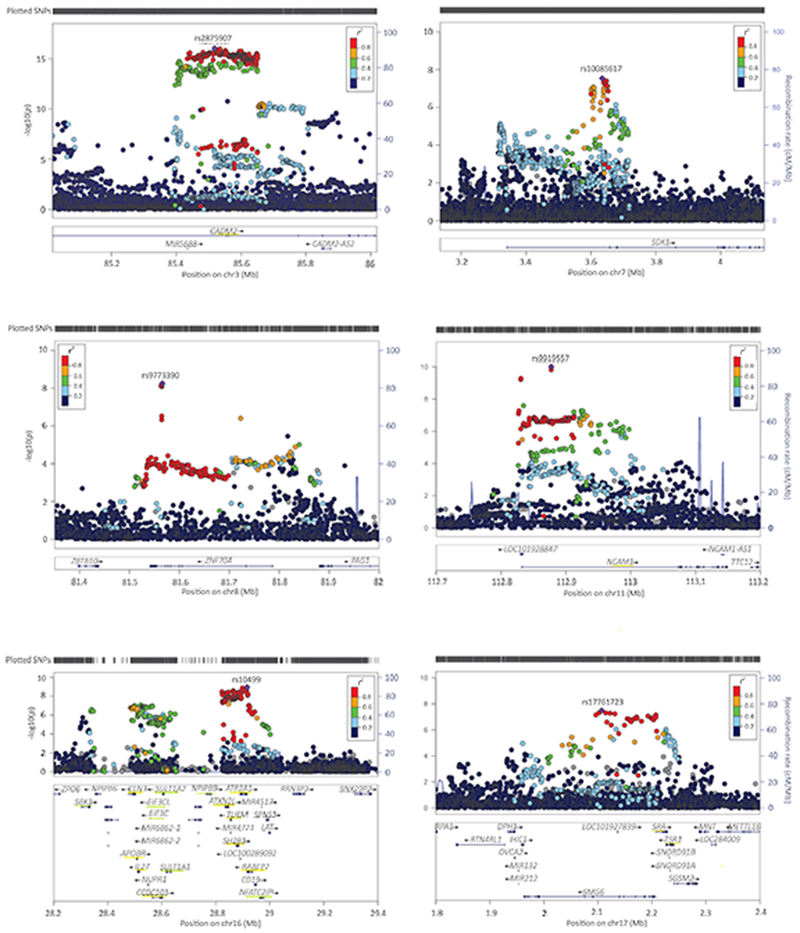
Underlined in yellow are the genes that were significant in the gene-based test (tested two-sided; p<2.74e-06, Bonferroni corrected p-value threshold of p<0.05 adjusted for 18,293 tests); underlined in green the genes that were identified in the S-PrediXcan analysis only (p<1.92e-07, Bonferroni corrected p-value threshold of p<0.05 adjusted for 259,825 tests). Colors of the dots indicate the level of LD (blue for low and red for high LD) with the lead SNP (purple; independent defined as R2<0.1, window size 250 kb).
Gene-based test of association and expression
Gene-based tests of associations in MAGMA25 identified 35 genes genome-wide significantly associated with lifetime cannabis use (see Figure 3, Table 2, Supplementary Figure S4, and Supplementary Table S3). These genes were located in 5 regions that were already identified in the SNP-based analysis (including those containing CADM2 and NCAM1) and in 11 different regions (Supplementary Figure S5).
Figure 3.

a) QQ-plot of the distribution of the −log10(p-values) for the gene-based association with lifetime cannabis use against those expected under the null hypothesis
Expected −log 10(p-values) under the null hypothesis are indicated by the red line. Genomic inflation is indicated with λ. The gene-based test was performed in MAGMA, which uses multiple regression (tested two-sided).
b) Manhattan plot for the gene-based test of association
The red line represents the genome-wide significance threshold of p<2.74e-06, (Bonferroni corrected p-value threshold of p<0.05 adjusted for 18,293 tests; NSNPs=5,710,956 were mapped to at least one gene). The top-gene (with the lowest p-value) per locus is annotated (red circle with gene symbol).
Table 2.
Genes significantly associated with lifetime cannabis use, as identified in the MAGMA and/or S-PrediXcan analyses
| Locus | Top genes | BP start | BP stop | #SNPs | Z | p-value |
|---|---|---|---|---|---|---|
| 1p36.31 | KLHL21 | 6,640,784 | 6,672,958 | 96 | 4.81 | 7.65e-07 |
| PHF13 | 6,663,756 | 6,694,093 | 84 | 4.61 | 1.99e-06 | |
| 2p12 | LRRTM4 | 76,969,849 | 77,754,502 | 3621 | 5.19 | 1.03e-07 |
| 3p12.1 | CADM2 | 85,003,133 | 86,128,579 | 4287 | 8.96 | 1.59E-19 |
| 4p16.3 | MSANTD1 | 3,240,766 | 3,283,465 | 231 | 4.59 | 2.22e-06 |
| 5q12.3 | HTR1A | 63,245,875 | 63,268,119 | 64 | 4.57 | 2.41e-06 |
| 6p12.1 | BEND6 | 56,814,773 | 56,897,450 | 252 | 5.22 | 2.60e-08 |
| KIAA1586 | 56,906,343 | 56,925,023 | 58 | 5.09 | 1.75e-07 | |
| RAB23 | 57,046,790 | 57,092,112 | 86 | 5.86 | 2.32e-09 | |
| 6q21 | REV3L | 111,610,234 | 111,814,421 | 539 | 4.61 | 1.99e-06 |
| 6q25.3 | ARID1B | 157,093,980 | 157,536,913 | 1344 | 5.59 | 1.15e-08 |
| 8q24.3 | ADGRB1 | 143,535,377 | 143,636,369 | 275 | 4.71 | 1.23e-06 |
| 10q24.32-33 | NEURL | 103,493,890 | 103,592,552 | 17 | 5.22 | 1.83e-07 |
| BORCS7 | 104,603,967 | 104,634,718 | 87 | 4.72 | 1.19e-06 | |
| AS3MT | 104,624,183 | 104,666,656 | 177 | 5.54 | 1.53e-08 | |
| CNNM2 | 104,673,075 | 104,843,344 | 549 | 4.80 | 8.02e-07 | |
| NT5C2 | 104,842,774 | 104,958,063 | 389 | 4.81 | 7.64e-07 | |
| 11q23.2 | NCAM1 | 112,826,969 | 113,154,158 | 1263 | 6.21 | 2.63e-10 |
| 12q24.12 | BRAP | 112,069,950 | 112,133,790 | 97 | 4.87 | 5.48e-07 |
| ACAD10 | 112,118,857 | 112,199,911 | 141 | 5.22 | 8.96e-08 | |
| ALDH2 | 112,199,691 | 112,252,789 | 112 | 4.96 | 3.61e-07 | |
| MAPKAPK5 | 112,275,032 | 112,336,228 | 195 | 4.87 | 5.58e-07 | |
| TMEM116 | 112,364,086 | 112,456,023 | 222 | 4.94 | 3.96E-07 | |
| 16p11.2/16q12.1 | SBK1 | 28,303,840 | 28335170 | 23 | 5.47 | 4.52e-08 |
| NPIPB7 | 28,467,693 | 28481868 | 10 | 5.44 | 5.46e-08 | |
| CLN3 | 28,483,600 | 28,510,897 | 62 | 5.84 | 2.56e-09 | |
| APOBR | 28,500,970 | 28,515,291 | 49 | 5.66 | 7.56e-09 | |
| IL27 | 28,505,683 | 28,523,155 | 57 | 5.66 | 7.48e-09 | |
| CCDC101 | 28,560,249 | 28,608,111 | 181 | 4.90 | 4.87e-07 | |
| SULT1A2 | 28,603,264 | 28,608,391 | 25 | 5.40 | 6.66e-08 | |
| SULT1A1 | 28,605,196 | 28,623,625 | 51 | 5.30 | 1.14e-07 | |
| CDC37P1 | 28,700,176 | 28,701,611 | 31 | 5.26 | 1.42e-07 | |
| EIF3C | 28,722,782 | 28,747,053 | 14 | 5.37 | 8.08-08 | |
| EIF3CL | 28,722,785 | 28,747,053 | 23 | 5.47 | 4.55e-08 | |
| NPIPB9 | 28,742,728 | 28,772,850 | 8 | 5.41 | 6.29e-08 | |
| ATXN2L | 28,829,369 | 28,853,558 | 89 | 5.85 | 2.50e-09 | |
| TUFM | 28,848,732 | 28,862,729 | 55 | 5.83 | 2.83e-09 | |
| SH2B1 | 28,867,939 | 28,890,534 | 71 | 5.72 | 5.46e-09 | |
| ATP2A1 | 28,884,192 | 28,920,830 | 89 | 5.97 | 1.20e-09 | |
| NFATC2IP | 28,962,318 | 28,977,767 | 8 | 5.35 | 8.82e-08 | |
| RABEP2 | 28,910,742 | 28,942,339 | 71 | 5.43 | 2.84e-08 | |
| 17p13.3 | SRR | 2,202,244 | 2,233,553 | 121 | 5.33 | 5.03e-08 |
| TSR1 | 2,220,972 | 2,245,678 | 90 | 5.59 | 1.12e-08 | |
| 18q11.2 | C18orf8 | 21,078,434 | 21,118,311 | 132 | 5.30 | 5.65e-08 |
| NPC1 | 21,081,148 | 21,171,581 | 257 | 5.30 | 5.87e-08 | |
For the gene-based test, the p-value was set at p<2.74e-06, Bonferroni corrected p-value threshold of p<0.05 adjusted for 18,293 tests. For the S-PrediXcan analysis, p< 1.92e-07, Bonferroni corrected p-value threshold of p<0.05 adjusted for 259,825 tests. The MAGMA statistical test is based on multiple regression. Significance was tested two-sided in both analyses. Genes that were significant only in the S-PrediXcan analysis are hightlighted in grey. Location in base pairs (hg19) at beginning and end of gene (BP start/stop), number of SNPs included in the gene (#SNPs), test-statistic for the test of association (Z).
The CDC37P1 gene was significant in two different tissues; information presented here is based on the association with the smallest p-value. For full results, see Supplementary Table S4.
S-PrediXcan analysis26 revealed 133 Bonferroni-corrected significant associations across tissues targeting 21 unique genes (Supplementary Table S4-S5). Eight genes were also significant in the gene-based test, whereas 13 were novel. For genes identified in multiple tissues, directions of effects were largely consistent across tissues (Supplementary Figure S6). Again, the most significant finding was CADM2; genetic variants associated with increased liability to use cannabis are predicted to upregulate expression levels of CADM2 in 8 (non-brain) tissues, including whole blood (Z=5.88, p=4.17e-09). Of note, although CADM2 is expressed more widely in brain compared with other tissues (Supplementary Figure S7), the top SNP rs2875907 regulates the expression of CADM2 only in non-brain tissues (Supplementary Figure S8). Exploration of S-PrediXcan results in UK-Biobank data (https://imlab.shinyapps.io/gene2pheno_ukb_neale/) showed that CADM2 expression is significantly associated with multiple traits, including increased risk-taking, BMI, and reduced feelings of anxiety. Similar to the SNP- and gene-based tests of association, the S-PrediXcan analysis detected a strong signal in a high-LD region at 16p11.2. Supplementary Table S3 provides an overview of all genes that were identified in the gene-based test of association and the S-PrediXcan analyses, along with information about the gene-product and previously identified associations with the gene.
Genetic correlations with other traits
Using our GWAS results and those of other GWASs, we estimated the genetic correlation of lifetime cannabis use with 25 traits of interest, including substance use, personality, and mental health phenotypes. Fourteen traits were significantly genetically correlated with lifetime cannabis use after correction for multiple testing (Figure 4 and Supplementary Table S6). Positive genetic correlations were found with substance use phenotypes, including smoking and alcohol use and dependence, as well as with mental health phenotypes, including ADHD and schizophrenia. Furthermore, positive genetic correlations were found with risk-taking behaviour, openness to experience, and educational attainment, as well as a negative correlation with conscientiousness.
Figure 4. Genetic overlap between lifetime cannabis use and other phenotypes.

Blue dots represent point estimates of the genetic correlation, blue error bars represent 95% confidence intervals and red asterisks indicate significant associations after correction for multiple testing (two-sided p<0.002, Bonferroni corrected p-value threshold of p<0.05 adjusted for 25 tests).
MDD=Major Depressive Disorder; ADHD=Attention Deficit Hyperactivity Disorder; BMI=Body Mass Index
Causal association between cannabis use and schizophrenia: Two-sample Mendelian randomization
A positive genetic correlation was found between genetic risk factors for cannabis use and schizophrenia (rg=0.24, SE=0.03, p<0.01). To examine whether there was evidence for a causal effect of cannabis use on schizophrenia risk and vice versa we performed bi-directional two-sample Mendelian randomization (MR) analysis22. In our main analysis (Inverse Variance Weighted [IVW] regression analysis) we found some weak (non-significant) evidence for a causal influence of lifetime cannabis use on schizophrenia risk, but only for the genetic instrument containing SNPs associated with cannabis use under the p-value threshold 1e-05. The IVW regression odds ratio was 1.10 (95% confidence intervals [CIs] 0.99-1.21, p=0.074). We found stronger evidence for a causal positive influence of schizophrenia risk on lifetime cannabis use, the IVW regression odds ratio being 1.16 (95% CIs 1.06-1.27, p=0.001; see Table 3, Supplementary Table S7-S9, and Supplementary Figure S9-S10 for details).
Table 3.
Results of the bidirectional two-sample Mendelian randomization analysis between lifetime cannabis use and schizophrenia including results of 4 sensitivity analyses
| Cannabis-Schizophrenia (p<5e-08, 5 SNPs) | Cannabis-Schizophrenia p<1e-05, 69 SNPs*) | Schizophrenia-Cannabis (p<5e-08, 109 SNPs**) | ||||||||||
|---|---|---|---|---|---|---|---|---|---|---|---|---|
| B | SE (B) | OR | p | B | SE (B) | OR | p | B | SE (B) | OR | p | |
| IVW | 0.039 | 0.158 | 1.04 | 0.806 | 0.091 | 0.051 | 1.10 | 0.074 | 0.151 | 0.046 | 1.16 | 0.001 |
| Weighted Median | −0.048 | 0.105 | 0.95 | 0.649 | 0.069 | 0.049 | 1.07 | 0.156 | 0.163 | 0.049 | 1.17 | 0.001 |
| MR-Egger SIMEX | −0.044 | 0.190 | 0.96 | 0.827 | 0.106 | 0.110 | 1.11 | 0.340 | 0.071 | 0.293 | 1.07 | 0.810 |
| Weighted Mode | −0.084 | 0.125 | 0.92 | 0.536 | 0.016 | 0.071 | 1.02 | 0.823 | 0.315 | 0.178 | 1.37 | 0.080 |
| GSMR after HEIDI filtering | − | − | − | − | 0.192 | 0.080 | 1.21 | 0.017 | 0.237 | 0.038 | 1.27 | 5.36e-10 |
Significant results (p<0.05; tested two-sided) are shown in bold. Inverse Variance Weighted regression analysis (IVW); MR-Egger simulation extrapolation (SIMEX); Generalized Summary-data-based Mendelian Randomization (GSMR; HEIDI outlier analysis detects and eliminates from the analysis instruments that show significant pleiotropic effects on both risk factor and disease); risk coefficient representing the change in outcome for a one-unit increase in the exposure variable (B); standard error of the B (SE [B]); odds ratios represent the odds of schizophrenia for lifetime cannabis users versus non-users (when cannabis is the exposure) or the odds of lifetime cannabis use for those with a schizophrenia diagnosis versus those without (when schizophrenia is the exposure) (OR); p-value (p).
Number of SNPs in instrument was 74 for the GSMR analysis
Number of SNPs in instrument was 102 for the GSMR analysis.
We performed 4 sensitivity analyses that rely on distinct assumptions regarding instrument validity, to determine the robustness of these findings. The sensitivity analyses showed a consistent pattern supporting weak evidence for a causal effect of cannabis use on schizophrenia and strong evidence for a causal effect of schizophrenia on cannabis use (Table 3). As an exception, the evidence provided by MR-Egger SIMEX for a causal relation from schizophrenia risk to cannabis use, was very weak. However, since the Egger intercept was not significantly different from 0 (Supplementary Table S10), indicating no pleiotropic effects for the SNPs included in the genetic instruments27, it is likely that this method simply lacked power to be able to reject the null hypothesis of no causal effect28.
Discussion
SNP- and gene-based tests revealed several SNPs and genes strongly associated with lifetime cannabis use. Overall, 11% of the variation in the phenotype was explained by the combined effect of SNPs, which amounts to approximately 25% of twin-based heritability estimates 4. CADM2 and NCAM1, both identified in the original ICC meta-analysis 10, were among the strongest findings in the SNP-based and gene-based tests. The CADM2 gene (Cell Adhesion Molecule 2) is a synaptic cell adhesion molecule and is part of the immunoglobulin superfamily. Interestingly, CADM2 has previously been identified in GWASs of other behavioural phenotypes, including alcohol consumption 14, processing speed 29, and number of offspring and risk-taking behavior 16. A large-scale phenome-wide scan showed that CADM2 was associated with various personality traits, with the risk variant being associated with reduced anxiety, neuroticism and conscientiousness, and increased risk-taking 15. Taken together, these findings suggest that risk variants in CADM2 are associated with a broad profile of a risk-taking, optimistic, and care-free personality 15. Cannabis use has previously been associated with related personality traits, including high levels of impulsivity and novelty seeking 30,31.
NCAM1 (Neural Cell Adhesion Molecule 1) also encodes a cell adhesion protein and is member of the immunoglobulin superfamily. The encoded protein is involved in cell-matrix interactions and cell differentiation during development32. NCAM1 is located in the NCAM1-TTC12-ANKK1-DRD2 gene cluster, which is related to neurogenesis and dopaminergic neurotransmission. This gene cluster has been associated with smoking, alcohol use, and illicit drug use12,33–35 and has been implicated in psychiatric disorders, such as schizophrenia and mood disorders36,37.
A putatively novel finding comprises the 16p11.2 region (identified in the SNP and gene-based tests of association and in S-PrediXcan analysis). Deletions and duplications in this region have previously been reported to be associated with autism and schizophrenia38,39, while a common 16p11.2 inversion underlies susceptibility to asthma and obesity40. The inversion explains a substantial proportion of variability in expression of multiple genes in this region, including TUFM and SH2B140. Given the high LD in this region and high levels of co-expression of the differentially expressed genes, follow-up studies will be needed to determine which genes are functionally driving the association with cannabis use.
Several of the top genes from the gene-based and/or S-PrediXcan analyses have previously shown an association with other traits, including schizophrenia (e.g., TUFM, NCAM1), BMI or obesity (e.g. SH2B1, APOBR, ATXN2L), alcohol use (e.g. ALDH2), intelligence and cognitive performance (CNNM2, CCDC101), and externalizing and impulsive phenotypes (e.g. CADM2; see Supplementary Table S3). Interesting is also the association with HTR1A; this gene has been implicated in alcohol and nicotine co-dependence41, BMI42, psychiatric disorders43,44, and antipsychotic pharmacological treatment response45. At the phenotypic level, associations between cannabis use and psychiatric disorders2 and use of other substances30 are well-established.
There are two previous studies that found significant SNP associations for a cannabis use phenotype. Sherva et al. (2016, 46) found 3 SNPs significantly associated with cannabis dependence. In our results only one of the SNPs was available (rs77378271) and was not significantly associated with lifetime cannabis use (p=.144). The other 2 SNPs (rs143244591 and rs146091982) or their high LD proxies were not available in our data. The SNPs rs77378271 and rs146091982 were located in genes CSDM1 and SLC35G1 respectively, and neither of those were significant in our gene-based results (p=0.96 and p=0.49, respectively). Demontis et al.11 found one independent significant signal at chromosome 8 to be associated with cannabis dependence (with top SNP rs56372821, a strong eQTL for CHRNA2). Neither the SNP (p=0.55) nor the gene (p=0.52) was significantly associated with lifetime cannabis use in our study. The protein encoded by CHRNA2 is a subunit of certain nicotinic acetylcholine receptors and Demontis et al.11 provide three potential biological explanations for the link between cannabis intake and CHRNA2. However, it is possible that while CHRNA2 is associated with cannabis dependence, it does not play a role in the initial stages of cannabis use, which are more related to personality and risk-taking behaviours and less to the actual effects of cannabis intake on the brain.
The genetic correlation analyses revealed genetic overlap of cannabis use with a broad range of traits, including positive associations with substance use and mental health phenotypes. Furthermore, positive genetic correlations were found with risk-taking behaviour, openness to experience, and educational attainment, as well as a negative correlation with conscientiousness. The range of correlations suggests that genetic liability to lifetime cannabis use should be viewed in a broader context of personality and mental health traits. Specifically, the substantial genetic correlations with risk-taking behaviour and openness to experience may indicate that liability to start using cannabis is an indication of one’s personality. The positive genetic correlation between lifetime cannabis use and educational attainment was unexpected and in contrast to a previous study that found a negative genetic correlation between cannabis dependence and educational attainment 11. We therefore investigated phenotypic associations of cannabis use with household income and fluid intelligence using UK-Biobank data. Within Caucasian participants of UK-Biobank (N=438,870), categorically rated household income was higher among lifetime cannabis users compared to non-users (χ2[4]=2243, p=2.2e-16). Cannabis users also scored higher on fluid intelligence (t[50,856]=25.13, p<2e-16). These findings are in agreement with observations by Patrick et al.47, who showed that cannabis use is associated with higher childhood family social economic status (SES) in a survey of US families. Possibly, environments more often experienced by those with higher SES backgrounds, such as universities, increase accessibility to cannabis, explaining how a positive correlation between lifetime cannabis use and educational attainment in our study could arise.
We also found a significant genetic correlation between cannabis use and schizophrenia (rg=0.24), which is in line with previous findings20,21, indicating that genetic risk factors for cannabis use and schizophrenia are positively correlated. As for the causal direction of this correlation, we found weak evidence for a causal link from cannabis use to schizophrenia and much stronger evidence for a causal link from schizophrenia to cannabis use. This suggests that individuals with schizophrenia have a higher risk to start using cannabis. These results are in contrast with results from a MR study by Vaucher et al.23, who found strong evidence for a causal effect from cannabis use to schizophrenia (causality in the other direction was not tested). However, our findings are in line with a MR study by Gage et al.24 who used genetic instruments similar to ours and also found weak evidence for a causal effect of cannabis use to schizophrenia and much stronger evidence for a causal effect in the other direction. Our findings may indicate that individuals at risk for developing schizophrenia experience prodromal symptoms or negative affect that make them more likely to start using cannabis to cope or self-medicate48. The lack of strong evidence of a causal influence of cannabis use on schizophrenia may be due to the lower power of the instrumental variables. The instrumental variable based on schizophrenia SNPs explained 3.38% of variance in liability to schizophrenia. For cannabis use, the genetic instruments explained 1.12% and 0.15% of the variance in cannabis use for SNPs included with p<1e-05 and p<5e-08, respectively.
The results of our study should be interpreted in view of its strength and limitations. Important strengths of this study include the analyses of the largest population sample to date which has led to a substantial increase in power to identify genetic variants associated with lifetime cannabis use. The association analyses were complemented with several follow-up analyses to further investigate the genetic basis of cannabis use and the extent to which the genetic aetiology of cannabis use overlaps with that of other complex phenotypes. Strong genetic correlations across a wide spectrum of traits are observed, confirming that lifetime cannabis use is a relevant measure of an individual’s vulnerability.
Our study also has several limitations. First, lifetime cannabis use was analyzed as a dichotomous measure combining experimental and regular users in a single group. Additionally, the different samples varied substantially regarding the age of the participants, the prevalence of cannabis use, and the country’s policies regarding cannabis use. All these factors may introduce heterogeneity which may reduce the power to detect genetic associations. Secondly, power of some analyses may have been limited. For example, the MR analysis from cannabis to schizophrenia was based on an instrument of only 5 SNPs, and the summary statistics of some traits used for the genetic correlation analyses in LD-score regression (e.g. cannabis dependence) were based on a small sample size. Finally, some regions identified in the SNP-based analyses did not appear in the gene-based analyses. In particular, inspection of the region around rs9773390 (in ZNF704) showed that the top SNP in this region was isolated, and that the SNP was only available in two of the three datasets (not in UK-Biobank). SNPs in LD with the top SNP that were included in all three datasets were not genome-wide significant. Thus, this result may not represent a robust association.
In summary, our GWAS of lifetime cannabis use, which is the largest to date, revealed significant SNP and gene associations in 16 regions, 14 of which have not been previously implicated in cannabis use. The most promising candidates for future functional studies are CADM2, NCAM1, and multiple genes located at 16p11.2. Our findings further indicated a causal influence of schizophrenia on cannabis use and substantial genetic overlap between cannabis use and use of other substances, mental health traits, and personality traits, including smoking and alcohol use, schizophrenia, ADHD, and risk-taking.
Online Methods
Samples
Data from three sources were obtained: ICC, 23andMe, and UK-Biobank (total N=184,765). We used existing GWAS summary statistics from the ICC, based on data from 35,297 individuals of European ancestry from 16 cohorts from Northern America, Europe, and Australia10. Details regarding ethical approval and informed consents of the ICC cohorts can be found in the supplementary material of the original ICC paper10. The overall sample included 55.5% females and the age ranged between 16 and 87 years with a mean of 35.7 years. An average of 42.8% of the individuals had used cannabis during their lifetime. The second set of results was derived from the personal genetics company 23andMe Inc.. Data were available for 22,683 individuals of European Ancestry who provided informed consent and answered surveys online according to a human subjects protocol approved by Ethical & Independent Review Services, a private institutional review board. The sample included 55.3% females and the age ranged between 18 and 94 years with a mean of 54.0 years. Within the sample, 43.2% had used cannabis during their lifetime. The third sample was obtained from UK-Biobank. Data were available for 126,785 individuals of European ancestry. The sample included 56.3% females and the age ranged between 39 and 72 years with a mean of 55.0 years. Within the sample, 22.3% had used cannabis during their lifetime. Ethical approval for UK-Biobank data collection procedures has been provided by the North West Multi-centre Research Ethics Committee (MREC), the National Information Governance Board for Health & Social Care (NIGB), and the Community Health Index Advisory Group (CHIAG).
Phenotype and covariates
For all participants, self-report data were available on whether the participant had ever used cannabis during their lifetime: yes (1) versus no (0). Measurement instruments and phrasing of the questions about lifetime cannabis use differed across the samples. For the ICC study this has been described for each cohort in the original paper10. As part of their online questionnaire, 23andMe used the following phrase to examine lifetime cannabis use: ‘Have you ever in your life used the following: Marijuana?’. The UK-Biobank – as part of an online follow-up questionnaire - asked: ‘Have you taken CANNABIS (marijuana, grass, hash, ganja, blow, draw, skunk, weed, spliff, dope), even if it was a long time ago?’.
Genotyping and imputation
Genotyping was performed on various genotyping platforms and standard quality control checks were performed prior to imputation. Genotype data were imputed using the 1000 Genomes phase 1 release reference set49 for ICC and 23andMe, and the Haplotype Reference Consortium reference set50 for the UK-Biobank sample. Information about samples, genotyping, imputation, and quality control is summarized in Supplementary Table S11 and S12. After quality control, the ICC sample comprised 35,297 individuals and 6,643,927SNPs, the 23andMe sample 22,683 individuals and 7,837,888 SNPs, and the UK-Biobank sample 126,785 individuals and 10,827,718 SNPs.
Statistics
All statistical tests were two-sided and -unless stated otherwise- we used the conventional p-value of 0.05 for significance testing. When necessary, Bonferroni correction for multiple testing was applied. Randomization and blinding procedures do not apply to our study design.
Genome-wide association analyses and meta-analysis
We conducted the GWASs in 23andMe and UK-Biobank samples separately. Associations between the binary phenotype and SNPs were tested using a logistic regression model accounting for the effects of sex, age, ancestry, and genotype batch (and age2 in the UK-Biobank sample). The GWAS for UK-Biobank was performed in PLINK 1.951 and for 23andMe using an internally developed pipeline. We then meta-analysed the GWAS results from ICC, 23andMe, and UK-Biobank. Prior to conducting the meta-analysis, additional quality control of the summary statistics of each study was conducted in EasyQC52. Because of varying GWAS methods and sample characteristics (Supplementary Table S11), slightly different quality control criteria were used for the 3 samples (Supplementary Table S12). All 3 samples were aligned with the Haplotype Reference Consortium panel using the EasyQC R-package52, to ensure that rs-numbers and chromosome-basepair positions referred to the exact same variants and to correct for strand effects. Variants were deleted if they had a minor allele frequency (MAF) diverging more than 0.15 from that in the reference panel.
We applied genomic control to the three GWAS files prior to meta-analysis. Inflation due to stratification was estimated using LD-score regression, which can differentiate inflation due to population stratification from that due to real signal. The intercept was used to correct the standard errors (SEs) of the estimated effect sizes as follows: . The intercepts were b0= 1.005 (SE=0.007) for ICC, b0=1.004 (SE=0.007) for 23andMe, and b0=1.022 (SE=0.008) for UK-Biobank. We then performed a fixed effects meta-analysis based on effect sizes (log odds ratios [OR]) and standard errors in METAL53. We applied the conventional p-value threshold of 5e-08 as indication of genome-wide significance. The meta-analysis was performed on 11,733,371 SNPs that passed quality control. The combined sample size of the meta-analysis was 184,765 individuals, although the sample size varied per SNP due to differential missingness across samples.
Manhattan and QQ-plots for the GWAS, meta-analysis, and gene-based test results were created using the R-package qqman54. Regional plots were created using LocusZoom55, with varying window size for optimal visualization.
Gene-based test of association
Testing associations on the level of protein-coding genes can be more biologically meaningful and is more powerful (lower multiple testing burden) than testing solely on the level of SNPs. Gene-based analysis was used to test associations for the combined effect of SNPs in protein-coding genes taking into account LD between the SNPs and the size of the gene. The analysis was conducted in MAGMA (v 1.6) 25, which uses the 1000 Genomes reference-panel (phase 3, 2012) to control for LD. SNPs were mapped to genes if they were located in or within 10 kb from the gene, such that 5,710,956 SNPs (49%) could be mapped to at least one of 18,293 protein-coding genes in the reference panel. The significance threshold was set at p<2.74e-06 (Bonferroni corrected p-value for 18,293 tests).
Identification of genes with differential expression levels between cannabis users and non-users
We used S-PrediXcan to integrate eQTL (expression quantitative trait loci) information with our GWAS summary statistics to identify genes of which genetically predicted expression levels are associated with cannabis use26. Briefly, S-PrediXcan estimates gene expression weights by training a linear prediction model in samples with both gene expression and SNP genotype data. The weights are then used to predict gene expression from GWAS summary statistics, while incorporating the variance and co-variance of SNPs from an LD reference panel. We used expression weights for 48 tissues from the GTEx Project (V7) and the DGN whole blood cohort generated by Gamazon et al.56, and LD information from the 1000 Genomes Project Phase 357. These data were processed with beta values and standard errors from the lifetime cannabis use GWAS meta-analysis to estimate the expression-GWAS association statistic. We used a transcriptome-wide significance threshold of p<1.92e-07, which is the Bonferroni corrected threshold when adjusting for all tissues and genes (i.e. N=259,825 gene-based tests in the GTEx and DGN reference sets).
We used the GTExPortal (https://www.gtexportal.org/home/; GTEx Analysis Release V7)58 to obtain gene expression levels of CADM2 across tissues. We used the same portal to plot a multi-tissue eQTL comparison of the top SNP rs2875907. The multi-tissue eQTL plot shows both the single-tissue eQTL p-value and the multi-tissue posterior probability from METASOFT59.
SNP-based heritability analysis
The proportion of variance in liability to cannabis use that could be explained by the aggregated effect of the SNPs (h2SNPs) was estimated using LD-Score regression analysis60. The method is based on the premise that an estimated SNP effect-size includes effects of all SNPs in linkage disequilibrium (LD) with that SNP. A SNP that tags many other SNPs will have a higher probability of tagging a causal genetic variant compared to a SNP that tags few other SNPs. The LD score estimates the amount of genetic variation tagged by a SNP within a specific population. Accordingly, assuming a trait with a polygenic architecture, SNPs with a higher LD-score have on average stronger effect sizes than SNPs with lower LD-scores. When regressing the effect size from the association analysis against the LD score for each SNP, the slope of the regression line provides an estimate of the proportion of variance accounted for by all analysed SNPs60. For this analysis, we included 1,179,898 SNPs that were present in all cohorts and the HapMap 3 reference panel. Standard LD scores were used as provided by Bulik-Sullivan et al.60 based on the Hapmap 3 reference panel, restricted to European populations61.
Genetic correlations with other substances and mental health phenotypes
We used cross-trait LD-Score regression62 to estimate the genetic correlation between lifetime cannabis use and 25 other traits using GWAS summary statistics. The genetic covariance is estimated using the slope from the regression of the product of z-scores from 2 GWASs on the LD score. The estimate represents the genetic covariation between the 2 traits based on all polygenic effects captured by SNPs. Summary statistics from well-powered GWASs were available for 25 relevant substance use and mental health traits, including nicotine, alcohol and caffeine use, schizophrenia, depression, bipolar disorder, and loneliness (Supplementary Table S6). To correct for multiple testing we adopted a Bonferroni corrected p-value threshold of significance of 0.002 (0.05/25). LD scores were based on the HapMap 3 reference panel, restricted to European populations.
Causal association between cannabis use and schizophrenia: Two-sample Mendelian randomization
We performed two-sample Mendelian randomization analyses (MR)22 to examine whether there was evidence for a causal relationship from cannabis use to schizophrenia and vice versa. Analyses were performed with the R package of database and analytical platform MR-Base63 and with the gsmr R package which implements the GSMR (Generalized Summary-data based Mendelian Randomization) method64.
MR utilizes genetic variants strongly associated with an exposure variable as an ‘instrument’ to test for causal effects of the exposure on an outcome variable. This approach minimizes the risk of spurious findings due to confounding or reverse causation present in observational studies, provided that the following assumptions are met: 1) the genetic instrument is predictive of the exposure variable, 2) the genetic instrument is independent of confounders, and 3) the genetic instrument is not directly associated with the outcome variable, other than by its potential causal effect through the exposure (i.e. there is no directional pleiotropy)65. Two-sample MR refers to the application of MR methods to well-powered summary association results estimated in non-overlapping sets of individuals22 in order to reduce instrument bias towards the exposure-outcome estimate.
Bi-directional causal effects were tested between lifetime cannabis use and schizophrenia. We used genetic variants from our cannabis GWAS as well as those from the largest schizophrenia GWAS66 to serve as instruments (gene-exposure association). For lifetime cannabis use we used 2 genetic instruments; 1) an instrument including all independent genetic variants that were genome-wide significantly associated with lifetime cannabis use (p<5e-08; 5 SNPs), and 2) an instrument including independent variants with a more lenient significance threshold (p<1e-05; 69 SNPs). For schizophrenia we used one genetic instrument, including independent genetic variants that were genome-wide significantly associated with schizophrenia (instrument p<5e-08; 109 SNPs). Information on the included SNPs in the genetic instruments is provided in Supplementary Table S7.
Genetic variants were pruned (R2<0.001) and the remaining genetic variants (or proxies [R2≥0.8] when an instrumental SNP was not available in the other GWAS) were then identified in GWAS summary-level data of the outcome variable (gene-outcome association). Note that not all independent SNPs identified in the exposure dataset have been included in the analyses, because not all exposure SNPs or their proxies were also available in the outcome dataset and because some SNPs were palindromic (see Supplementary Table S7).
Evidence for both a gene-exposure and a gene-outcome association suggests a causal effect, provided that the MR assumptions are met. To combine estimates from individual genetic variants we applied Inverse-Variance Weighted (IVW) linear regression67. In addition, 4 sensitivity analyses more robust to horizontal pleiotropy were applied, each relying on distinct assumptions regarding instrument validity: Weighted Median68, MR-Egger SIMEX27, Weighted Mode69, and Generalized Summary-data based Mendelian Randomization (GSMR)64. These sensitivity analyses rely on orthogonal assumptions, making their inclusion important for triangulation. The Weighted Median approach provides a consistent estimate of the causal effect even when up to 50% of the weight comes from invalid instruments68. MR-Egger regression applies Egger’s test to MR instruments that consist of multiple genetic variants27,28. MR-Egger provides a consistent estimate of the causal effect, provided that the strength of the genetic instrument (the association between SNPs and exposure) does not correlate with the effect the instrument has on the outcome (i.e. the InSIDE assumption: Instrument Strength Independent of Direct Effect). This is a weaker assumption than the assumption of no pleiotropy. MR-Egger may, however, be biased when the NOME (NO Measurement Error) assumption is violated – i.e. the assumption that the SNP-exposure associations are known rather than estimated. Violation of NOME can be quantified with the I2 statistic, which ranges between 0 and 1. A value below 0.9 indicates a considerable risk of bias. This bias can be corrected for with MR-Egger simulation extrapolation SIMEX70. Since I2 ranged between 0.7-0.9 for our analyses, we report results from MR-Egger SIMEX in Table 3. The Weighted Mode methods can produce an unbiased result, as long as the most common causal effect estimate is a consistent estimate of the true causal effect: the Zero Modal Pleiotropy Assumption (ZEMPA)69. Finally, we performed GSMR, a method which leverages power from multiple genetic variants while accounting for LD between these variants64. Because GSMR accounts for LD, genetic variants that were included in GSMR instruments were pruned at a higher threshold of R2<0.05 (instead of R2<0.001 for the other MR analyses). Zhu et al. (2018, 64) showed that the gain of power from including SNPs in higher LD than 0.05 is limited. GSMR also allows extra filtering for SNPs that are suspected to have pleiotropic effects on both the exposure and the outcome (HEIDI filtering).
To calculate variance explained (R2) by the instrument, first we selected a single SNP to obtain an estimate of the phenotypic variance, var(y). Assuming effect sizes are normally distributed, we used the quantile function of the student t-distribution to transform the p-value of the SNP association into an estimate of t, t ^. The number of degrees of freedom and N were based on the effective sample size (4/(1/cases+1/controls)). The effective sample sizes were estimated at N=130,072 for schizophrenia and N=180,934 for cannabis use. The corresponding value of r was calculated using the formula t=r / (sqrt[(1- R2)/(N-2)] and obtained the R2 that corresponds to t with the online tool http://vassarstats.net/rsig.html. Subsequently, we approximated the variance of the phenotype y using var (y)=(2*MAF*(1-MAF)*β2)/ R2 in which MAF denotes the Minor Allele Frequency and β the effect size of the specific SNP. Finally, we used the estimated value of var (y) to calculate the R2 for the remaining SNPs of interest using R2=(2*MAF*(1-MAF)*β2)/var(y); and summed the R2 of all SNPs of interest included in the instrumental variable to obtain an estimate of the total R2 explained by the instrument.
Data availability
General information on study design and data availability are included in the Life Sciences Reporting Summary. Summary statistics based on the UK-Biobank and ICC samples and full results from the top 10,000 SNPs based on all three subsamples (i.e. including the 23andMe sample) will be available via LDhub (http://ldsc.broadinstitute.org/gwashare/). Codes and scripts are available upon reasonable request. Full summary statistics can only be provided after permission by 23andMe.
Supplementary Material
Acknowledgements
JP and JMV are supported by the European Research Council (Beyond the Genetics of Addiction ERC-284167, PI JM Vink). KJHV is supported by the Foundation Volksbond Rotterdam. NAG is supported by US National Institutes of Health, National Institute on Drug Abuse R00DA023549. JLT is supported by the Netherlands Organization for Scientific Research (NWO; Rubicon grant 446-16-009). SM is supported by an Australian Research Council Fellowship. Statistical analyses were partly carried out on the Genetic Cluster Computer (http://www.geneticcluster.org) hosted by SURFsara and financially supported by the Netherlands Organization for Scientific Research (NWO 480-05-003 PI: Posthuma) along with a supplement from the Dutch Brain Foundation and the VU University Amsterdam. MGN is supported by Royal Netherlands Academy of Science Professor Award to DIB (PAH/6635). Part of the computation of this project was funded by NWO exact sciences for the application: “Population scale Genetic Analysis” awarded to MGN. The genome-wide association analysis on the UK-Biobank dataset has been conducted using the UK-Biobank resource under application numbers 9905, 16406 and 25331.
We would like to thank the research participants and employees of 23andMe for making this work possible. The Substance Use Disorders Working Group of the Psychiatric Genomics Consortium (PGC-SUD) is supported by funds from NIDA and NIMH to MH109532 and, previously, with analyst support from NIAAA to U01AA008401 (COGA). We gratefully acknowledge our contributing studies and the participants in those studies without whom this effort would not have been possible. JM’s contributions were partially supported by the Peter Boris Chair in Addictions Research. SS-R was supported by the Frontiers of Innovation Scholars Program (FISP; #3-P3029), the Interdisciplinary Research Fellowship in NeuroAIDS (IRFN; MH081482) and a pilot award from DA037844. RM was supported by the European Union through the European Regional Development Fund (Project No. 2014-2020.4.01.15-0012) and the European Union’s Horizon 2020 research and innovaLon programme under grant agreements No 692065 and 692145. JK was supported by Academy Professorship grants by the Academy of Finland (263278, 292782). MR is a recipient of a Miguel de Servet contract from the Instituto de Salud Carlos III, Spain (CP09/00119 and CPII15/00023).
Footnotes
Competing interests
PF, SLE, and members of the 23andMe Research Team are employees of 23andMe Inc.
JARQ was on the speakers’ bureau and/or acted as consultant for Eli-Lilly, Janssen-Cilag, Novartis, Shire, Lundbeck, Almirall, BRAINGAZE, Sincrolab, and Rubió in the last 5 years. He also received travel awards (air tickets + hotel) for taking part in psychiatric meetings from Janssen-Cilag, Rubió, Shire, and Eli- Lilly. The Department of Psychiatry chaired by him received unrestricted educational and research support from the following pharmaceutical companies in the last 5 years: Eli-Lilly, Lundbeck, Janssen- Cilag, Actelion, Shire, Ferrer, and Rubió.
References
- 1.Volkow ND, Compton WM & Weiss SR Adverse health effects of marijuana use. The New England journal of medicine 371, 879, doi: 10.1056/NEJMc1407928 (2014). [DOI] [PubMed] [Google Scholar]
- 2.Moore TH et al. Cannabis use and risk of psychotic or affective mental health outcomes: a systematic review. Lancet (London, England) 370, 319–328, doi: 10.1016/s0140-6736(07)61162-3 (2007). [DOI] [PubMed] [Google Scholar]
- 3.Hall W & Degenhardt L Adverse health effects of non-medical cannabis use. Lancet (London, England) 374, 1383–1391 (2009). [DOI] [PubMed] [Google Scholar]
- 4.Verweij KJH et al. Genetic and environmental influences on cannabis use initiation and problematic use: a meta-analysis of twin studies. Addiction 105, 417–430, doi: 10.1111/j.1360-0443.2009.02831.x (2010). [DOI] [PMC free article] [PubMed] [Google Scholar]
- 5.Agrawal A, Neale MC, Jacobson KC, Prescott CA & Kendler KS Illicit drug use and abuse/dependence: modeling of two-stage variables using the CCC approach. Addict Behav 30, 1043–1048 (2005). [DOI] [PubMed] [Google Scholar]
- 6.Agrawal A & Lynskey MT The genetic epidemiology of cannabis use, abuse and dependence. Addiction 101, 801–812 (2006). [DOI] [PubMed] [Google Scholar]
- 7.Verweij KJH et al. The genetic aetiology of cannabis use initiation: a meta-analysis of genome-wide association studies and a SNP-based heritability estimation. Addiction Biology 18, 846–850, doi: 10.1111/j.1369-1600.2012.00478.x (2013). [DOI] [PMC free article] [PubMed] [Google Scholar]
- 8.Agrawal A et al. A genome-wide association study of DSM-IV cannabis dependence. Addiction Biology 16, 514–518, doi: 10.1111/j.1369-1600.2010.00255.x (2011). [DOI] [PMC free article] [PubMed] [Google Scholar]
- 9.Minica CC et al. Heritability, SNP- and Gene-Based Analyses of Cannabis Use Initiation and Age at Onset. Behav Genet, doi: 10.1007/s10519-015-9723-9 (2015). [DOI] [PMC free article] [PubMed] [Google Scholar]
- 10.Stringer S et al. Genome-wide association study of lifetime cannabis use based on a large meta-analytic sample of 32 330 subjects from the International Cannabis Consortium. Translational psychiatry 6, e769, doi: 10.1038/tp.2016.36 (2016). [DOI] [PMC free article] [PubMed] [Google Scholar]
- 11.Demontis D et al. Genome-wide association study implicates CHRNA2 in cannabis use disorder. bioRxiv, doi: 10.1101/237321 (2018). [DOI] [PMC free article] [PubMed] [Google Scholar]
- 12.Gelernter J et al. Haplotype spanning TTC12 and ANKK1, flanked by the DRD2 and NCAM1 loci, is strongly associated to nicotine dependence in two distinct American populations. Human molecular genetics 15, 3498–3507, doi: 10.1093/hmg/ddl426 (2006). [DOI] [PubMed] [Google Scholar]
- 13.Yang BZ et al. Association of haplotypic variants in DRD2, ANKK1, TTC12 and NCAM1 to alcohol dependence in independent case-control and family samples. Human molecular genetics 16, 2844–2853, doi: 10.1093/hmg/ddm240 (2007). [DOI] [PubMed] [Google Scholar]
- 14.Clarke T-K et al. Genome-wide association study of alcohol consumption and genetic overlap with other health-related traits in UK Biobank (N= 112,117). bioRxiv, 116707 (2017). [DOI] [PMC free article] [PubMed] [Google Scholar]
- 15.Boutwell B et al. Replication and characterization of CADM2 and MSRA genes on human behavior. Heliyon 3, e00349, doi: 10.1016/j.heliyon.2017.e00349 (2017). [DOI] [PMC free article] [PubMed] [Google Scholar]
- 16.Day FR et al. Physical and neurobehavioral determinants of reproductive onset and success. 48, 617–623, doi: 10.1038/ng.3551 (2016). [DOI] [PMC free article] [PubMed] [Google Scholar]
- 17.Andreasson S, Allebeck P, Engstrom A & Rydberg U Cannabis and schizophrenia. A longitudinal study of Swedish conscripts. Lancet (London, England) 2, 1483–1486 (1987). [DOI] [PubMed] [Google Scholar]
- 18.Smit F, Bolier L & Cuijpers P Cannabis use and the risk of later schizophrenia: a review. Addiction 99, 425–430, doi: 10.1111/j.1360-0443.2004.00683.x (2004). [DOI] [PubMed] [Google Scholar]
- 19.Volkow ND et al. Effects of Cannabis Use on Human Behavior, Including Cognition, Motivation, and Psychosis: A Review. JAMA psychiatry 73, 292–297, doi: 10.1001/jamapsychiatry.2015.3278 (2016). [DOI] [PubMed] [Google Scholar]
- 20.Verweij KJ et al. Short communication: Genetic association between schizophrenia and cannabis use. Drug Alcohol Depend 171, 117–121, doi: 10.1016/j.drugalcdep.2016.09.022 (2017). [DOI] [PMC free article] [PubMed] [Google Scholar]
- 21.Power RA et al. Genetic predisposition to schizophrenia associated with increased use of cannabis. Molecular psychiatry, doi: 10.1038/mp.2014.51 (2014). [DOI] [PMC free article] [PubMed] [Google Scholar]
- 22.Burgess S, Scott RA, Timpson NJ, Davey Smith G & Thompson SG Using published data in Mendelian randomization: a blueprint for efficient identification of causal risk factors. European journal of epidemiology 30, 543–552, doi: 10.1007/s10654-015-0011-z (2015). [DOI] [PMC free article] [PubMed] [Google Scholar]
- 23.Vaucher J et al. Cannabis use and risk of schizophrenia: a Mendelian randomization study. Molecular psychiatry, doi: 10.1038/mp.2016.252 (2017). [DOI] [PMC free article] [PubMed] [Google Scholar]
- 24.Gage SH et al. Assessing causality in associations between cannabis use and schizophrenia risk: a two-sample Mendelian randomization study. Psychol Med 47, 971–980, doi: 10.1017/s0033291716003172 (2017). [DOI] [PMC free article] [PubMed] [Google Scholar]
- 25.de Leeuw CA, Mooij JM, Heskes T & Posthuma D MAGMA: generalized gene-set analysis of GWAS data. PLoS computational biology 11, e1004219, doi: 10.1371/journal.pcbi.1004219 (2015). [DOI] [PMC free article] [PubMed] [Google Scholar]
- 26.Barbeira AN et al. Exploring the phenotypic consequences of tissue specific gene expression variation inferred from GWAS summary statistics. bioRxiv, doi: 10.1101/045260 (2017). [DOI] [PMC free article] [PubMed] [Google Scholar]
- 27.Bowden J, Davey Smith G & Burgess S Mendelian randomization with invalid instruments: effect estimation and bias detection through Egger regression. International journal of epidemiology 44, 512–525, doi: 10.1093/ije/dyv080 (2015). [DOI] [PMC free article] [PubMed] [Google Scholar]
- 28.Burgess S & Thompson SG Interpreting findings from Mendelian randomization using the MR-Egger method. European journal of epidemiology 32, 377–389, doi: 10.1007/s10654-017-0255-x (2017). [DOI] [PMC free article] [PubMed] [Google Scholar]
- 29.Ibrahim-Verbaas CA et al. GWAS for executive function and processing speed suggests involvement of the CADM2 gene. Molecular psychiatry 21, 189–197, doi: 10.1038/mp.2015.37 (2016). [DOI] [PMC free article] [PubMed] [Google Scholar]
- 30.Walther B, Morgenstern M & Hanewinkel R Co-occurrence of addictive behaviours: personality factors related to substance use, gambling and computer gaming. European addiction research 18, 167–174, doi: 10.1159/000335662 (2012). [DOI] [PubMed] [Google Scholar]
- 31.Martin CA et al. Sensation seeking, puberty, and nicotine, alcohol, and marijuana use in adolescence. Journal of the American Academy of Child and Adolescent Psychiatry 41, 1495–1502, doi: 10.1097/00004583-200212000-00022 (2002). [DOI] [PubMed] [Google Scholar]
- 32.Nielsen J, Kulahin N & Walmod PS Extracellular protein interactions mediated by the neural cell adhesion molecule, NCAM: heterophilic interactions between NCAM and cell adhesion molecules, extracellular matrix proteins, and viruses. Advances in experimental medicine and biology 663, 23–53, doi: 10.1007/978-1-4419-1170-4_2 (2010). [DOI] [PubMed] [Google Scholar]
- 33.Rubinek T et al. The cell adhesion molecules N-cadherin and neural cell adhesion molecule regulate human growth hormone: a novel mechanism for regulating pituitary hormone secretion. The Journal of clinical endocrinology and metabolism 88, 3724–3730, doi: 10.1210/jc.2003-030090 (2003). [DOI] [PubMed] [Google Scholar]
- 34.Ducci F et al. TTC12-ANKK1-DRD2 and CHRNA5-CHRNA3-CHRNB4 influence different pathways leading to smoking behavior from adolescence to mid-adulthood. Biol Psychiatry 69, 650–660, doi: 10.1016/j.biopsych.2010.09.055 (2011). [DOI] [PMC free article] [PubMed] [Google Scholar]
- 35.Bidwell LC et al. NCAM1-TTC12-ANKK1-DRD2 variants and smoking motives as intermediate phenotypes for nicotine dependence. Psychopharmacology 232, 1177–1186, doi: 10.1007/s00213-014-3748-2 (2015). [DOI] [PMC free article] [PubMed] [Google Scholar]
- 36.Atz ME, Rollins B & Vawter MP NCAM1 association study of bipolar disorder and schizophrenia: polymorphisms and alternatively spliced isoforms lead to similarities and differences. Psychiatric genetics 17, 55–67, doi: 10.1097/YPG.0b013e328012d850 (2007). [DOI] [PMC free article] [PubMed] [Google Scholar]
- 37.Petrovska J et al. The NCAM1 gene set is linked to depressive symptoms and their brain structural correlates in healthy individuals. Journal of psychiatric research 91, 116–123, doi: 10.1016/j.jpsychires.2017.03.007 (2017). [DOI] [PubMed] [Google Scholar]
- 38.Weiss LA et al. Association between microdeletion and microduplication at 16p11.2 and autism. The New England journal of medicine 358, 667–675, doi: 10.1056/NEJMoa075974 (2008). [DOI] [PubMed] [Google Scholar]
- 39.McCarthy SE et al. Microduplications of 16p11.2 are associated with schizophrenia. Nature genetics 41, 1223–1227, doi: 10.1038/ng.474 (2009). [DOI] [PMC free article] [PubMed] [Google Scholar]
- 40.Gonzalez JR et al. A common 16p11.2 inversion underlies the joint susceptibility to asthma and obesity. American journal of human genetics 94, 361–372, doi: 10.1016/j.ajhg.2014.01.015 (2014). [DOI] [PMC free article] [PubMed] [Google Scholar]
- 41.Zuo L et al. Genome-wide significant association signals in IPO11-HTR1A region specific for alcohol and nicotine codependence. Alcoholism, clinical and experimental research 37, 730–739, doi: 10.1111/acer.12032 (2013). [DOI] [PMC free article] [PubMed] [Google Scholar]
- 42.Speliotes EK et al. Association analyses of 249,796 individuals reveal 18 new loci associated with body mass index. Nature genetics 42, 937–948, doi: 10.1038/ng.686 (2010). [DOI] [PMC free article] [PubMed] [Google Scholar]
- 43.Donaldson ZR et al. The functional serotonin 1a receptor promoter polymorphism, rs6295, is associated with psychiatric illness and differences in transcription. Translational psychiatry 6, e746, doi: 10.1038/tp.2015.226 (2016). [DOI] [PMC free article] [PubMed] [Google Scholar]
- 44.Gatt JM, Burton KL, Williams LM & Schofield PR Specific and common genes implicated across major mental disorders: a review of meta-analysis studies. Journal of psychiatric research 60, 1–13, doi: 10.1016/j.jpsychires.2014.09.014 (2015). [DOI] [PubMed] [Google Scholar]
- 45.Takekita Y et al. HTR1A Polymorphisms and Clinical Efficacy of Antipsychotic Drug Treatment in Schizophrenia: A Meta-Analysis. The international journal of neuropsychopharmacology 19, doi: 10.1093/ijnp/pyv125 (2016). [DOI] [PMC free article] [PubMed] [Google Scholar]
- 46.Sherva R et al. Genome-wide association study of cannabis dependence severity, novel risk variants, and shared genetic risks. JAMA psychiatry 73, 472–480 (2016). [DOI] [PMC free article] [PubMed] [Google Scholar]
- 47.Patrick ME, Wightman P, Schoeni RF & Schulenberg JE Socioeconomic status and substance use among young adults: a comparison across constructs and drugs. Journal of studies on alcohol and drugs 73, 772–782 (2012). [DOI] [PMC free article] [PubMed] [Google Scholar]
- 48.Muller-Vahl KR & Emrich HM Cannabis and schizophrenia: towards a cannabinoid hypothesis of schizophrenia. Expert review of neurotherapeutics 8, 1037–1048, doi: 10.1586/14737175.8.7.1037 (2008). [DOI] [PubMed] [Google Scholar]
- 49.Abecasis GR et al. An integrated map of genetic variation from 1,092 human genomes. Nature 491, 56–65, doi: 10.1038/nature11632 (2012). [DOI] [PMC free article] [PubMed] [Google Scholar]
- 50.McCarthy S & Das S A reference panel of 64,976 haplotypes for genotype imputation. 48, 1279–1283, doi: 10.1038/ng.3643 (2016). [DOI] [PMC free article] [PubMed] [Google Scholar]
- 51.Chang CC et al. Second-generation PLINK: rising to the challenge of larger and richer datasets. GigaScience 4, 7, doi: 10.1186/s13742-015-0047-8 (2015). [DOI] [PMC free article] [PubMed] [Google Scholar]
- 52.Winkler TW & Day FR Quality control and conduct of genome-wide association meta-analyses. 9, 1192–1212, doi: 10.1038/nprot.2014.071 (2014). [DOI] [PMC free article] [PubMed] [Google Scholar]
- 53.Willer CJ, Li Y & Abecasis GR METAL: fast and efficient meta-analysis of genomewide association scans. Bioinformatics (Oxford, England) 26, 2190–2191, doi: 10.1093/bioinformatics/btq340 (2010). [DOI] [PMC free article] [PubMed] [Google Scholar]
- 54.Turner SD qqman: an R package for visualizing GWAS results using Q-Q and manhattan plots. bioRxiv, doi: 10.1101/005165 (2014). [DOI] [Google Scholar]
- 55.Pruim RJ et al. LocusZoom: regional visualization of genome-wide association scan results. Bioinformatics (Oxford, England) 26, 2336–2337, doi: 10.1093/bioinformatics/btq419 (2010). [DOI] [PMC free article] [PubMed] [Google Scholar]
- 56.Gamazon ER & Wheeler HE A gene-based association method for mapping traits using reference transcriptome data. 47, 1091–1098, doi: 10.1038/ng.3367 (2015). [DOI] [PMC free article] [PubMed] [Google Scholar]
- 57.Delaneau O & Marchini J Integrating sequence and array data to create an improved 1000 Genomes Project haplotype reference panel. Nature communications 5, 3934, doi: 10.1038/ncomms4934 (2014). [DOI] [PMC free article] [PubMed] [Google Scholar]
- 58.Carithers LJ et al. A Novel Approach to High-Quality Postmortem Tissue Procurement: The GTEx Project. Biopreservation and biobanking 13, 311–319, doi: 10.1089/bio.2015.0032 (2015). [DOI] [PMC free article] [PubMed] [Google Scholar]
- 59.Sul JH, Han B, Ye C, Choi T & Eskin E Effectively identifying eQTLs from multiple tissues by combining mixed model and meta-analytic approaches. PLoS Genet 9, e1003491, doi: 10.1371/journal.pgen.1003491 (2013). [DOI] [PMC free article] [PubMed] [Google Scholar]
- 60.Bulik-Sullivan BK, Loh PR, Finucane HK, Ripke S & Yang J LD Score regression distinguishes confounding from polygenicity in genome-wide association studies. Nature genetics 47, 291–295, doi: 10.1038/ng.3406 (2015). [DOI] [PMC free article] [PubMed] [Google Scholar]
- 61.Altshuler DM et al. Integrating common and rare genetic variation in diverse human populations. Nature 467, 52–58, doi: 10.1038/nature09298 (2010). [DOI] [PMC free article] [PubMed] [Google Scholar]
- 62.Bulik-Sullivan BK, Finucane HK, Anttila V, Gusev A & Day FR An atlas of genetic correlations across human diseases and traits. Nature genetics 47, 1236–1241, doi: 10.1038/ng.3406 (2015). [DOI] [PMC free article] [PubMed] [Google Scholar]
- 63.Hemani G et al. MR-Base: a platform for systematic causal inference across the phenome using billions of genetic associations. BioRxiv, doi:http://www.biorxiv.org/content/early/2016/12/16/078972 (2017). [Google Scholar]
- 64.Zhu Z et al. Causal associations between risk factors and common diseases inferred from GWAS summary data. 9, 224, doi: 10.1038/s41467-017-02317-2 (2018). [DOI] [PMC free article] [PubMed] [Google Scholar]
- 65.Davey Smith G & Hemani G Mendelian randomization: genetic anchors for causal inference in epidemiological studies. Human molecular genetics 23, R89–98, doi: 10.1093/hmg/ddu328 (2014). [DOI] [PMC free article] [PubMed] [Google Scholar]
- 66.Schizophrenia Working Group of the Psychiatric Genomics Consortium. Biological insights from 108 schizophrenia-associated genetic loci. Nature 511, 421–427, doi: 10.1038/nature13595 (2014). [DOI] [PMC free article] [PubMed] [Google Scholar]
- 67.Ehret GB et al. Genetic variants in novel pathways influence blood pressure and cardiovascular disease risk. Nature 478, 103–109, doi: 10.1038/nature10405 (2011). [DOI] [PMC free article] [PubMed] [Google Scholar]
- 68.Bowden J, Davey Smith G, Haycock PC & Burgess S Consistent Estimation in Mendelian Randomization with Some Invalid Instruments Using a Weighted Median Estimator. Genetic epidemiology 40, 304–314, doi: 10.1002/gepi.21965 (2016). [DOI] [PMC free article] [PubMed] [Google Scholar]
- 69.Hartwig FP, Davey Smith G & Bowden J Robust Inference In Two-Sample Mendelian Randomisation Via The Zero Modal Pleiotropy Assumption. bioRxiv, doi: 10.1101/126102 (2017). [DOI] [PMC free article] [PubMed] [Google Scholar]
- 70.Bowden J et al. Assessing the suitability of summary data for two-sample Mendelian randomization analyses using MR-Egger regression: the role of the I2 statistic. International journal of epidemiology 45, 1961–1974, doi: 10.1093/ije/dyw220 (2016). [DOI] [PMC free article] [PubMed] [Google Scholar]
Associated Data
This section collects any data citations, data availability statements, or supplementary materials included in this article.
Supplementary Materials
Data Availability Statement
General information on study design and data availability are included in the Life Sciences Reporting Summary. Summary statistics based on the UK-Biobank and ICC samples and full results from the top 10,000 SNPs based on all three subsamples (i.e. including the 23andMe sample) will be available via LDhub (http://ldsc.broadinstitute.org/gwashare/). Codes and scripts are available upon reasonable request. Full summary statistics can only be provided after permission by 23andMe.