Abstract
Recent studies have suggested an association between certain members of the Fusobacterium genus, especially F. nucleatum, and the progression of advanced colorectal carcinoma (CRC). We assessed such an association of the gut microbiota in Japanese patients with colorectal adenoma (CRA) or intramucosal CRC using colonoscopy aspirates. We analyzed samples from 81 Japanese patients, including 47 CRA and 24 intramucosal CRC patients, and 10 healthy subjects. Metagenomic analysis of the V3-V4 region of the 16S ribosomal RNA gene was performed. The linear discriminant analysis (LDA) effect size (LEfSe) method was used to examine microbial dysbiosis, revealing significant differences in bacterial abundances between the healthy controls and CRA or intramucosal CRC patients. In particular, F. varium was statistically more abundant in patients with CRA and intramucosal CRC than in healthy subjects. Here, we present the metagenomic profile of CRA and intramucosal CRC and demonstrate that F. varium is at least partially involved in the pathogenesis of CRA and intramucosal CRC.
Introduction
Increasing evidence suggests that the human gut microbiota contributes to chronic inflammation and plays important roles in the early stage of carcinogenesis of colorectal adenocarcinoma (CRC) and colorectal adenoma (CRA) through interference with various intestinal functions [1, 2]. Chronic inflammation induced by the microbiota is associated with altered interactions between the host and the microbiota, microbial imbalance (dysbiosis), and infections with specific pathogens in patients with CRC or CRA [3]. Studies recently suggested that Fusobacterium spp. overall (Pan-fusobacterium), especially Fusobacterium nucleatum (F. nucleatum), are abundant in advanced CRC tissue and may contribute to invasion and metastatic proliferation [4–6]. Indeed, F. nucleatum in advanced CRC is associated with CpG island methylator phenotype (CIMP) status, microsatellite instability (MSI), and mutations in the BRAF, KRAS, TP53, CHD7 and CHD8 genes [4–7]. This evidence suggests an association of the gut microbiota with the early stage of carcinogenesis of CRC following microbial dysbiosis. Moreover, the procarcinogenic activities of specific pathogens and certain microbiota-derived metabolites [8] act on colonic epithelial cells during CRC genesis. Further research may be necessary to better understand the mechanisms that underlie the association between gut microorganisms and the early stage of carcinogenesis of CRC and CRA.
In addition to F. nucleatum, F. varium [9] has also recently gained notoriety as a gastrointestinal pathogen [10, 11]. Indeed, links between the enrichment of Fusobacterium spp. and the development of advanced CRC have been described [4, 12–14]. These reports suggest an association between F. varium or F. nucleatum infections and the genesis of CRC. However, little is known about microbiome profiles during the transition from normal colonic mucosae and CRA to intramucosal CRC. In this study, we focused on microbiome profiles in CRA and intramucosal CRC patients compared to those in healthy subjects. We present a metagenomic profiling study of the microbiomes of CRA and intramucosal CRC patients using colonoscopy aspirates, which can serve as a substitute for the gut microbiota in tissues [15].
Materials and methods
Study design and enrolled subjects
The study was reviewed and approved by the ethics committee of the Jikei Institutional Ethical Board, Jikei University School of Medicine, and the clinical study committee of Jikei University Kashiwa Hospital [No. 23–277 (6738)] on February 6, 2012. Written informed consent was obtained from each patient included in the study. All procedures were performed in accordance with the Helsinki Declaration. Eighty-one consecutive Japanese people with no previous personal history of cancer were prospectively enrolled in this study and underwent regular colonoscopy at Jikei Kashiwa Hospital. After a complete colonoscopic examination, these subjects were newly classified as healthy (n = 10), CRA patients (n = 47), or intramucosal CRC patients (n = 24). Intramucosal CRC is in its earliest stage (stage 0) and is also known as carcinoma in situ or intramucosal carcinoma. Intramucosal CRC has not yet grown beyond the inner mucosal layer of the colorectum [16, 17]. Among the 81 enrolled subjects, there were no significant differences in characteristics (sex, age, body mass index, diabetes, hypercholesterolemia, hypertension, antibiotic treatment, past history, and reason for colonoscopy) between the groups (healthy, CRA, and intramucosal CRC) (Table 1).
Table 1. Characteristics of enrolled patients with colorectal adenoma, intramucosal colorectal carcinoma, and healthy subjects.
| Characteristics of enrolled subjects | Colorectal adenoma | Intramucosal colorectal carcinoma | Healthy subjects | P value |
|---|---|---|---|---|
| Number | n = 47 | n = 24 | n = 10 | |
| Males/Females | 31/16 | 17/7 | 3/7 | 0.260 |
| Age (mean ± SD) | 67±9 | 66±8 | 58±15 | 0.347 |
| Body Mass Index (BMI) (mean ± SD) | 23±3 | 22±3 | 22±3 | 0.159 |
| Diabetes: n (%) | 6(12.8%) | 7(29.2%) | 0(0) | 0.257 |
| Hypercholesterolemia: n (%) | 12(25.5%) | 3(12.5%) | 2(20%) | 0.142 |
| Hypertension: n (%) | 17(36.2%) | 12(50%) | 0(0) | 0.308 |
| Antibiotic treatment, any, n (%) | 2(4.3%) | 1(4.2%) | 1(10%) | 0.088 |
| Reason for colonoscopy: n (%) | ||||
| Screening | 3(6.4%) | 0(0) | 1(10%) | 0.157 |
| Symptoms | 1(2.1%) | 3(12.5%) | 6(60%) | 0.561 |
| Positive for an acronym for fecal occult blood test (FOBT) | 11(23.4%) | 4(16.7%) | 3(30%) | 0.100 |
| Control for polyps | 20(42.5%) | 10(41.7%) | 0(0) | 0.288 |
| Polypectomy | 12(25.5%) | 7(29.2%) | 0(0) | 0.211 |
Colonoscopy aspirates and DNA extraction
Colonoscopy aspirates, including the intestinal content microbiota obtained from the rectum, were collected [15]. We employed a PAXgene system (Becton Dickinson, Franklin Lakes, USA) to fix the colonoscopic aspirates. Samples obtained from 10 mL of colonoscopy aspirates were centrifuged, frozen, and stored at -80°C until analysis. Total DNA was extracted from the frozen samples as described previously [18].
16S microbiota analysis
The V3-V4 region of the 16S rRNA gene was first PCR-amplified using the 16S amplicon PCR forward primer 5'-CGCTCTTCCGATCTCTGTACGGRAGGCAGCAG -3' and reverse primer 5'-CGCTCTTCCGATCTGACGGACTACHVGGGTWTCTAAT -3'. A 1-μl sample of the PCR product was amplified using the following barcoded primers adapted for Illumina MiSeq: Fwd 5'-AATGATACGGCGACCACCGAGATCTACAC XXXXXXXX ACACTCTTTCCCTACAC GACGCTCTTCCGATCTCTG-3' and Rev 5'-CAAGCAGAAGACGGCATACGAGAT XXXXXXXX GTGACTGGAGTTCAGACGTGTGCTCTTCCGATCTGAC-3', where X represents a barcode base. The PCR was prepared and run, and the 16S V3-V4 amplicons were purified. The amplicon libraries were pooled in equimolar concentrations, and the V3-V4 region of the 16S rRNA gene was sequenced using a MiSeq Reagent Kit on the Illumina MiSeq platform (Shallowater, US) for paired-end sequencing as described previously [19]. The obtained sequences were analyzed using Quantitative Insights Into Microbial Ecology (QIIME) version 1.8.0, which is software that performs microbial community analysis and taxonomic classification of microbial genomes [20, 21]. Potential chimeric sequences were removed using UCHIME, and the remaining sequences were assigned to operational taxonomic units (OTUs) using ppen-reference OTU picking with a 97% threshold of pairwise identity and then classified taxonomically using the Greengenes reference database (http://greengenes.secondgenome.com/downloads/database/13_5) [22]. The microbial diversities, Shannon diversity index, and weighted and unweighted UniFrac distances were estimated using QIIME version 1.8.0 software.
Fusobacterium-targeted analysis
A primer set specific for sequencing the DNA of Fusobacterium spp. by MiSeq was designed based on the internal transcribed spacer (ITS) region between the 16S rRNA and 23S rRNA genes (S1 Fig). The forward primer was 5'-CGCTCTTCCGATCTCTGGGWACCRMGTGAACTGAAACATC- 3', and the reverse primer was 5' -CGCTCTTCCGATCTGACCCTTAYGAGATWTGGTCCTC- 3'. Each 1-μl sample of DNA was amplified in triplicate using the following protocol: preheating at 94°C for 3 min, 20 cycles of denaturation at 94°C for 30 s, annealing at 50°C for 30 s and extension at 72°C for 30 s, with a final terminal extension at 72°C for 10 min. The steps from the second amplification to the assignment and to OTU picking were the same as mentioned above, and sequences were then classified taxonomically using BLASTN against the NCBI nonredundant database.
Statistical analysis
Differences in the Shannon diversity index between the 2 groups were analyzed by t-test. Intergroup differences at the phylum, class, order, family, genus and species level in each cluster were analyzed by the linear discriminant analysis (LDA) effect size (LEfSe) method [23] with default settings on the website https://huttenhower.sph.harvard.edu/galaxy/root. LEfSe uses the two-tailed nonparametric Kruskal-Wallis test to evaluate the significance of differences in OTUs in 2 groups. A set of pairwise tests among 2 groups was performed using the unpaired Wilcoxon test. Finally, LDA was performed to estimate the effect size of each differentially abundant OTU [23, 24]. The results are expressed as the mean ± SEM. A strength of the LEfSe method compared with standard statistical approaches is that in addition to providing p values, it estimates the magnitude of the association between each OTU and the grouping categories, such as CRA, intramucosal CRC, and healthy subjects [23, 24]. For stringency, the gut microbiotas were considered significantly different if their differences had a p value < 0.05 and an LDA score (log10) > 3, i.e., one order of magnitude greater than the default of the LEfSe method [23, 24]. The Kruskal-Wallis and Cramer V tests were used to determine associations between the groups of subjects and characteristics. StatView software, version J 5.1 (SAS Institute Inc., Cary, N.C., USA), was used for all analyses.
Results
Overview of gut microbiota composition in patients and healthy subjects
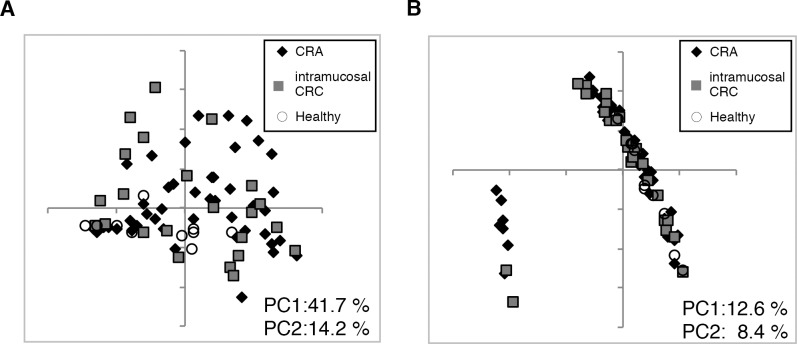
A total of 740,273 high-quality paired sequences were obtained from the 81 samples, with a mean of 9,139 ± 3,185. We first calculated UniFrac distances to determine the similarity between microbial communities. Weighted UniFrac PCoA (principal coordinate analysis) indicated that no distinct aggregation was observed between CRA and intramucosal CRC patients, whereas healthy subjects were found to be aggregated on the lower side (Fig 1A), suggesting a difference in gut microbiota composition between these patients and healthy subjects. Two distinct aggregations were observed in the data of Unweighted UniFrac PCoA; however, the subject in each group was not biased (Fig 1B), suggesting that the balance of gut microbes is more important than the existence of certain bacterial members in the CRA or intramucosal CRC patient gut. The Shannon index demonstrated a significant difference between CRA patients and healthy subjects (p = 0.019, S2 Fig). Moreover, there was no statistically significant difference in the Shannon index between patients with CRC and healthy subjects (p = 0.068, S2 Fig).
Fig 1.
Principal coordinates analysis (PCoA) based on (A) weighted and (B) unweighted UniFrac distance. Diamond, CRA patient; Square, intramucosal CRC patient; Circle, healthy subject.
LEfSe analysis and LDA based on OTUs characterize microbiomes in patients with CRA and healthy subjects
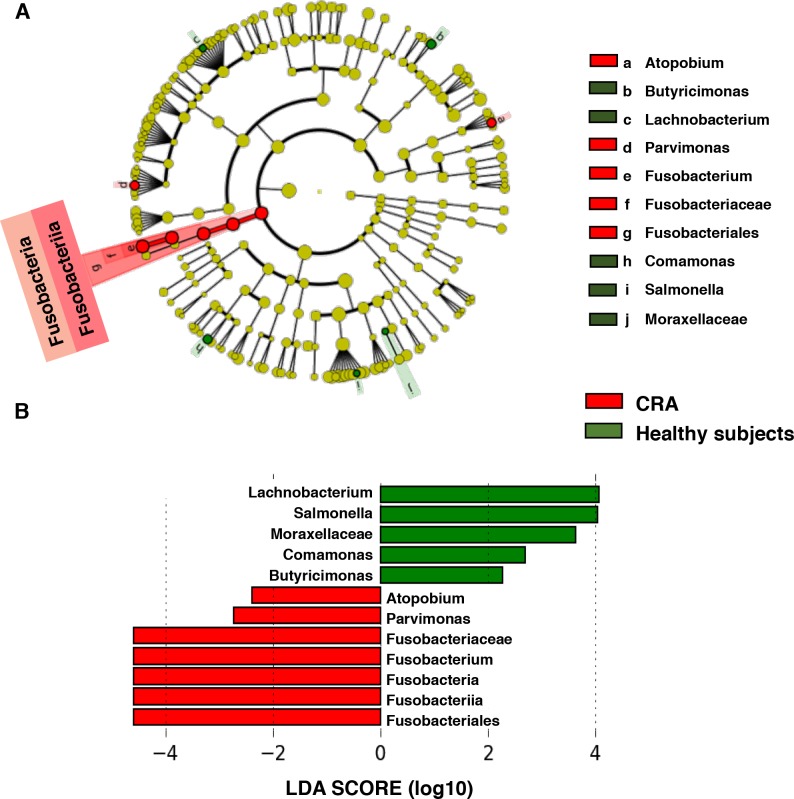
We then performed LEfSe analysis to compare the estimated phylotypes of patients with CRA and healthy microbiotas. The gut microbial communities in patients with CRA were diverse compared to those in healthy subjects. The results indicated differences in the phylogenetic distributions of the microbiotas of patients with CRA and those of healthy subjects at the OTU level (Fig 2A). A histogram of the LDA scores was computed for features that showed differential abundance between healthy subjects and CRA patients. The LDA scores indicated that the relative abundances of Fusobacterium, Parvimonas, and Atopobium were much more enriched in patients with CRA than in healthy subjects (Fig 2B). The most differentially abundant bacterial taxon in patients with CRA was Fusobacterium spp. (LDA score [log 10] > 3), whereas the healthy microbiome was characterized by a preponderance of Lachnobacterium, Salmonella, and Moraxellaceae (LDA score [log10] > 3) (Fig 2B).
Fig 2. Characterization of microbiomes in CRA patients and healthy subjects by LEfSe analysis and LDA.
(A) Taxonomic representation of statistically and biologically consistent differences in CRA and healthy subjects. (B) Histogram of the LDA scores (log10) computed for features with differential abundance in CRA patients and healthy subjects.
Bacteria whose relative abundances differ significantly between patients with CRA and healthy subjects
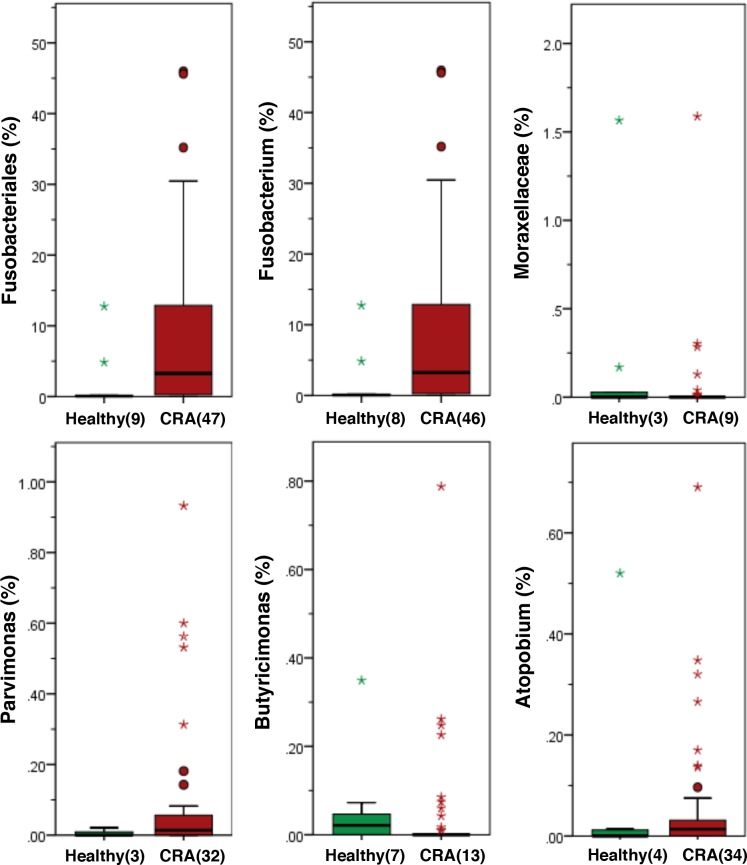
Among the bacteria whose relative abundances differed significantly between patients with CRA and healthy subjects, both Fusobacteriales and Fusobacterium were mainly detected in patients with CRA (Fig 3). The relative abundances of Moraxellaceae, Parvimonas, Butyricimonas, Atopobium, Comamonas, Lachnobacterium, and Salmonella were also significantly different between patients with CRA and healthy subjects (p < 0.001); however, the percentage of these bacteria relative to all bacteria was extremely small (less than 1%). Both Fusobacteriales and Fusobacterium were therefore mainly associated with CRA patients, in contrast to healthy subjects.
Fig 3. Histogram of the gut microbiota relative abundances in CRA patients and healthy subjects.
The relative abundances of the groups of bacteria displayed significant differences between CRA patients and healthy subjects (LDA score [log 10]>3) (p < 0.001). Data are presented as the mean ± SE. Numbers in parentheses indicate the number of subjects positive for a given group of bacteria.
Characterization of the microbiomes of patients with intramucosal CRC and healthy subjects by LEfSe analysis and LDA based on OTUs
LDA scores showed significant bacterial differences between healthy subjects and patients with intramucosal CRC (Fig 4A). The intramucosal CRC microbiome was characterized by a preponderance of Fusobacterium, Actinobacillus, Peptostreptococcus, Parvimonas, and Actinomyces (LDA score [log10] > 3), whereas the healthy microbiome was characterized by a preponderance of Megamonas and Sphingobium (LDA score [log10] > 3) (Fig 4B).
Fig 4. Characterization of microbiomes in intramucosal CRC patients and healthy subjects.
(A) Taxonomic representation of statistically and biologically consistent differences between healthy subjects and intramucosal CRC patients. (B) Histogram of the LDA scores (log10) computed for features differentially abundant in CRC patients and healthy subjects.
Bacteria with relative abundances that significantly differ between patients with intramucosal CRC and healthy subjects
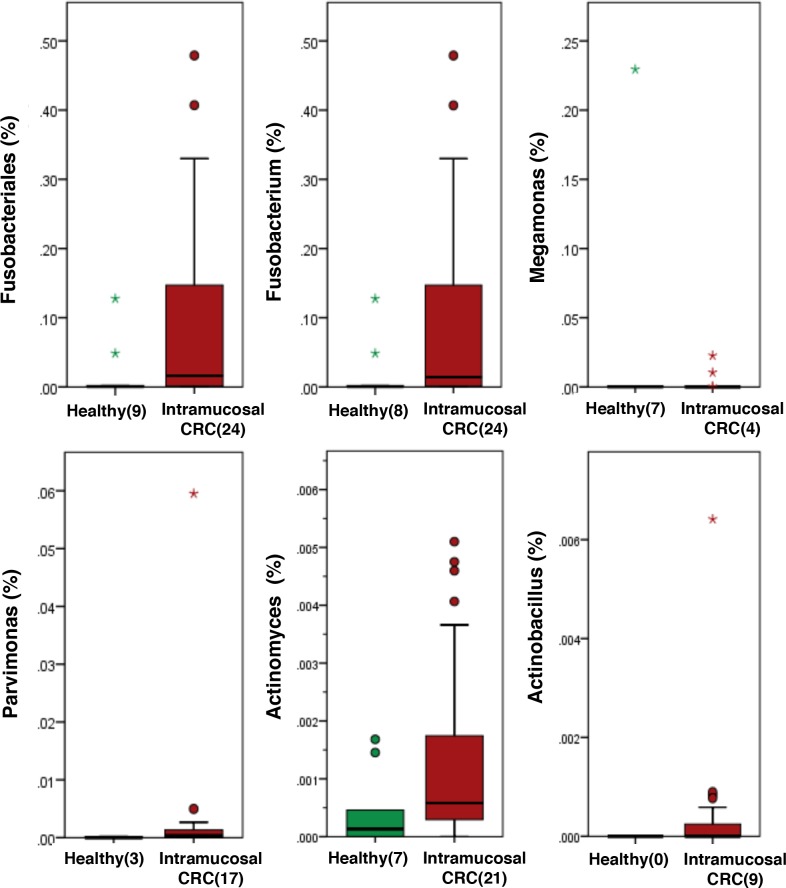
The relative abundances of bacteria significantly differed between patients with intramucosal CRC and healthy subjects (Fig 5). Although the percentages of Megamonas, Peptostreptococcus, Parvimonas, Actinomyces, Actinobacillus, and Sphingobium in colonoscopy aspirates were significantly different between patients with intramucosal CRC and healthy subjects (p < 0.001), these bacteria were present in extremely small populations (less than 1%). The intramucosal CRC microbiome was also mainly characterized by a preponderance of Fusobacteriales and Fusobacterium compared to healthy subjects (p < 0.001) (Fig 5).
Fig 5. Histogram of the gut microbiota relative abundances in intramucosal CRC patients and healthy subjects.
Relative abundances of the groups of bacteria that displayed significant differences between patients with intramucosal CRC and healthy subjects (LDA score [log 10]>3) (p < 0.001). Data are presented as the mean ± SE. Numbers in parentheses indicate the number of subjects positive for a given group of bacteria.
Characterization of Fusobacterium spp. in patients with CRA and healthy subjects
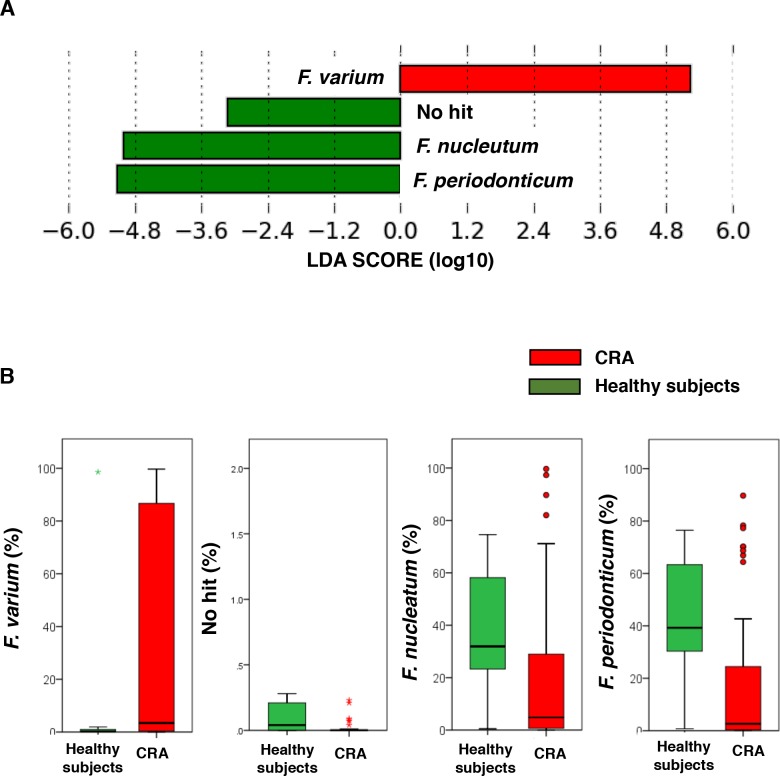
F. nucleatum and F. periodonticum were detected in approximately 60% of healthy subjects, significantly more than in patients with CRA (Fig 6). Strikingly, F. varium, appearing in approximately 80% of CRA patients, could significantly distinguish CRA patients from healthy subjects (Fig 6A and 6B).
Fig 6. Characterization of Fusobacterium spp. in CRA patients and healthy subjects.
(A) Histogram of the LDA scores (log10) computed for Fusobacterium spp. features that were differentially abundant in CRA and healthy subjects. (B) Relative abundances of the groups of Fusobacterium spp. that displayed significant differences between CRA and healthy subjects (LDA score [log 10]>3) (p < 0.001). Data are presented as the mean ± SE. No hit (%) indicates that there was no information on the components in the database.
Characterization of Fusobacterium spp. in patients with intramucosal CRC and healthy subjects
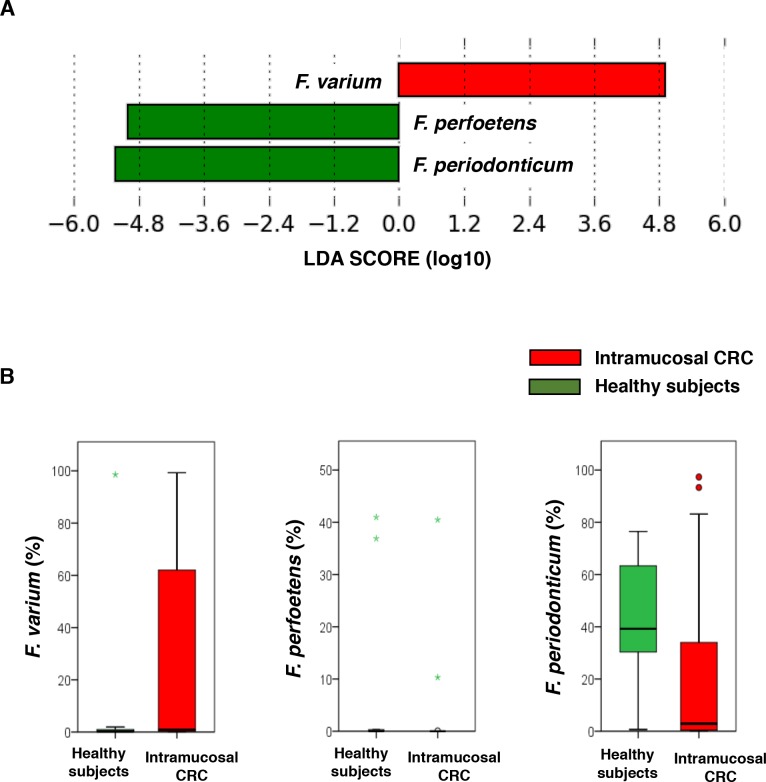
LEfSe analysis showed that F. varium was significantly more abundant in intramucosal CRC patients than in healthy subjects (Fig 7A and 7B). Moreover, approximately 60% of intramucosal CRC patients were F. varium-positive, whereas F. perfoetens and F. periodonticum were significantly detected in healthy subjects.
Fig 7. Characterization of Fusobacterium spp. in intramucosal CRC patients and healthy subjects.
(A) Histogram of the LDA scores (log10) computed for Fusobacterium spp. Features that were differentially abundant in intramucosal CRC and healthy subjects. (B) Relative abundances of the groups of Fusobacterium spp. displaying significant differences between intramucosal CRC and healthy subjects. (LDA score [log 10]>3) (p < 0.001). Data are presented as the mean ± SE.
Characterization of microbiomes in patients with CRA and intramucosal CRC by LEfSe analysis and LDA based on OTUs
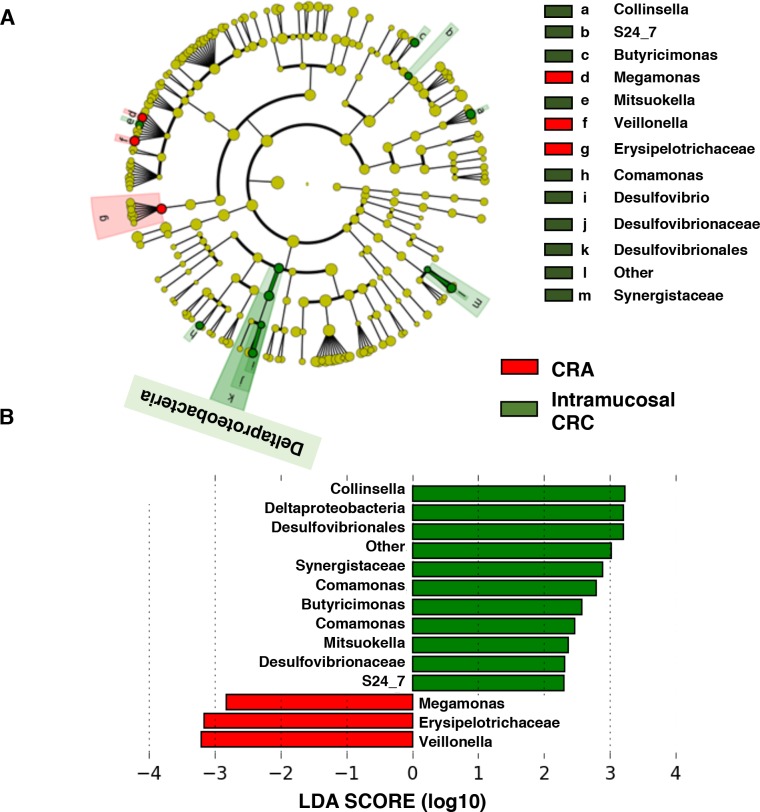
Next, to compare the characteristic microbiomes in patients with CRA and intramucosal CRC, we performed LEfSe analysis. The LDA scores showed significant bacterial differences between patients with CRA and intramucosal CRC (Fig 8A). The intramucosal CRC microbiome was characterized by a preponderance of Collinsella, Deltaproteobacteria, and Desulfovibrionales (LDA score [log10] > 3), whereas the CRA microbiome was characterized by a preponderance of Erysipelotrichaceae and Veillonella (LDA score [log10] > 3) (Fig 8B). The LDA scores of both Fusobacteriales and Fusobacterium were not different between CRA and intramucosal CRC.
Fig 8. Characterization of microbiomes in patients with CRA and intramucosal CRC by LEfSe analysis and LDA.
(A) Taxonomic representation of statistically and biologically consistent differences in patients with CRA and intramucosal CRC. (B) Histogram of the LDA scores (log10) computed for features that were differentially abundant in patients with CRA and intramucosal CRC.
Bacteria whose relative abundances differ significantly between patients with CRA and intramucosal CRC
The relative abundances of Collinsella, Deltaproteobacteria, Desulfovibrionales, Synergistaceae; Other, Erysipelotrichaceae, and Veillonella were significantly different between patients with CRA and intramucosal CRC (p < 0.001); however, the percentage of these bacteria relative to all bacteria was extremely small (less than 1%) (Fig 9).
Fig 9. Histogram of the gut microbiota relative abundances in patients with CRA and intramucosal CRC.
Relative abundances of the groups of bacteria that displayed significant differences between CRA patients and healthy subjects (LDA score [log 10]>3) (p < 0.001). Data are presented as the mean ± SE. Numbers in parentheses indicate the number of subjects positive for a given group of bacteria.
Discussion
The present study has demonstrated for the first time that F. varium may be associated with the development of CRA as well as intramucosal CRC, as analyzed by a metagenomic approach using next-generation sequencing (NGS).
Previous studies have found the enrichment of F. nucleatum to be associated with advanced CRC from frozen mucosal tissues [4, 5] and fecal samples [25]. In clinical situations, analyses of the gut microbiota have limitations, including small frozen sample sizes and the use of fecal samples and undefined tissue sampling sites. However, colonoscopic technologies are suitable for diagnosing colorectal neoplasia, and colonoscopy aspirates are easily obtained for diagnosis. As it has been reported that colonoscopy aspirates can serve as a substitute for the gut microbiota in tissues [15], we analyzed the gut microbiota in a Japanese population using colonoscopy aspirates. We detected an abundance of Fusobacterium spp. in the colonoscopy aspirates of CRA or intramucosal CRC patients. Moreover, F. varium accounted for approximately 80% of the Fusobacterium spp. from CRA patients and 60% from intramucosal CRC patients. There was no difference in the Fusobacterium spp. between CRA and intramucosal CRC. F. nucleatum accounted for approximately 60% of the Fusobacterium spp. population in healthy controls, which was significantly higher than that in CRA patients. Previous studies have also reported that F. nucleatum can be detected in the stool and colon mucosa of healthy controls as well as CRC patients [26]. F. varium may show specificity for CRA and intramucosal CRC compared to healthy subjects. High copy numbers of F. nucleatum in advanced CRC tissues were associated with late stages and worse prognoses in a Japanese population [26]. F. nucleatum may mainly play a role in the progression of advanced CRC. The gut microbiome is characterized by dietary habits (rich in red meat relative to vegetables and fruits), living environments, and metabolic levels in different human races [27]. F. nucleatum was more abundant in patients with advanced CRC from Spain than in those from the United States and Vietnam. Moreover, a recent report demonstrated that the frequency of F. nucleatum positivity in Japanese patients with advanced CRC was much lower than that in similar patients in United States cohort studies [7]. The patient populations may be at least part of the reason why F. varium but not F. nucleatum was found to be enriched in CRA or intramucosal CRC patients compared to healthy subjects. Our current data, which indicate greater abundance of F. varium in patients with CRA and intramucosal CRC than in healthy subjects in a Japanese population, suggest that Fusobacterium spp. colonization may vary regionally. However, the relationship between the gut microbiota and human races is still unknown. Moreover, the different sample types analyzed from colonoscopy aspirates in this study should also be associated with the different results. In this study, we did not analyze advanced CRC; therefore, the association of F. varium with advanced CRC may also be possible. Future studies are needed to analyze the gut microbiota from colonoscopic aspirates in adenoma, intramucosal CRC, and advanced CRC in the same sets of experiments.
F. varium can invade colonic epithelial cells, activating early intracellular signaling systems to trigger host inflammatory reactions [11]. Adhering to the colonic mucosa is essential for the gut microbiota to deliver specific oncogenic molecules into the colonic epithelial cells, which results in inflammation and oncogenic signaling in the colonic epithelial cells [28]. We recently reported the complete genome sequence of F. varium Fv113-g1, which had been isolated from a patient with UC. Fv113-g1 possessed many accessary pangenome sequences with noteworthy multiple virulence factors, including FadA, in contrast to F. nucleatum [9]. Kasper’s group also reported that F. varium suppresses Reg3 to avoid death induced by antimicrobial peptides (AMPs), promoting intestinal barrier breaks [29]. These results suggest that F. varium is pathogenic in human colorectal tumors. However, the association of F. varium with neoplasm proliferation is unknown. In this study, we analyzed not tissue samples but colonoscopic aspirates. Future studies of interactions between F. varium and neoplasm proliferation are needed to assess the possible association of F. varium with the initiation and/or progression of colorectal carcinogenesis. Outgrowth of Fusobacterium spp. such as F. varium and F. nucleatum following dysbiosis may be a more important cause of colorectal carcinogenesis. The human gut microbiota may contribute to the etiology of CRC, not only via the procarcinogenic activities of specific pathogens such as Fusobacterium spp. but also via the influence of the wider microbe-induced networks for metabolic pathway aberrations [1]. Mechanisms causing Fusobacterium abundance and oncogenic properties in other gastrointestinal tract tumors and pancreatobiliary tumors remain unknown.
The complex interactions of hosts and their gut microbiotas also contribute to the pathogenesis of CRC. In human host environments, F. nucleatum modulates tumor-associated inflammation, such as that involving regulatory T cells (Tregs), in the tumor microenvironment with consequences for the inhibition or promotion of CRC biology [24]. Moreover, F. nucleatum expands myeloid-derived immune cells, which inhibit T cell proliferation and induce T cell apoptosis in patients with CRC, resulting in immunosuppression [7]. Not only F. nucleatum but also F. varium may influence inflammation of the colorectum. A recent report indicated that F. varium decreased both CD4+ and CD8+ populations more strongly and caused a higher frequency of colonic CD4-CD8-T cells than any other microbe [30]. The mechanisms of interactions between hosts and F. varium and F. nucleatum should be further investigated.
As enhanced abundances of Fusobacterium spp. such as F. varium and F. nucleatum may also be associated with some patients with CRC, Fusobacterium spp. detection in colonoscopy aspirates may be sufficient for identifying patients with increased risks for CRA or CRC [4, 5]. Moreover, high levels of serum anti-Fusobacterium spp. antibodies are also a potential biomarker for CRC diagnosis [31]. Targeting Fusobacterium spp. with antimicrobial interventions may be a potential treatment or method of prevention for patients with Fusobacterium-associated CRC. Treatment of a mouse model bearing colon cancer with the antibiotic metronidazole certainly reduced Fusobacterium amounts, the proliferating activity of cancer cells, and overall tumor growth [32]. Further investigation of antimicrobial interventions as a potential treatment for patients with Fusobacterium-associated CRC is also interesting.
Supporting information
Open arrows indicate the position of a designed primer set. The attached and underlined regions of the primers indicate the binding site for the barcode primer for the 2nd PCR. The numbers at the top of the sequences indicate the bases according to the nucleotide sequence of the ITS region in Fusobacterium nucleatum subsp. nucleatum ATCC255836T. A dot indicates a conserved sequence.
(TIF)
The bold line indicates the average Shannon diversity index in each group.
(TIF)
(DOCX)
(DOCX)
Data Availability
All relevant data are within the manuscript and its Supporting Information files.
Funding Statement
Employees of Morinaga Milk Industry Co., LTD., Toshitaka Odamaki, Kumiko Kato, and, Jin-zhong Xiao were received salary from the company. The specific roles of these authors are articulated in the ‘author contributions’ section. Our work was funded by the Smoking Research Foundation (special study, no. 6). The funders did not have any additional role in the study design, data collection and analysis, decision to publish, or preparation of the manuscript.
References
- 1.Louis P, Hold GL, Flint HJ. The gut microbiota, bacterial metabolites and colorectal cancer. Nature reviews Microbiology. 2014;12(10):661–72. Epub 2014/09/10. 10.1038/nrmicro3344 . [DOI] [PubMed] [Google Scholar]
- 2.Keku TO, Dulal S, Deveaux A, Jovov B, Han X. The gastrointestinal microbiota and colorectal cancer. American journal of physiology Gastrointestinal and liver physiology. 2015;308(5):G351–63. Epub 2014/12/30. 10.1152/ajpgi.00360.2012 [DOI] [PMC free article] [PubMed] [Google Scholar]
- 3.Arthur JC, Perez-Chanona E, Muhlbauer M, Tomkovich S, Uronis JM, Fan TJ, et al. Intestinal inflammation targets cancer-inducing activity of the microbiota. Science (New York, NY). 2012;338(6103):120–3. Epub 2012/08/21. 10.1126/science.1224820 [DOI] [PMC free article] [PubMed] [Google Scholar]
- 4.Castellarin M, Warren RL, Freeman JD, Dreolini L, Krzywinski M, Strauss J, et al. Fusobacterium nucleatum infection is prevalent in human colorectal carcinoma. Genome research. 2012;22(2):299–306. Epub 2011/10/20. 10.1101/gr.126516.111 [DOI] [PMC free article] [PubMed] [Google Scholar]
- 5.Kostic AD, Gevers D, Pedamallu CS, Michaud M, Duke F, Earl AM, et al. Genomic analysis identifies association of Fusobacterium with colorectal carcinoma. Genome research. 2012;22(2):292–8. Epub 2011/10/20. 10.1101/gr.126573.111 [DOI] [PMC free article] [PubMed] [Google Scholar]
- 6.Yang Y, Weng W, Peng J, Hong L, Yang L, Toiyama Y, et al. Fusobacterium nucleatum increases proliferation of colorectal cancer cells and tumor development in mice by activating Toll-like receptor 4 signaling to nuclear factor-kappaB, and up-regulating expression of microRNA-21. Gastroenterology. 2017;152(4):851–66.e24. Epub 2016/11/24. 10.1053/j.gastro.2016.11.018 . [DOI] [PMC free article] [PubMed] [Google Scholar]
- 7.Mima K, Sukawa Y, Nishihara R, Qian ZR, Yamauchi M, Inamura K, et al. Fusobacterium nucleatum and T cells in colorectal carcinoma. JAMA oncology. 2015;1(5):653–61. Epub 2015/07/17. 10.1001/jamaoncol.2015.1377 [DOI] [PMC free article] [PubMed] [Google Scholar]
- 8.Sears CL, Garrett WS. Microbes, microbiota, and colon cancer. Cell host & microbe. 2014;15(3):317–28. Epub 2014/03/19. 10.1016/j.chom.2014.02.007 [DOI] [PMC free article] [PubMed] [Google Scholar]
- 9.Sekizuka T, Ogasawara Y, Ohkusa T, Kuroda M. Characterization of Fusobacterium varium Fv113-g1 isolated from a patient with ulcerative colitis based on complete genome sequence and transcriptome analysis. PloS one. 2017;12(12):e0189319 Epub 2017/12/08. 10.1371/journal.pone.0189319 [DOI] [PMC free article] [PubMed] [Google Scholar]
- 10.Allen-Vercoe E, Strauss J, Chadee K. Fusobacterium nucleatum: an emerging gut pathogen? Gut microbes. 2011;2(5):294–8. Epub 2011/11/10. 10.4161/gmic.2.5.18603 . [DOI] [PubMed] [Google Scholar]
- 11.Ohkusa T, Yoshida T, Sato N, Watanabe S, Tajiri H, Okayasu I. Commensal bacteria can enter colonic epithelial cells and induce proinflammatory cytokine secretion: a possible pathogenic mechanism of ulcerative colitis. Journal of medical microbiology. 2009;58(Pt 5):535–45. Epub 2009/04/17. 10.1099/jmm.0.005801-0 [DOI] [PMC free article] [PubMed] [Google Scholar]
- 12.Oh JK, Weiderpass E. Infection and cancer: global distribution and burden of diseases. Annals of global health. 2014;80(5):384–92. Epub 2014/12/17. 10.1016/j.aogh.2014.09.013 . [DOI] [PubMed] [Google Scholar]
- 13.Nakatsu G, Li X, Zhou H, Sheng J, Wong SH, Wu WK, et al. Gut mucosal microbiome across stages of colorectal carcinogenesis. Nature communications. 2015;6:8727 Epub 2015/10/31. 10.1038/ncomms9727 [DOI] [PMC free article] [PubMed] [Google Scholar]
- 14.Rubinstein MR, Wang X, Liu W, Hao Y, Cai G, Han YW. Fusobacterium nucleatum promotes colorectal carcinogenesis by modulating E-cadherin/beta-catenin signaling via its FadA adhesin. Cell host & microbe. 2013;14(2):195–206. Epub 2013/08/21. 10.1016/j.chom.2013.07.012 [DOI] [PMC free article] [PubMed] [Google Scholar]
- 15.Keren N, Naftali T, Kovacs A, Konikoff FM, Gophna U. Can colonoscopy aspirates be a substitute for fecal samples in analyses of the intestinal microbiota? Bioscience of microbiota, food and health. 2012;31(3):71–6. Epub 2012/01/01. 10.12938/bmfh.31.71 [DOI] [PMC free article] [PubMed] [Google Scholar]
- 16.Hari DM, Leung AM, Lee JH, Sim MS, Vuong B, Chiu CG, et al. AJCC Cancer Staging Manual 7th edition criteria for colon cancer: do the complex modifications improve prognostic assessment? Journal of the American College of Surgeons. 2013;217(2):181–90. Epub 2013/06/19. 10.1016/j.jamcollsurg.2013.04.018 [DOI] [PMC free article] [PubMed] [Google Scholar]
- 17.Edge SB, Byrd SR, Compton CC, Fritz AG, Greene FL, Trottl I, A. AJCC cancer staging manual. 7th edition Springer-Verlag; New York (NY) 2010:143–64. [Google Scholar]
- 18.Kim SW, Suda W, Kim S, Oshima K, Fukuda S, Ohno H, et al. Robustness of gut microbiota of healthy adults in response to probiotic intervention revealed by high-throughput pyrosequencing. DNA research: an international journal for rapid publication of reports on genes and genomes. 2013;20(3):241–53. Epub 2013/04/11. 10.1093/dnares/dst006 [DOI] [PMC free article] [PubMed] [Google Scholar]
- 19.Odamaki T, Bottacini F, Kato K, Mitsuyama E, Yoshida K, Horigome A, et al. Genomic diversity and distribution of Bifidobacterium longum subsp. longum across the human lifespan. Scientific reports. 2018;8(1):85 Epub 2018/01/10. 10.1038/s41598-017-18391-x . [DOI] [PMC free article] [PubMed] [Google Scholar]
- 20.Kuczynski J, Stombaugh J, Walters WA, Gonzalez A, Caporaso JG, Knight R. Using QIIME to analyze 16S rRNA gene sequences from microbial communities. Current protocols in microbiology. 2012;Chapter 1:Unit 1E.5. Epub 2012/11/28. 10.1002/9780471729259.mc01e05s27 [DOI] [PMC free article] [PubMed] [Google Scholar]
- 21.Caporaso JG, Kuczynski J, Stombaugh J, Bittinger K, Bushman FD, Costello EK, et al. QIIME allows analysis of high-throughput community sequencing data. Nature methods. 2010;7(5):335–6. Epub 2010/04/13. 10.1038/nmeth.f.303 [DOI] [PMC free article] [PubMed] [Google Scholar]
- 22.Barberan A, Dunn RR, Reich BJ, Pacifici K, Laber EB, Menninger HL, et al. The ecology of microscopic life in household dust. Proceedings Biological sciences. 2015;282(1814). Epub 2015/08/28. 10.1098/rspb.2015.1139 [DOI] [PMC free article] [PubMed] [Google Scholar]
- 23.Segata N, Izard J, Waldron L, Gevers D, Miropolsky L, Garrett WS, et al. Metagenomic biomarker discovery and explanation. Genome biology. 2011;12(6):R60 Epub 2011/06/28. 10.1186/gb-2011-12-6-r60 [DOI] [PMC free article] [PubMed] [Google Scholar]
- 24.de la Cuesta-Zuluaga J, Mueller NT, Corrales-Agudelo V, Velasquez-Mejia EP, Carmona JA, Abad JM, et al. Metformin Is associated with higher relative abundance of mucin-degrading akkermansia muciniphila and several short-chain fatty acid-producing microbiota in the gut. Diabetes care. 2017;40(1):54–62. Epub 2016/12/22. 10.2337/dc16-1324 . [DOI] [PubMed] [Google Scholar]
- 25.Ahn J, Sinha R, Pei Z, Dominianni C, Wu J, Shi J, et al. Human gut microbiome and risk for colorectal cancer. Journal of the National Cancer Institute. 2013;105(24):1907–11. Epub 2013/12/10. 10.1093/jnci/djt300 [DOI] [PMC free article] [PubMed] [Google Scholar]
- 26.Yamaoka Y, Suehiro Y, Hashimoto S, Hoshida T, Fujimoto M, Watanabe M, et al. Fusobacterium nucleatum as a prognostic marker of colorectal cancer in a Japanese population. Journal of gastroenterology. 2017. Epub 2017/08/22. 10.1007/s00535-017-1382-6 . [DOI] [PubMed] [Google Scholar]
- 27.Chen L, Zhang YH, Huang T, Cai YD. Gene expression profiling gut microbiota in different races of humans. Scientific reports. 2016;6:23075 Epub 2016/03/16. 10.1038/srep23075 [DOI] [PMC free article] [PubMed] [Google Scholar]
- 28.Soler AP, Miller RD, Laughlin KV, Carp NZ, Klurfeld DM, Mullin JM. Increased tight junctional permeability is associated with the development of colon cancer. Carcinogenesis. 1999;20(8):1425–31. Epub 1999/07/30. . [DOI] [PubMed] [Google Scholar]
- 29.Geva-Zatorsky N, Sefik E, Kua L, Pasman L, Tan TG, Ortiz-Lopez A, et al. Mining the human gut microbiota for immunomodulatory organisms. Cell. 2017;168(5):928–43.e11. Epub 2017/02/22. 10.1016/j.cell.2017.01.022 . [DOI] [PMC free article] [PubMed] [Google Scholar]
- 30.Saito T, Nishikawa H, Wada H, Nagano Y, Sugiyama D, Atarashi K, et al. Two FOXP3(+)CD4(+) T cell subpopulations distinctly control the prognosis of colorectal cancers. Nature medicine. 2016;22(6):679–84. Epub 2016/04/26. 10.1038/nm.4086 . [DOI] [PubMed] [Google Scholar]
- 31.Wang HF, Li LF, Guo SH, Zeng QY, Ning F, Liu WL, et al. Evaluation of antibody level against Fusobacterium nucleatum in the serological diagnosis of colorectal cancer. Scientific reports. 2016;6:33440 Epub 2016/09/30. 10.1038/srep33440 [DOI] [PMC free article] [PubMed] [Google Scholar]
- 32.Bullman S, Pedamallu CS, Sicinska E, Clancy TE, Zhang X, Cai D, et al. Analysis of Fusobacterium persistence and antibiotic response in colorectal cancer. Science (New York, NY). 2017;358(6369):1443–8. Epub 2017/11/25. 10.1126/science.aal5240 . [DOI] [PMC free article] [PubMed] [Google Scholar]
Associated Data
This section collects any data citations, data availability statements, or supplementary materials included in this article.
Supplementary Materials
Open arrows indicate the position of a designed primer set. The attached and underlined regions of the primers indicate the binding site for the barcode primer for the 2nd PCR. The numbers at the top of the sequences indicate the bases according to the nucleotide sequence of the ITS region in Fusobacterium nucleatum subsp. nucleatum ATCC255836T. A dot indicates a conserved sequence.
(TIF)
The bold line indicates the average Shannon diversity index in each group.
(TIF)
(DOCX)
(DOCX)
Data Availability Statement
All relevant data are within the manuscript and its Supporting Information files.


