

Abstract
Residential energy efficiency and ventilation retrofits (e.g., building weatherization, local exhaust ventilation, HVAC filtration) can influence indoor air quality (IAQ) and occupant health, but these measures’ impact varies by occupant activity. In this study, we used the multi-zone airflow and IAQ analysis program CONTAM to simulate the impacts of energy retrofits on indoor concentrations of PM2.5 and NO2 in a low-income multifamily housing complex in Boston, Massachusetts (USA). We evaluated the differential impact of residential activities, such as low- and high-emission cooking, cigarette smoking, and window-opening, on IAQ across two seasons. We found that a comprehensive package of energy and ventilation retrofits was resilient to a range of occupant activities, while less holistic approaches without ventilation improvements led to increases in indoor PM2.5 or NO2 for some populations. In general, homes with simulated concentration increases included those with heavy cooking and no local exhaust ventilation, and smoking homes without HVAC filtration. Our analytical framework can be used to identify energy efficient home interventions with indoor retrofit resiliency (i.e., those that provide IAQ benefits regardless of occupant activity), as well as less resilient retrofits that can be coupled with behavioral interventions (e.g., smoking cessation) to provide cost-effective, widespread benefits.
Keywords: Indoor air quality, energy efficient retrofits, building simulation, multifamily housing, indoor retrofit resiliency, CONTAM, healthy housing
Introduction
In response to the economic and social impacts of energy consumption, a variety of residential energy retrofitting programs have been implemented in the United States1 and elsewhere. In particular, weatherization retrofits aim to reduce heating and cooling demands by minimizing air leakage across the building envelope. While this can yield economic benefits and contribute to reductions in carbon dioxide emissions, it has been well established that reduced air exchange rates in the absence of other measures can lead to increased concentrations of indoor-sourced pollutants, such as fine particulate matter (PM2.5)2 and nitrogen dioxide (NO2),3 with corresponding effects on a range of health outcomes, including asthma.4
These unintended consequences are especially salient in low-income, multifamily housing. In these populations, rates of smoking5 and gas-stove cooking6 tend to be higher, which can influence indoor concentrations of PM2.5 and NO2, respectively. Furthermore, low-income residents tend to live in smaller apartments within multifamily residences, potentially increasing the influence of indoor sources within their apartments due to smaller volumes or from neighboring apartments due to shared walls and compartments (e.g. hallways).7 Low-income urban populations also have higher baseline rates of respiratory illnesses, such as asthma, exacerbated by indoor combustion pollutants.8
Improvements in ventilation and filtration have been recommended to mitigate the negative weatherization-related consequences for indoor air quality (IAQ) and health9 (i.e., disbenefits), and several field investigations have demonstrated that retrofit programs that incorporate these measures can lead to net improvements in IAQ.9–14 However, the reported magnitude of benefits/disbenefits varies across studies, as well as between specific subpopulations. For example, following a green energy retrofit of a low-income senior housing complex in Arizona, Frey et al. (2015) observed statistically significant decreases in PM2.5 only in apartments that reported smoking, but it was unclear whether this improvement was due to post-retrofit changes in smoking behavior or to the upgraded ventilation systems and exhaust fans.12 Other studies have specifically attributed IAQ-related impacts to post-retrofit occupant activities rather than retrofit design. Colton et al. (2014) reported 57% and 65% lower concentrations of PM2.5 and NO2, respectively, in “green” retrofitted multifamily public housing compared to control homes in Boston, MA.10 This was hypothesized to be primarily due to the post-retrofit implementation of no-smoking policies and the replacement of gas stoves with electric stoves, respectively, but without formal quantification of the effects of these measures over others.10 Meanwhile, Coombs et al. (2016) reported significantly lower levels of indoor black carbon (from outdoor sources) and increases in some indoor pollutants following a “green” renovation of a low-income multifamily housing complex in Cincinnati, OH, but concluded that these benefits were likely due to post-retrofit reductions in window-opening activity.11
While the existing evidence of IAQ-related benefits from energy retrofits in field studies is valuable, it is highly population- and site-specific, and it is challenging to disentangle contributing factors or observe differences between population groups due to limited sample sizes. Meanwhile, building simulation models can address the uncertainties associated with variable pollutant sources and occupant activity as well as account for the unique airflows in multifamily buildings. While the body of literature reporting model-based IAQ effects of energy efficient renovations is limited, most studies have found that weatherization measures alone can lead to increased indoor pollutant concentrations, while weatherization coupled with improved ventilation and/or filtration can mitigate these adverse impacts.2, 15, 16 However, similar to field study results, the magnitude and direction of impacts vary by study-specific model parameters, such as occupant activity, pollutant sources, climate, and season. Together, field- and model-based results emphasize the fact that the environmental health impacts of energy retrofits likely vary across residential populations; therefore, the development of a framework for examining how residential activities modify the IAQ-related benefits of energy retrofits is of considerable interest.
In the context of the built environment, resiliency has been used to characterize the performance of buildings (i.e., their ability to remain structurally intact and provide basic services) in diverse outdoor conditions, such as during severe rain or snowstorms, heat waves, wildfires, earthquakes, and other extreme events. The maintenance of acceptable IAQ has recently been acknowledged by the National Institute of Standards and Technology (NIST) as an important component of built environment resiliency.17 Additionally, resiliency is a useful concept because it emphasizes that building performance is dependent on both structural design and occupant utilization.18 For this study, we define indoor retrofit resiliency as the ability of a home intervention to withstand both external environmental factors and the influence of internal stressors (i.e., occupant activity) that could reduce the performance of the intervention. Therefore, an energy retrofit that is resilient to occupant activity is one that provides IAQ benefits regardless of expected and unexpected indoor occupant activity.
In the current study, we used a multi-zone airflow and contaminant transport analysis program to simulate the environmental conditions and IAQ before and after an energy retrofit in a low-income multifamily housing complex. Using changes in indoor pollutant concentrations as a metric of indoor retrofit resiliency, we also examined the variable impact of residential activities, such as low- and high-emission cooking, cigarette smoking, and window-opening, on the performance of energy-retrofitted homes across heating and cooling seasons.
Methods
Site: Multifamily Complex in Boston, MA
We built a model of a low-rise, stacked townhouse apartment building located within a multifamily complex in the South End of Boston, MA with approximately 500 units that are subsidized for low-income families. From 2009 to 2011, the entire campus underwent a deep energy retrofit as part of a comprehensive rehabilitation that targeted 48% in energy savings for the 4-story low-rise buildings containing 308 units, funded by tax exempt bonds, 4% Low Income Housing Tax Credits, and a HUD American Recovery and Reinvestment Act (ARRA) grant. Retrofits included air sealing, window and door replacements, appliance upgrades, higher efficiency HVAC filtration, and the installation of bathroom and kitchen exhaust fans. See Table S1 for renovation details.
Building Model
We used CONTAM 3.1.0.3 (NIST, Gaithersburg, MD, USA) to simulate the environmental conditions of a typical low-rise apartment before and after energy retrofits at the modeled site in Boston, MA. CONTAM is a well-validated, multi-zone mass transport analysis program that provides a framework for the construction of building models and estimation of pollutant concentrations and airflows.19 The CONTAM base template used in this study was previously developed using architectural and mechanical specifications of a typical low-rise building at the modeled site containing 8 units (Figure S1). A summary of the application of building elements (e.g. windows, doors) and associated leakage values based on ASHRAE values and previous modeling studies has been published in detail.20 The results of the current study are based on simulations of Unit A, a lower level corner unit (located on levels 1 and 2) with a living room, kitchen, and mechanical room on the first level and three bedrooms and a bathroom on the second level. The total volume of Unit A is 221.5 m3. In the winter, the building was supplied with outdoor air via the mechanical forced-air heating system ducts as well as window opening and infiltration. In the summer, fresh air depended on window opening and infiltration. In both seasons, we modeled manually operated exhaust fans in the kitchen and bathroom in the post-retrofit condition. Details of these natural and mechanical ventilation parameters and schedules are contained in the supplement (Table S2).
Contaminant Parameterization
We modeled the combustion by-products NO2 and PM2.5, given previous literature on their association with asthma exacerbations.21–25 Pollutant sources were based on information obtained from interviewing the building management company, and included gas stove cooking and infiltration. Smoking in the living room served as an additional source of PM2.5. Pollutant emission rates were parameterized using published literature values (Table S3). Time activity schedules were derived from occupant survey data, which were collected from 82 residents in the winter and spring of 2013. The survey included questions on occupant demographics, cooking activity, window-opening behavior, pest presence, and perceptions of comfort before and after the retrofit. Season-specific 24-h indoor temperature schedules were applied to account for diurnal and seasonal variation. Using field data from a study of 15 units at the building site (unpublished), hourly indoor temperatures were averaged across all apartments to create 24-h temperature schedules per season (heating and cooling). Based on these profiles, the 24-h average indoor temperature was 22.1°C in the heating season and 24.1°C in the cooling season. Hourly outdoor meteorology values (e.g. hourly temperature and relative humidity) were obtained from a typical meteorological year (TMY) dataset (Boston Station 14739, 1961–1990: TMY2, National Solar Radiation Data Base, National Renewable Energy Laboratory).26 Seasonal hourly outdoor PM2.5 and NO2 concentrations were obtained from nearby state monitors as described elsewhere.27
Indoor retrofit resiliency parameterization
We simulated the indoor conditions of a typical low-rise building at the modeled site with each unit housing a family of four (two adults and two children) (Figure S1) across 64 combinations of renovation and occupant activities that represent unique indoor retrofit resiliency scenarios. The key dimensions in our factorial design are outlined in Table 1, and include season (heating and cooling), pre- and post-retrofit conditions for multiple interventions, and occupant activities that influence indoor sources and ventilation. We simulated pre-retrofit building conditions as well as combinations of 3 post-retrofit scenarios: 1) building weatherization (building sealing plus door and window replacements), 2) the installation of working exhaust fans in the kitchen and bathroom, and 3) improved HVAC filtration (from MERV 4 to 7) in the heating season only.28 While weatherization alone may be infrequently implemented, this scenario provides a basis of comparison with various retrofit bundles. To model kitchen ventilation we used a CONTAM fan element based on the mechanical specifications of the modeled low-rise building. As part of model evaluation, we ensured the resulting capture efficiencies across each scenario were within reasonable limits of previously measured data.29–31 In CONTAM, the pre- and post-retrofit MERV filter ratings were associated with 10% and 40% removal efficiencies of PM2.5, respectively, based on research from Kowalski et al.28 For comparison, the ASHRAE Standard 52.2–2012 reports a minimum removal efficiency of 20% for particles 1–3 μm in diameter for MERV 8.32 We evaluated the benefits of each intervention in homes with all windows closed or kitchen and bathroom windows open during cooking and showering events, respectively, across a set of pollutant-generating occupant activity scenarios: (1) no smoking and average cooking (1 hour/day), (2) no smoking and heavy cooking (2 hours/day), (3) heavy smoking (24 cigarettes/day) and average cooking, and (4) heavy smoking and heavy cooking. Within each retrofit resiliency scenario, identical occupant activities were modeled across all apartments. Detailed activity schedules and emission rates can be found in Table S3.
Table 1.
Model dimensions for low-rise building factorial design.
| Pre-retrofit and Post-retrofit Conditions |
| 1. Pre-retrofit (baseline) |
| 2. Post-retrofit: weatherization alone |
| 3. Post-retrofit: weatherization + exhaust fans1 |
| 4. Post-retrofit: weatherization + improved HVAC filtration2 |
| 5. Post-retrofit: weatherization + exhaust fans1 + improved HVAC filtration2 |
| Occupant Activity Scenarios I (Pollutant-generating) |
| 1. No smoking + average cooking (1 hour/day)3 |
| 2. No smoking + heavy cooking (2 hours/day)3 |
| 3. Heavy smoking (24 cigarettes/day) + average cooking |
| 4. Heavy smoking + heavy cooking |
| Occupant Activity Scenarios II (Natural Ventilation) |
| 1. All windows closed |
| 2. Kitchen and bathroom windows open1 |
| Seasons: |
| 1. Heating season (January) |
| 2. Cooling season (July) |
Kitchen and bathroom exhaust fans/windows operate during cooking and showering events, respectively.
HVAC filtration only active in heating season.
Average cooking scenario consists of 1 hour of cooking at an average cooking emission rate; Heavy cooking consists of 40 minutes of average cooking and 80 minutes of frying (see Table S3 for cooking and frying emission rates).
Data Analysis
CONTAM output files were converted to text and Microsoft Excel files using SimReadW (NIST, Gaithersburg, MD, USA) and data analysis was performed using SAS® software (Version 9.2; SAS Institute Inc., Cary, NC, USA). Hourly data were averaged to obtain source-specific 24-hour mean contaminant concentrations (i.e., outdoor and cooking PM2.5 and NO2, and smoking PM2.5), temperature, and relative humidity per zone (i.e., room) over 7 days. All 24-hour weekly means were then weighted by zone volumes and summarized to estimate unit averages. Unit-specific air exchange rates were calculated by dividing the sum of airflows calculated by CONTAM across all paths, including windows, doors, and other leakage points, by unit volume.
Results
A total of 280 heating days and 168 cooling days were generated, representing 64 indoor retrofit resiliency scenarios. Figures 1 and 2 present 24-hour average concentrations of total indoor PM2.5 and NO2, respectively, over 7 days predicted by CONTAM simulations of pre- and post-retrofit conditions during heating and cooling seasons across several occupant activity scenarios. Since identical occupant activity was modeled across all units within each scenario, total indoor concentrations represent the cumulative impact of sources within the unit as well as concentrations infiltrating from neighboring apartments and outdoors. These figures highlight the relative impact of pre- and post-retrofit measures on pollutant concentrations for each occupant activity scenario. All pollutant concentrations are also listed in Tables S4 and S5, which specifically identify post-retrofit scenarios with increased pollutant concentrations compared to pre-retrofit conditions.
Figure 1.
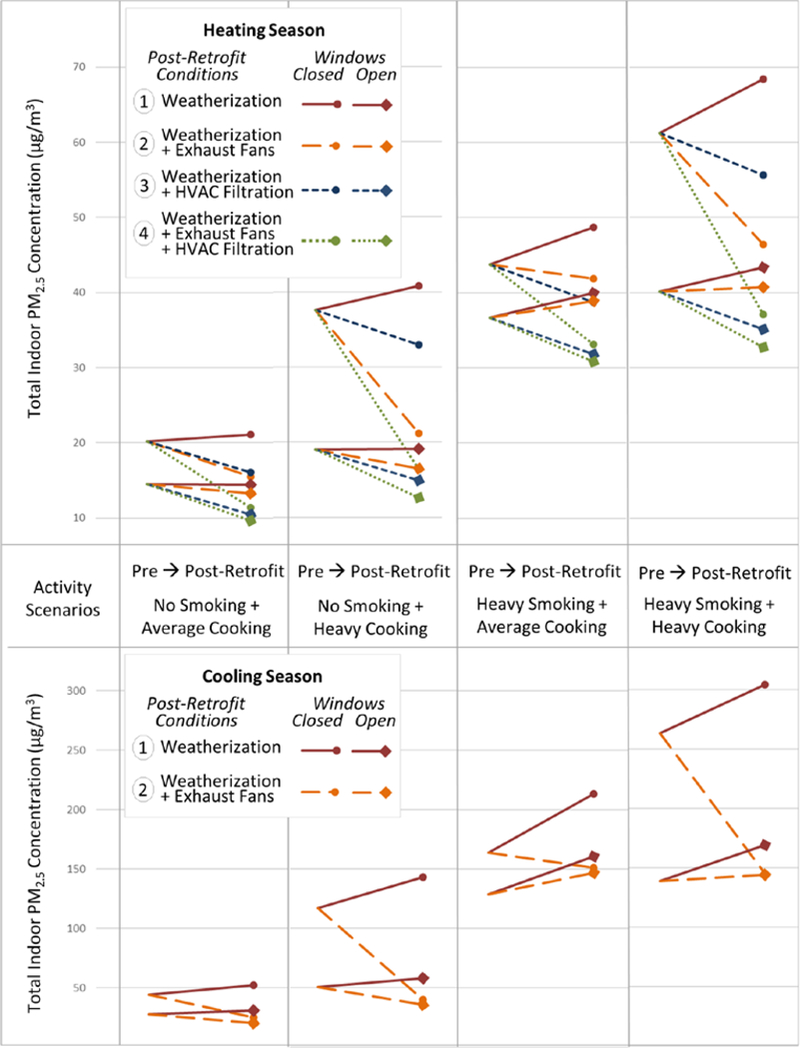
Twenty-four-hour average concentrations of total indoor PM2.5 modeled in Unit A of a low-rise, stacked townhouse apartment building over a week during heating (top panel) and cooling seasons (bottom panel). Each line displays the change in pollutant concentrations from the pre-retrofit (baseline) condition to several post-retrofit conditions by window-opening activity. Post-retrofit conditions include: (1) weatherization only (building sealing, window/door replacements), (2) weatherization plus exhaust fans operating in the kitchen and bathroom during cooking and showering events, respectively, (3) weatherization and higher efficiency HVAC particle filtration (MERV 4 upgraded to MERV 7), and (4) all retrofits (weatherization, exhaust fans, and upgraded HVAC filtration). HVAC filtration was not operational during the cooling season.
Figure 2.
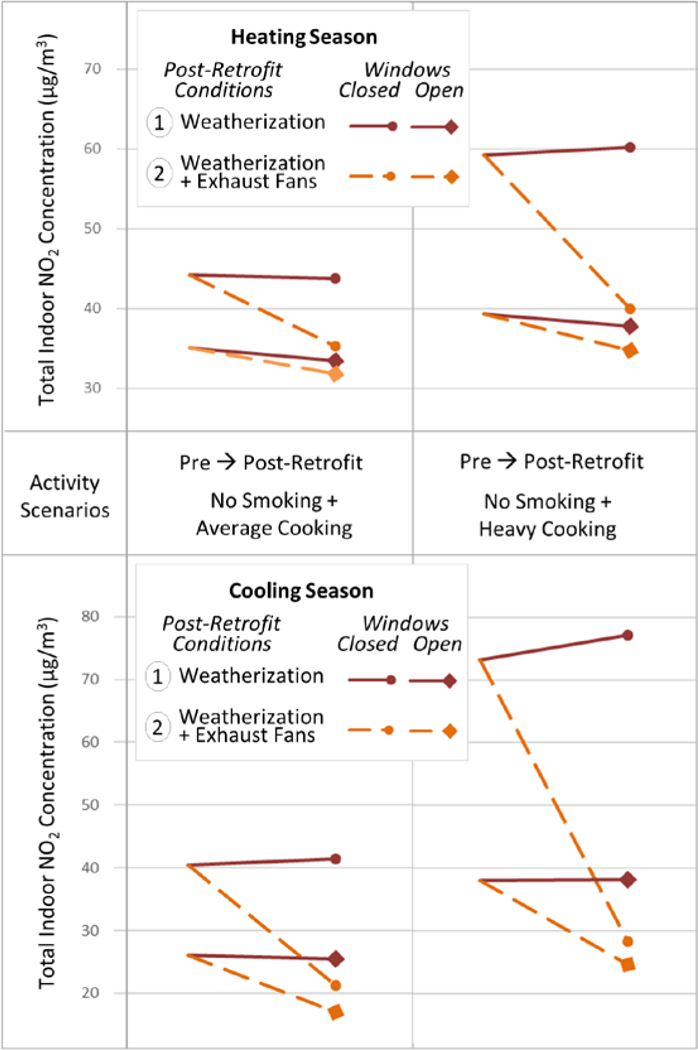
Twenty-four-hour average concentrations of total indoor NO2 modeled in Unit A of a low-rise, stacked townhouse apartment building over a week during heating (top panel) and cooling seasons (bottom panel). Each panel displays the change in pollutant concentrations from the pre-retrofit (baseline) condition to several post-retrofit conditions by window-opening activity. Post-retrofit conditions include: (1) weatherization only (building sealing, window/door replacements), and (2) weatherization plus exhaust fans operating in the kitchen and bathroom during cooking and showering events, respectively.
Across all retrofit and occupant activity scenarios, modeled concentrations of total indoor PM2.5 range from 9.6 μg/m3 to 68.4 μg/m3 in the heating season and 20.4 μg/m3 to 304.5 μg/m3 in the cooling season. Concentrations of total indoor NO2 range from 31.8 μg/m3 to 60.2 μg/m3 in the heating season and 17.0 μg/m3 to 77.2 μg/m3 in the cooling season. The lower concentrations of PM2.5 in the heating season compared to the cooling season are expected due to particle filtration via the mechanical heating system and higher indoor-outdoor temperature differential-driven airflows. Average indoor and outdoor temperatures are 22.1°C and −0.2°C, respectively, during the heating season and 24.1°C and 23.7°C, respectively, in the cooling season. Additionally, 24-hr average concentrations of outdoor PM2.5 from the state monitors are higher in the cooling season (16.6 μg/m3) versus the heating season (13.6 μg/m3). Meanwhile, outdoor NO2 is higher in the heating season (23.0 μg/m3) compared to the cooling season (18.1 μg/m3). In the heating season, mean daily air exchange rates range across scenarios from 0.62 h−1 to 1.43 h−1 (mean = 1.0 h−1) pre-retrofit, and from 0.49 h−1 to 1.18 h−1 (mean = 0.79 h−1) post-retrofit. In the cooling season, mean daily air exchange rates range from 0.16 h−1 to 0.49 h−1 (mean = 0.28 h−1) pre-retrofit, and from 0.13 h−1 to 0.5 h−1 (mean = 0.24 h−1) post-retrofit. These whole building air exchange rates include infiltration airflows calculated by CONTAM as well as mechanically supplied fresh air.
Impact of weatherization only.
Weatherization measures alone lead to increases in total indoor PM2.5 for most occupants, and these weatherization-related disbenefits tend to be greater in scenarios with stronger indoor sources (e.g. heavy cooking and smoking) and less natural ventilation due to closed windows (Figure 1). In contrast, for NO2, disbenefits are observed in fewer renovation and occupant activity scenarios, primarily when windows are closed (Figure 2). These patterns can be interpreted by comparing source-specific contributions in the pre-retrofit scenarios (Figures 3a and 4a) and post-weatherization scenarios (Figures 3b and 4b). For example, weatherization increases the contribution of smoking and cooking to indoor PM2.5 concentrations (Figure 3a vs. 3b and 4a vs. 4b), which more than offsets the benefits of reduced outdoor PM2.5 infiltration in most scenarios (Figure 1). The only scenario where no disbenefits are observed is in non-smoking households with average cooking and open windows in the heating season (Figure 1), where indoor source contributions are modest relative to outdoor concentrations (Figure 3b). For NO2, weatherization similarly increases the contribution of cooking to indoor concentrations (Figure 3a vs. 3b and 4a vs. 4b); however, this increase is offset by the reduced contribution by outdoor NO2 in most heating season scenarios (except those with heavy cooking and closed windows) but only one cooling season scenario with average cooking and open windows (Figure 2). In other scenarios, weatherization leads to an increase in total indoor NO2; however, the only substantial increase is observed during heavy cooking with closed windows in the cooling season (Figure 2).
Figure 3.
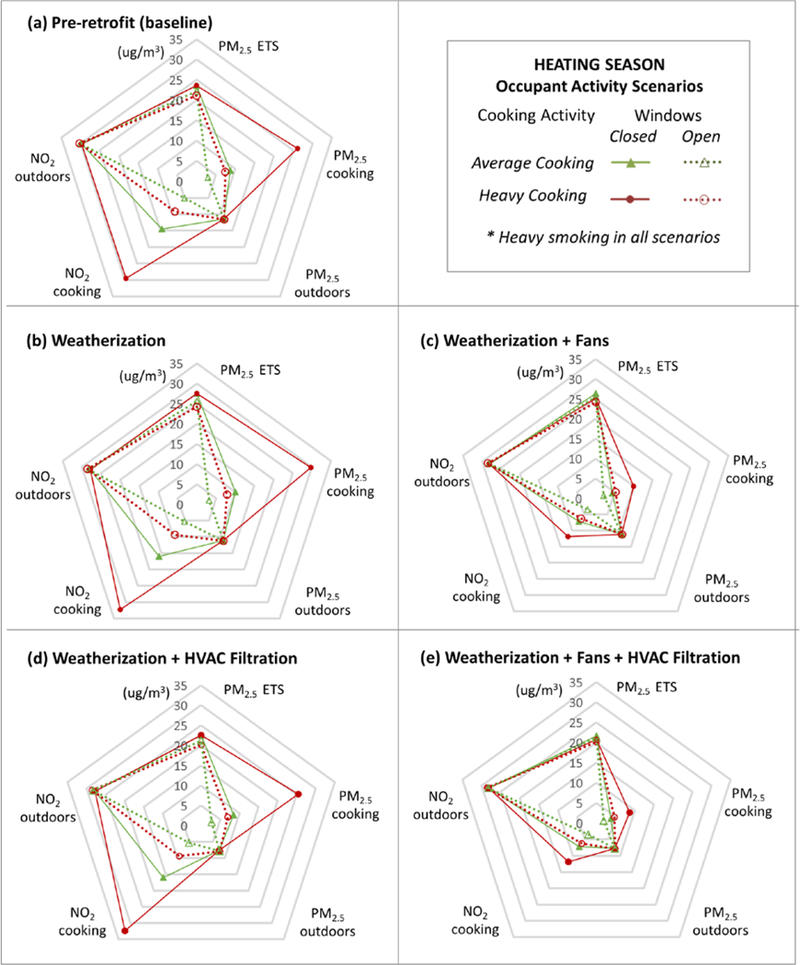
Source-specific 24-hr average concentrations of PM2.5 and NO2 from outdoor air infiltration, cooking activities, and cigarette smoking simulated in Unit A of the low-rise, stacked townhouse apartment building in the heating season under several occupant activity scenarios and retrofit conditions, including a) pre-retrofit (i.e., no retrofits), b) post-retrofit weatherization only, c) post-retrofit weatherization plus exhaust fan utilization, d) post-retrofit weatherization plus improved HVAC particle filtration (MERV 4 upgraded to MERV 7), and e) post-retrofit weatherization, exhaust fan utilization, and improved HVAC filtration.
Figure 4.
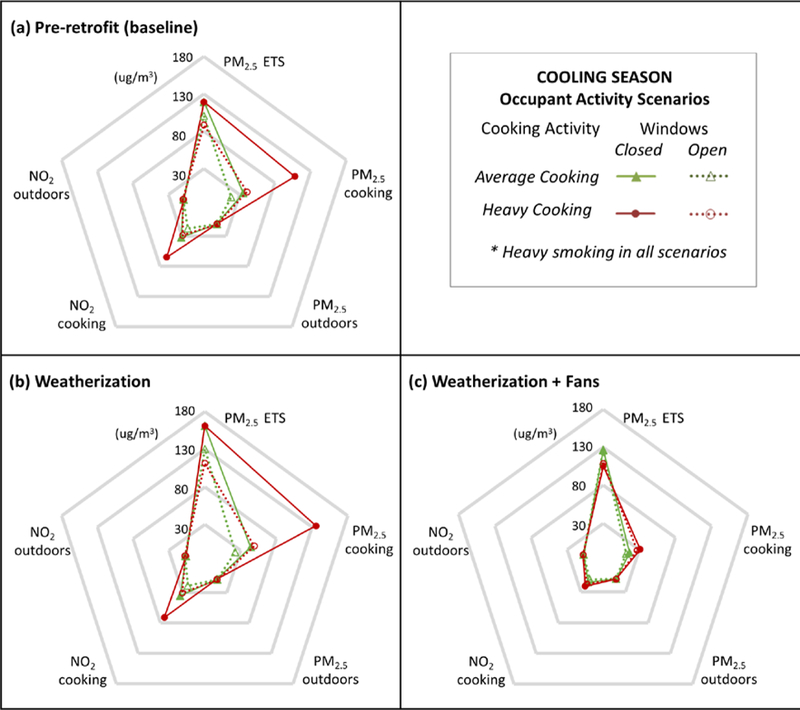
Source-specific 24-hr average concentrations of PM2.5 and NO2 from outdoor air infiltration, cooking activities, and cigarette smoking simulated in Unit A of the modeled low-rise, stacked townhouse apartment building in the cooling season under several occupant activity scenarios and retrofit conditions, including a) pre-retrofit (i.e., no retrofits), b) post-retrofit weatherization only, and c) post-retrofit weatherization plus exhaust fan utilization.
Impacts of weatherization and exhaust fan usage.
When exhaust fans are operated post weatherization, there are substantial reductions in total PM2.5 and NO2 concentrations relative to the weatherization-alone scenario, and there are net decreases in concentrations relative to baseline for most (but not all) scenarios (Figures 1 and 2). When windows are closed, these benefits are driven by the substantial exhaust of cooking-sourced concentrations, which offsets the minor increase in outdoor-sourced concentrations for both pollutants in the heating and cooling seasons (Figure 3a vs 3c and 4a vs. 4c). As a result, exhaust fan utilization with closed windows leads to substantial total PM2.5- and NO2-related benefits among scenarios with heavy cooking, but more modest benefits for scenarios with average cooking in both seasons (Figures 1 and 2).
Exhaust fans have a limited effect on PM2.5 from smoking compared to cooking in both seasons; consequently, smoking-sourced PM2.5 concentrations are higher in most post-retrofit scenarios compared to baseline (Figures 3a vs 3c and 4a vs. 4c), except in one scenario with longer duration fan activity (due to heavy cooking) with closed windows in the cooling season (Figure 4a vs. 4c). In other closed window scenarios, these disbenefits are offset by the substantial reduction of cooking-sourced PM2.5 by exhaust fans; however, since fan utilization has less of an effect on cooking PM2.5 when windows are open (Figures 3c and 4c), total indoor PM2.5 concentrations remain higher than baseline when windows are open in the heating and cooling seasons when smoking is present (Figure 1). For NO2, given that cooking is the only modeled indoor source, the addition of exhaust fans decreases concentrations relative to baseline for all scenarios, with more substantial magnitude decreases when windows are closed (Figure 2).
Impacts of weatherization and HVAC particle filtration.
The addition of higher efficiency HVAC particle filtration (from MERV 4 to MERV 7) to building weatherization leads to reductions in total indoor PM2.5 in the heating season when the system is active, and these reductions are comparable in magnitude across all occupant activity scenarios (Figure 1). This is due to the fact that HVAC particle filtration has a similarly moderate effect on PM2.5 from all sources (Figure 3d), whereas local exhaust ventilation (e.g. kitchen exhaust fan) provides more significant reductions for cooking-sourced PM2.5 (Figure 3c). Since smoking occurred in the living room, PM2.5 from smoking was more responsive to improved whole-building HVAC filtration rather than local exhaust ventilation (Figure 3d vs. 3c). Improved HVAC filtration had no effect on NO2 concentrations (results not shown) due to the fact that MERV filters are designed to removal particle pollutants, not gases.
The relative benefits of improved HVAC filtration compared to exhaust fans varies by window-opening and PM2.5 source activity patterns. For example, in scenarios with closed windows, fans offer greater total benefits compared to improved HVAC filtration except in scenarios with heavy smokers and average cooking, where the whole-house benefits of HVAC filtration dominate. In scenarios with open windows, improved HVAC filtration leads to slightly greater benefits compared to exhaust fans across all occupant activity scenarios.
As expected, weatherization accompanied by both exhaust fans and improved HVAC filtration leads to the greatest reductions of indoor-sourced PM2.5 than either retrofit on its own (Figures 1 and 3). Net reductions in concentrations are seen for all occupant activity scenarios.
Discussion
With this modeling framework, we were able to quantify the impact of energy retrofits on IAQ across different combinations of renovation measures and occupant activity levels. Overall, we found that modeled weatherization-only retrofits generally led to IAQ-related disbenefits while weatherization retrofits accompanied by improvements in ventilation and/or filtration resulted in improved IAQ for most, but not all occupants. While several other field studies9, 10, 12 and modeling assessments2, 15 have observed similar trends, most field studies have lacked the power to measure the effects of variable occupant activity while few modeling studies have reported IAQ impacts by resident behaviors. Importantly, our study examined the potential range of IAQ effects of several types of retrofits across different occupant activity scenarios and found that both the direction and magnitude of retrofit effects on IAQ were influenced by several occupant activities, such as cooking, smoking, and window-opening.
We summarize these influences using our definition of indoor retrofit resiliency. The full package of retrofits (i.e., weatherization + exhaust fans + improved HVAC filtration) was resilient to the range of occupant activities that we modeled, while some subsets of the full intervention were not. Weatherization-only retrofits led to increases in at least one indoor pollutant in all homes except those with average cooking, open windows, and no smoking. This would therefore be a minimally resilient retrofit; however, weatherization alone is rarely implemented with IAQ benefits as the primary endpoint.
The addition of improved ventilation and/or filtration mitigated some of the indoor pollutant buildup associated with weatherization, leading to a more resilient retrofit. However, the efficacy of these removal mechanisms varied by the magnitude and location of pollutant-generating occupant activities. In line with simulation results from Emmerich et al.,2 we found that weatherization accompanied by local exhaust ventilation in the kitchen tended to be most resilient to local cooking sources. However, as our model results indicate, window-opening activity can reduce the influence of fan exhaust on local cooking-sourced pollutants as well as lessen the removal efficacy of non-local pollutants, such as smoking-related PM2.5. Consequently, fans are not fully resilient to heavy smoking when windows are opened across both seasons. The resiliency of exhaust fans could also be affected by inconsistent utilization,33 lower capture efficiencies associated with certain kitchen exhaust designs and cooking behavior (e.g. front versus back burner cooking),29–31 or be cost prohibitive to install or keep in good working order in some housing.34
Weatherization accompanied by improved HVAC filtration provided PM2.5-related benefits across all occupant scenarios in the heating season. However, if HVAC filtration was not active (during the cooling season) or improved (during the heating season), the intervention would not be resilient to window-opening activity with heavy smoking, which may be representative of other high emitting sources without dedicated local exhaust ventilation (e.g. incense, candles, fireplaces, or wood-burning stoves). Furthermore, many multifamily residences do not have mechanical ventilation, and those that do are generally limited to ventilation systems with particle filtration and therefore do not influence exposures to gaseous pollutants such as NO2.
While each subset intervention falls short of the resiliency of the full retrofit, our findings indicate that smaller (and less expensive) retrofit packages could be viable for specific multifamily buildings when financial constraints make it impractical to implement a complete set of energy and ventilation retrofits recommended by existing standards (e.g., ASHRAE 62.2 & 189.1).35, 36 For example, compared to a building with smokers, a building with a no-smoking policy would be more likely to have robust benefits from a bundle including only weatherization and kitchen exhaust fans, which have the added benefit of cross-season effectiveness. However, interventions that rely on changes in occupant behavior need to have mechanisms to ensure compliance, or they run the risk of causing adverse health effects. The clear advantage of a resilient intervention is that it does not depend on some of these contingencies.
In addition to source control policies, operations and maintenance practices and resident education can increase retrofit benefits through proper installation and maintenance of ventilation systems (e.g. filter cleaning or replacement) as well as occupant education to improve operation compliance.33
In general, although our model is based on a single building template in a defined geographic location, with a modeled set of activity patterns, our findings reasonably agree with the literature. For example, based on a simulation study of a diverse, energy-retrofitted UK housing stock, Wilkinson et al. reported an overall decrease in indoor PM2.5 following building tightening and attributed the benefits to reduced infiltration of outdoor PM2.5 and limited indoor sources (i.e., no smoking).37 In a separate study of the London housing stock, Shrubsole et al. predicted that weatherization without mechanical ventilation would lead to an average increase in personal exposure to indoor PM2.5 by 5.4 μg/m3, versus exposure reductions for bundled interventions.15 Emmerich et al. found that exhaust fan utilization was a more effective intervention to reduce cooking-sourced PM2.5 and NO2 compared to HVAC air filtration improvements; however, these results were based on a single cooking emission rate and schedule for NO2 and PM2.5 and did not include smoking.2 Similar to Emmerich et al., we observed a slight increase in outdoor-generated PM2.5 and NO2 due to fan utilization; however, the reduction in indoor-sourced pollutants (i.e., pollutants from cooking and PM2.5 from smoking in the living room) greatly outweighed the disbenefits.
Because of the complexity of building and airflow physics, as well as human behavior, there are limitations in using models to describe these systems. However, our study is meant to be a comparative analysis for which valid scientific assumptions have been made. To account for the complexities of pollutant transport in multifamily buildings, we utilized the well-validated CONTAM model, which has been extensively applied to measure the IAQ impacts of central forced-air heating and cooling systems,38 energy-efficient retrofits,2, 27 and healthy-home interventions.27, 39, 40 Directly validating the modeled outputs using measurements was not plausible given the factorial design and the hypothetical nature of each of the 64 scenarios, but CONTAM has been widely validated and our concentration estimates are similar to those in the literature for comparable scenarios. In addition, the factorial design allowed us to effectively test the sensitivity of our conclusions to a range of source emission rates, basic building characteristics, and occupant behaviors like window opening, effectively increasing the generalizability of our work.
To capture the influence of occupant activity on IAQ, we applied fixed schedules for indoor temperature, cooking and smoking activity, window- and door-opening, and exhaust fan operation. While these standardized schedules allowed for direct comparisons between retrofit scenarios, they do not capture the variability in human activity or the influence of the outdoor environment on indoor conditions. For example, window-opening activity was included for ventilation purposes during scheduled cooking and showering events but we did not account for changes in human activity in response to extremes in internal temperature, a significant driver of window-opening activity,41 or elevated pollutant concentrations that would likely lead to mitigation measures by residents (e.g. fan utilization, window-opening, or smoking cessation). For this reason, while some of our highest modeled concentrations accurately reflect model parameters, they may be higher than those more commonly observed in real-world scenarios. For example, a field study of single-family residences and multi-family apartments with mean home size of 155 m3 and average smoking frequency of 44 cigarettes/day reported mean indoor PM2.5 values of 84 μg/m3 (range = 23–285 μg/m3) in smoking-designated rooms and 63 μg/m3 (range = 14–194) in areas distal to indoor smokers.42 In the current study, we simulated similar, but slightly higher total indoor PM2.5 concentrations (range = 31–305 μg/m3) despite greater indoor volumes (222 m3) and lower smoking rates (24 cigarettes/day).
Additionally, all occupant activity was assumed to be the same before and after the retrofit, based on results from a questionnaire administered to building residents that indicated no significant occupant activity changes. However, in other studies behavioral changes have been recorded. For example, Coombs et al. observed less window-opening following green retrofits (including weatherization and central heating upgrades) in a low-income housing complex in Cincinnati, OH.11 Lastly, no information was available to validate leakage rates, so modeling results are therefore representative of the characteristics of a typical low-rise building at the modeled location, not any specific building. In spite of these simplifying assumptions and other limitations intrinsic to simulation modeling, our model offers a framework for analyzing hypothetical changes in window opening and cooking activity and can easily accommodate alternative assumptions, both in the parameters of our factorial design and in the building configuration within CONTAM.
Conclusions
Overall, our results support current recommendations to incorporate improved ventilation and/or filtration measures into traditional energy efficiency campaigns in order to mitigate IAQ disbenefits commonly associated with building tightening. Given that the IAQ performance of these retrofits is highly dependent on occupant activities, such as cooking, smoking, and window-opening activity, it is important to ascertain precisely which combinations of retrofits are resilient to which occupant activities. Our findings demonstrate that several retrofit combinations may lead to disbenefits for certain subpopulations (e.g. smokers in weatherized buildings without mechanical filtration or heavy cookers in retrofitted kitchens without exhaust fans). While our quantitative findings may not generalize to other buildings given the importance of building configuration and occupant activity patterns, our retrofit resiliency framework stands as a valuable approach to assessing the impacts of housing interventions across diverse populations and seasons and may be especially important in the context of low-income multifamily housing considering the potential range of occupant activities within buildings. Specifically, our methods can be used to identify resident populations for whom sets of interventions may lead to disbenefits, as well as retrofits that must be coupled with changes in occupant behavior, such as indoor smoking cessation, to ensure fully resilient, and cost-effective, interventions.
Supplementary Material
Practical Implications (5 sentence limit).
Simulation modeling can be used to identify the impact of specific residential energy efficiency and ventilation retrofits and occupant activities on ventilation and indoor air quality (IAQ). Our methods identified retrofits that provide IAQ benefits regardless of indoor occupant activities (i.e., retrofits with indoor retrofit resiliency). Our methods can also be used to find cost-effective approaches to maximize IAQ benefits by combining energy efficiency measures with resident education and/or behavioral interventions.
Acknowledgements
This study was supported by the United States Department of Housing and Urban Development (HUD Technical Grant MAHHU0008–12) and the National Institute of Environmental Health Sciences (NIEHS T32 ES014562). The authors wish to thank the tenant’s organization and building residents for their support. The conclusions presented in this work are those of the listed authors and do not necessarily represent the official opinion of HUD or NIEHS.
References
- 1.U.S. Code of Federal Regulations. Part 440-weatherization assistance for low income persons. Vol. 49-CFR 3629, Washington, D.C. [Google Scholar]
- 2.Emmerich SJ, Reed CH and Gupta A. Modeling the IAQ impact of HHI interventions in inner-city housing. NISTIR 7212. National Institute of Standards and Technology; 2005. [Google Scholar]
- 3.Zota A, Adamkiewicz G, Levy JI and Spengler JD. Ventilation in public housing: Implications for indoor nitrogen dioxide concentrations. Indoor Air. 2005;15:393–401. [DOI] [PubMed] [Google Scholar]
- 4.Sundell J, Levin H, Nazaroff WW, et al. Ventilation rates and health: Multidisciplinary review of the scientific literature. Indoor Air. 2011;21:191–204. [DOI] [PubMed] [Google Scholar]
- 5.Giovino GA, Schooley MW, Zhu B-P, et al. Surveillance for selected tobacco-use behaviors—United States, 1900–1994. MMWR CDC Surveill Summ. 1994. [PubMed] [Google Scholar]
- 6.CDC. Use of unvented residential heating appliances – United States, 1988–1994 MMWR Morb Mortal Wkly Rep. 51. Centers for Disease Control and Prevention; 1997;46:1221. [PubMed] [Google Scholar]
- 7.Baxter LK, Clougherty JE, Laden F and Levy JI. Predictors of concentrations of nitrogen dioxide, fine particulate matter, and particle constituents inside of lower socioeconomic status urban homes. J Expo Sci Environ Epidemiol. 2007;17:433–444. [DOI] [PubMed] [Google Scholar]
- 8.Moorman JE, Rudd RA, Johnson CA, et al. National surveillance for asthma – United States, 1980–2004. MMWR Surveill Summ. 2007;56:1–54. [PubMed] [Google Scholar]
- 9.Noris F, Adamkiewicz G, Delp WW, et al. Indoor environmental quality benefits of apartment energy retrofits. Build Environ. 2013;68:170–178. [Google Scholar]
- 10.Colton MD, Macnaughton P, Vallarino J, et al. Indoor air quality in green vs conventional multifamily low-income housing. Environ Sci Technol. 2014;48:7833–7841. [DOI] [PubMed] [Google Scholar]
- 11.Coombs KC, Chew GL, Schaffer C, et al. Indoor air quality in green-renovated vs. non-green low-income homes of children living in a temperate region of US (Ohio). Sci Total Environ. 2016;554–555:178–185. [DOI] [PMC free article] [PubMed] [Google Scholar]
- 12.Frey SE, Destaillats H, Cohn S, Ahrentzen S and Fraser MP. The effects of an energy efficiency retrofit on indoor air quality. Indoor Air. 2015;25:210–219. [DOI] [PubMed] [Google Scholar]
- 13.Wilson J, Jacobs D, Reddy A, Tohn E, Cohen J and Jacobsohn E. Home Rx: The health benefits of home performance: A review of the current evidence. U.S. Department of Energy; 2016. [Google Scholar]
- 14.Francisco PW, Jacobs DE, Targos L, et al. Ventilation, indoor air quality, and health in homes undergoing weatherization. Indoor Air. 2017;27:463–477. [DOI] [PubMed] [Google Scholar]
- 15.Shrubsole C, Ridley I, Biddulph P, et al. Indoor PM2.5 exposure in London’s domestic stock: Modelling current and future exposures following energy efficient refurbishment. Atmos Environ. 2012;62:336–343. [Google Scholar]
- 16.Hamilton I, Milner J, Chalabi Z, et al. Health effects of home energy efficiency interventions in England: A modelling study. BMJ Open. 2015;5:e007298. [DOI] [PMC free article] [PubMed] [Google Scholar]
- 17.Persily AK and Emmerich SJ. Resilience and the indoor environment. ASHRAE J. 2016;58:71. [PMC free article] [PubMed] [Google Scholar]
- 18.Hollnagel E Resilience engineering and the built environment. Build Res Inf. 2014;42:221–228. [Google Scholar]
- 19.NIST. National Institute of Standards and Technology. CONTAM 3.1.0.3. http://www.bfrl.nist.gov/IAQanalysis/software/index.htm
- 20.Fabian MP, Lee SK, Underhill LJ, Vermeer K, Adamkiewicz G and Levy JI. Modeling environmental tobacco smoke (ETS) infiltration in low-income multifamily housing before and after building energy retrofits. Int J Environ Res Public Health. 2016;13. [DOI] [PMC free article] [PubMed] [Google Scholar]
- 21.Delfino RJ, Staimer N, Tjoa T, et al. Personal and ambient air pollution exposures and lung function decrements in children with asthma. Environ Health Perspect. 2008;116:550. [DOI] [PMC free article] [PubMed] [Google Scholar]
- 22.Delfino RJ, Quintana PJ, Floro J, et al. Association of FEV1 in asthmatic children with personal and microenvironmental exposure to airborne particulate matter. Environ Health Perspect. 2004;112:932. [DOI] [PMC free article] [PubMed] [Google Scholar]
- 23.Gauderman WJ, Avol E, Gilliland F, et al. The effect of air pollution on lung development from 10 to 18 years of age. New Engl J Med. 2004;351:1057–1067. [DOI] [PubMed] [Google Scholar]
- 24.Horak F, Studnicka M, Gartner C, et al. Particulate matter and lung function growth in children: A 3-yr follow-up study in Austrian schoolchildren. Eur Respir J. 2002;19:838–845. [DOI] [PubMed] [Google Scholar]
- 25.Trenga CA, Sullivan JH, Schildcrout JS, et al. Effect of particulate air pollution on lung function in adult and pediatric subjects in a Seattle panel study. Chest. 2006;129:1614–1622. [DOI] [PubMed] [Google Scholar]
- 26.National Renewable Energy Laboratory. National Solar Radiation Data Base. 1961–1990: Typical Meteorological Year 2 (TMY2). Boston Station 14739. http://rredc.nrel.gov/solar/old_data/nsrdb/1961-1990/tmy2/
- 27.Fabian P, Adamkiewicz G and Levy JI. Simulating indoor concentrations of NO2 and PM2.5 in multifamily housing for use in health-based intervention modeling. Indoor Air. 2012;22:12–23. [DOI] [PMC free article] [PubMed] [Google Scholar]
- 28.Kowalski WJ and Bahnfleth WP. MERV filter models for aerobiological applications. Air Media. 2002;Summer(2002):13–17. [Google Scholar]
- 29.Lunden MM, Delp WW and Singer BC. Capture efficiency of cooking‐related fine and ultrafine particles by residential exhaust hoods. Indoor Air. 2015;25:45–58. [DOI] [PubMed] [Google Scholar]
- 30.Singer BC, Delp WW, Price P and Apte M. Performance of installed cooking exhaust devices. Indoor Air. 2012;22:224–234. [DOI] [PubMed] [Google Scholar]
- 31.Delp WW and Singer BC. Performance assessment of US residential cooking exhaust hoods. Environ Sci Technol. 2012;46:6167–6173. [DOI] [PubMed] [Google Scholar]
- 32.ASHRAE (2012) Standard 52.2–2012 Method of testing general ventilation air-cleaning devices for removal efficiency by particle size. Atlanta, GA, American Society of Heating, Refrigerating, and Air-Conditioning Engineers, Inc. and U.S. Green Building Council [Google Scholar]
- 33.Less B, Mullen N, Singer B and Walker I. Indoor air quality in 24 California residences designed as high-performance homes. Science and Technology for the Built Environment. 2015;21:14–24. [Google Scholar]
- 34.Paulin LM, Diette GB, Scott M, et al. Home interventions are effective at decreasing indoor nitrogen dioxide concentrations. Indoor Air. 2014;24:416–424. [DOI] [PMC free article] [PubMed] [Google Scholar]
- 35.ASHRAE (2016) ANSI/ASHRAE Standard 62.2 Ventilation and Acceptable Indoor Air Quality in Residential Buildings. Atlanta, GA, American Society of Heating, Refrigerating, and Air-Conditioning Engineers, Inc. [Google Scholar]
- 36.ASHRAE (2016) ANSI/ASHRAE/IES Standard 90.1–2016 Energy Standard for Buildings Except Low-Rise Residential Buildings. Atlanta, GA, American Society of Heating, Refrigerating, and Air-Conditioning Engineers, Inc. [Google Scholar]
- 37.Wilkinson P, Smith KR, Davies M, et al. Public health benefits of strategies to reduce greenhouse-gas emissions: Household energy. The Lancet. 2009;374:1917–1929. [DOI] [PubMed] [Google Scholar]
- 38.Emmerich SJ and Persily AK. Multizone modeling of three residential indoor air quality control options. NISTIR 5801. National Institute of Standards and Technology; 1996. [Google Scholar]
- 39.Macintosh DL, Minegishi T, Kaufman M, et al. The benefits of whole-house in-duct air cleaning in reducing exposures to fine particulate matter of outdoor origin: A modeling analysis. Journal of Exposure Science and Environmental Epidemiology. 2010;20:213–224. [DOI] [PubMed] [Google Scholar]
- 40.Myatt TA, Minegishi T, Allen JG and Macintosh DL. Control of asthma triggers in indoor air with air cleaners: A modeling analysis. Environ Health. 2008;7:43. [DOI] [PMC free article] [PubMed] [Google Scholar]
- 41.Fabi V, Andersen RV, Corgnati S and Olesen BW. Occupants’ window opening behaviour: A literature review of factors influencing occupant behaviour and models. Build Environ. 2012;58:188–198. [Google Scholar]
- 42.Van Deusen A, Hyland A, Travers MJ, et al. Secondhand smoke and particulate matter exposure in the home. Nicotine Tobacco Res. 2009;11:635–641. [DOI] [PubMed] [Google Scholar]
Associated Data
This section collects any data citations, data availability statements, or supplementary materials included in this article.