. 2019 Jan 15;8:e41690. doi: 10.7554/eLife.41690

Figure 2. An extensive benchmark suite of 20 different relationships spanning polynomial, trigonometric, geometric, and other relationships demonstrates that Mgc empirically nearly dominates eight other methods across dependencies and dimensionalities ranging from 1 to 1000 (see Materials and methods and Figure 2—figure supplement 1 for details).

Each panel shows the testing power of other methods relative to the power of Mgc (e.g. power of Mcorr minus the power of Mgc) at significance level α=0.05 versus dimensionality for n=100. Any line below zero at any point indicates that that method’s power is less than Mgc’s power for the specified setting and dimensionality. Mgc achieves empirically better (or similar) power than all other methods in almost all relationships and all dimensions. For the independent relationship (#20), all methods yield power 0.05 as they should. Note that Mgc is always plotted ‘on top’ of the other methods, therefore, some lines are obscured.

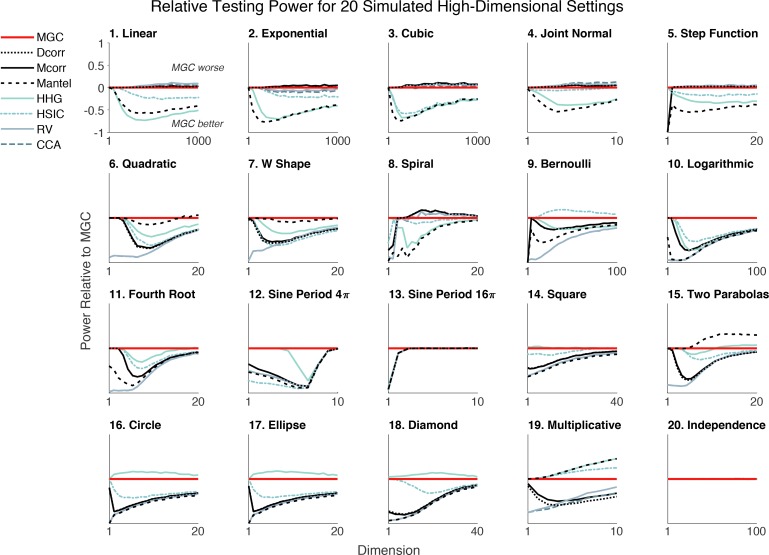
Figure 2.

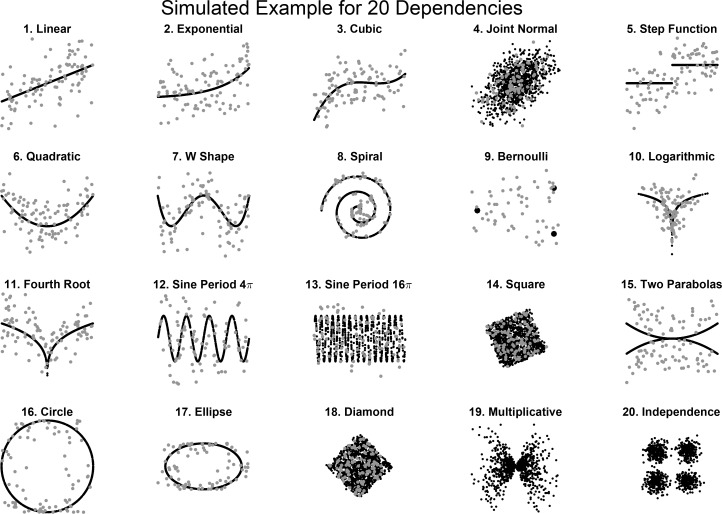
Figure 2—figure supplement 1. Visualization of the 20 dependencies at p=q=1.

Figure 2—figure supplement 1.

For each, n=100 points are sampled with noise (κ=1) to show the actual sample data used for one-dimensional relationships (gray dots). For comparison purposes, n=1000 points are sampled without noise (κ=0) to highlight each underlying dependency (black dots). Note that only black points are plotted for type 19 and 20, as they do not have the noise parameter κ.
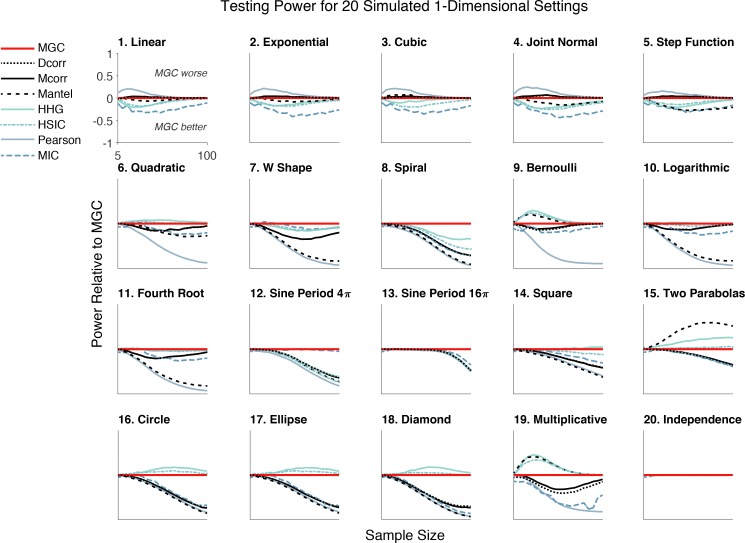
Figure 2—figure supplement 2. The same power plots as in Figure 2, except the 20 dependencies are one-dimensional with noise, and the x-axis shows sample size increasing from 5 to 100.

Figure 2—figure supplement 2.

Mgc empirically achieves similar or better power than the previous state-of-the-art approaches on most problems. Note that Mic is included in 1D case; RV and Cca both equal Pearson in 1D; Kendall and Spearman are too similar to Pearson in power and thus omitted in plotting.
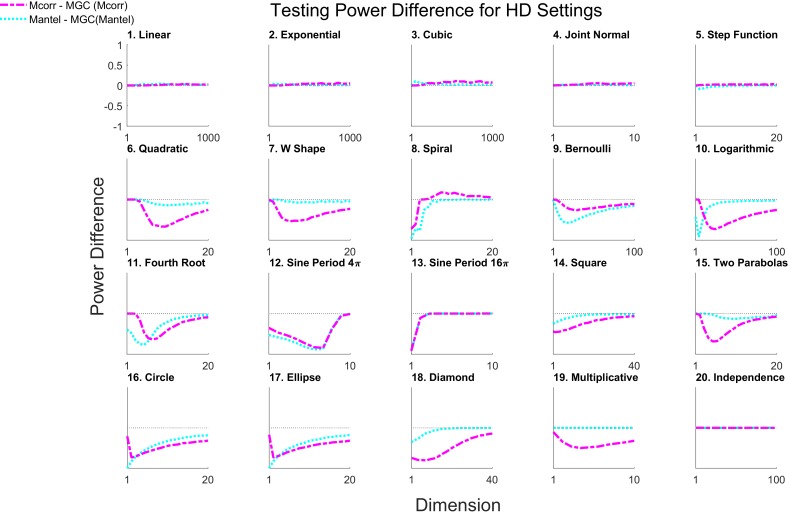
Figure 2—figure supplement 3. The same set-ups as in Figure 2, comparing different Mgc implementations versus its global counterparts.

Figure 2—figure supplement 3.

The default Mgc builds upon Mcorr throughout the paper, and we further consider Mgc on Mantel to illustrate the generalization. The magenta line shows the power difference between Mcorr and Mgc , and the cyan line shows the power difference between Mantel and the Mgc version of Mantel. Indeed, Mgc is able to improve the global counterpart in testing power under nonlinear dependencies, and maintains similar power under linear and independent dependencies.
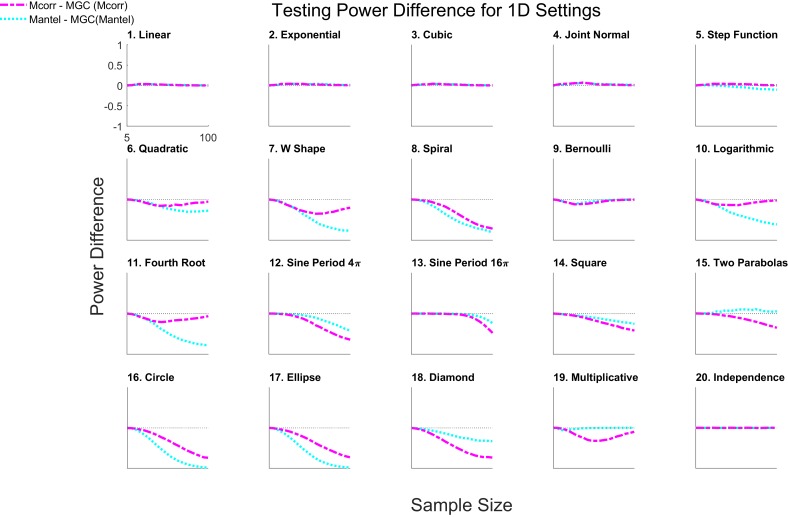
Figure 2—figure supplement 4. The same power plots as in Figure 3, except the 20 dependencies are one-dimensional with noise, and the x-axis shows sample size increasing from 5 to 100.

Figure 2—figure supplement 4.