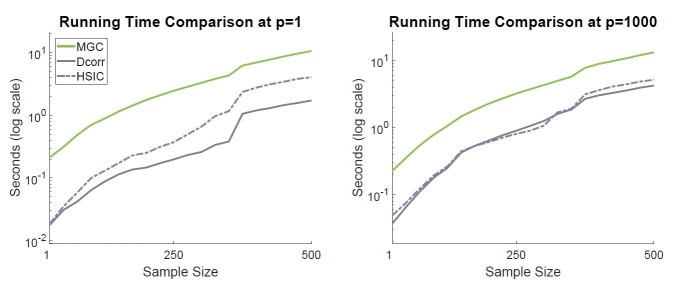
Author response image 1. Compute the test statistics of MGC, DCORR, and HSIC for 100 replicates, and then plot the average running time in log scale (clocked using Matlab 2017a on a Windows 10 machine with I7 six-core CPU).
The sample data are repeatedly generated using the quadratic relationship in Appendix, the sample size increases from 25 to 500, and the dimensionality is fixed at p = 1 on the left and p = 1000 on the right. In either panel, the three lines differ by some constants in the log scale, suggesting the same running time complexity but different constants. MGC has a higher intercept than the other two, which translates to about a constant of 6 times of DCORR and 3 times of HSIC at n = 500 and p = 1, and about 3 at p = 1000.

