Abstract
Background:
Topotecan is a chemotherapeutic agent that is active against many pediatric tumors. Although its effect is related to systemic exposure, the interpatient variability in systemic clearance makes it challenging to achieve desired topotecan targets. This study aims to evaluate the success of the pharmacokinetically (PK)-guided dosing process, which was used to achieve a target topotecan area under the concentration-time curve (AUC).
Methods:
Patients received an empiric topotecan dosage on the first day, the topotecan lactone AUC was determined, and based upon these values the topotecan dosage was adjusted. The success rates of both the empiric and PK-guided strategies were calculated. Patient-specific covariates were collected to explain variability observed in the empiric and PK-guided results. A simulation study was performed to assess the differences in cumulative topotecan dosage and systemic exposure between a PK-guided and standard dosing approach.
Results:
Data were collected from nine clinical trials open from 1996 to 2016 (n=232 patients). The empiric dosing success rate was 35.5%, while the PK-guided rate was 64.4%. A difference in mean serum creatinine was observed between successful empiric studies and those above the AUC target. Compared to a standard dosing approach, the PK-guided group had a higher average cumulative dosage and systemic exposure.
Conclusion:
The low empiric dosing success rate indicates that additional studies are needed to refine the initial topotecan dosage. The role of renal function, measured as serum creatinine, remains to be elucidated. However, the PK-guided targeting success rate highlighted the need to account for variable topotecan systemic clearance.
Keywords: topotecan, PK-guided dosing, pharmacokinetics, pediatrics
Introduction:
Topotecan, a camptothecin analogue whose cytotoxicity is mediated by its interaction with DNA topoisomerase I,1 exists in a pH-dependent equilibrium between the active lactone form and the inactive hydroxy-acid form. In preclinical and clinical studies, topotecan is active in pediatric malignancies such as neuroblastoma, rhabdomyosarcoma, and medulloblastoma.2 Preclinical studies suggest the antitumor effect of topotecan is highly schedule-dependent and follows a steep systemic exposure-antitumor response curve. For example, in various xenograft models of pediatric solid tumors, the reduction of the topotecan plasma systemic exposure by as little as one-half results in a complete loss of antitumor activity.3
Pharmacokinetic studies of topotecan in children have shown a linear disposition as well as a marked interpatient variability. For example, in a study conducted by the Pediatric Oncology Group (POG Study 9275), a 3- to 5-fold variation in systemic exposure of topotecan lactone was observed when dosing was determined based upon body surface area (BSA) calculations.4 This variability, in part, may explain why considerable heterogeneity is observed in both response and toxicity for a given BSA-based topotecan dosage. Thus, significant variability in plasma systemic exposure in children and the marked schedule- and dose-dependent antitumor activity in xenograft models make topotecan an ideal drug for a pharmacokinetically (PK)-guided dosing approach.
This approach has been utilized at our institution for the last 20 years. Patients receive a fixed initial, or empiric, dosage on the first day of therapy. Pharmacokinetic (PK) studies are performed to determine the systemic clearance and area under the concentration-time curve (AUC) values for the patient. Based upon those values, the topotecan dosage may be adjusted, if necessary, to attain plasma topotecan lactone concentrations within the desired pre-defined AUC range. Several studies have reported efficacious systemic topotecan exposures based on this PK-guided dosing method.5–8 However, the cumulative success and failure rates that span multiple clinical trials utilized at our institution have not been reported. By evaluating the PK-guided dosing process used to achieve a target topotecan AUC in clinical trials, the aims of the present study are to evaluate the success rates of the empiric and PK-guided dosing approaches, to determine if patient-specific covariates explain variability observed in the empiric and PK-guided dosing successes, and to compare the PK-guided dosing approach with a fixed dosing approach.
Materials and Methods:
Patient population, drug formulation, sample processing, and HPLC method
Data for this study were derived from a retrospective IRB-approved chart review of patients enrolled on nine institutional clinical trials that utilized a PK-guided topotecan dosing approach from August 1996 to August 2016. Informed consent was obtained from patients, parents, or legal guardians for study participation. An individual description of each clinical trial is presented in a Supplemental Table 1. Topotecan formulation, sample processing, and HPLC methodology are described in detail in Supplemental Materials.
For the first dose in the first course (C1D1), patients received an empiric, or predefined, topotecan dosage. This empiric dosage was based upon the most recent research and best clinical knowledge available to the Principal Investigator at the time of writing the clinical trial(s). As part of the PK-guided dosing approach, plasma samples were obtained after this dose (ranging from 3 to 7 samples), processed, and topotecan lactone concentrations were measured by an HPLC method (Supplemental Materials). A 2-compartment PK model was then fit to the topotecan lactone plasma concentration-time data using maximum a posteriori (MAP-Bayesian) estimation with ADAPT 5.9 Systemic clearance was calculated, and AUC from time zero to infinity (AUC0→∞) was determined using the log-linear trapezoidal method. The topotecan dosage was adjusted to attain a target plasma topotecan lactone AUC, based on the clinical trial in which the patient was enrolled. If the single-day topotecan lactone AUC was within the target range, no dose adjustment was required. Otherwise, the topotecan dosage was adjusted linearly, based on the patient’s topotecan lactone clearance, which was estimated from the PK model. If necessary, repeat PK studies were performed on the next available course and/or day, based on the clinical trial(s). This procedure was continued until the patient’s topotecan AUC was within the target range (See Supplemental Figure 1). The PK guided dosage obtained on the final PK assessment of Course 1 was used to determine the starting dosage for the next course of topotecan therapy.
Data Analysis
To evaluate the two topotecan dosing approaches, a distinction was made between AUC values resulting from the empiric dosage (i.e., the first dose of the first course) and those from the PK-guided dosage adjustment. An empiric dosage success was defined as achieving an AUC in the predefined target range, based on the specific clinical trial on C1D1 of topotecan therapy. A PK-guided success was one that achieved the AUC target range on a course or day other than C1D1 (e.g., after a dosage adjustment was made in response to the AUC achieved on C1D1). To determine the respective empiric and PK-guided success rates, the number of studies within the predefined target systemic exposure range were compared with the total number of studies.
Patient-specific covariates (see Table 1) were collected to explain variability observed in the empiric and PK-guided results. To increase the likelihood of finding a relationship, this covariate analysis was conducted in the group with the greatest number of patients (n=109) compared with the other target ranges (i.e., 80–120 ng/ml*hr and 70–90 ng/ml*hr ranges, 31 and 46 patients, respectively).
Table 1:
Baseline patient demographics and selected laboratory values from C1D1
| Characteristic from C1D1 | n | Median | Range |
|---|---|---|---|
| Age (years) | 232 | 4.04 | 0.04–21.7 |
| Height (cm) | 232 | 103 | 49.5–181.7 |
| Weight (kg) | 232 | 15.75 | 3.99–159.7 |
| BSA (m2) | 232 | 0.69 | 0.23–2.86 |
| Serum creatinine (mg/dl) | 218 | 0.4 | 0.1–2.9 |
| Gender | |||
| Male | 137 | ||
| Female | 95 | ||
| Race | |||
| White | 167 | ||
| Black | 38 | ||
| Other | 20 | ||
| Unavailable | 7 | ||
| Tumor type | |||
| Acute Myeloid Leukemia | 19 | ||
| Atypical Teratoid/Rhabdoid Tumor | 8 | ||
| Medulloblastoma | 42 | ||
| Neuroblastoma | 68 | ||
| Retinoblastoma | 26 | ||
| Wilms tumor | 32 | ||
| Other brain tumors | 19 | ||
| Other | 18 | ||
A 2-tailed Fisher’s exact test was used to determine significance among AUC groups, Analysis of Variance (ANOVA) was used to test covariates among the studies, and an unpaired t-test was used to detect differences in covariates between two groups. A p-value of <0.05 was used to represent statistical significance. Statistical analyses were performed using GraphPad Prism (version 7.0d, for Mac, GraphPad Software, La Jolla California USA, www.graphpad.com).
Our PK-guided dosing approach was further assessed in a post-hoc comparison with results determined from a fixed dosing approach, which was based on published precedents and current clinical practice for dosing topotecan. The patients selected for this simulation analysis were those with an AUC target range of 120 to 160 ng/ml*hr. Using the equation , the known patient topotecan systemic clearances (calculated for each patient during their respective clinical study) and patient body surface area (BSAs), the cumulative dosages were simulated for the daily × 5 (i.e., 30-minute infusion daily for 5 days) PK-guided approach with an AUC target of 140 ng/ml*hr and compared this with a fixed topotecan dosage of 2.0 mg/m2 daily × 5 (i.e., maximally tolerated dosage or MTD).4 The cumulative AUC values were also simulated for each group using the equation mentioned above for both the PK-guided and the fixed dosage approaches.
Results:
Patients
Nine institutional clinical trials were reviewed for this retrospective analysis, which included 232 patients and 967 total studies (231 empiric studies and 736 PK-guided studies). One patient from trial no. 1 (see Supplemental Table 1) did not have an empiric dosing result recorded, and thus was excluded from any analysis involving empiric dosing. Table 1 summarizes the patient characteristics, including age, gender, race, and disease tumor type on the first day of the first course of therapy.
Empiric Dosing
Of the 967 total studies, 231 were empiric studies, or ones conducted on the first dose of the first course of topotecan therapy. Eighty-two studies were within the desired topotecan target range, for an empiric success rate of 36% (82/231). Patients enrolled in clinical trials with AUC target ranges of 70–90 and 80–120 ng/ml*hr had an overall higher percentage of empiric successes compared to those with an AUC target range of 120–160 ng/ml*hr, as shown in Figure 1. Among the out-of-target studies in the 120–160 ng/ml*hr range, 54% (46 of 85 studies) were below target. Of note, clinical trials with the AUC range 120–160 ng/ml*hr had 110 patients, those ranging from 70–90 ng/ml*hr included 43 patients, and those with an 80–120 ng/ml*hr range included 40 patients.
Figure 1:
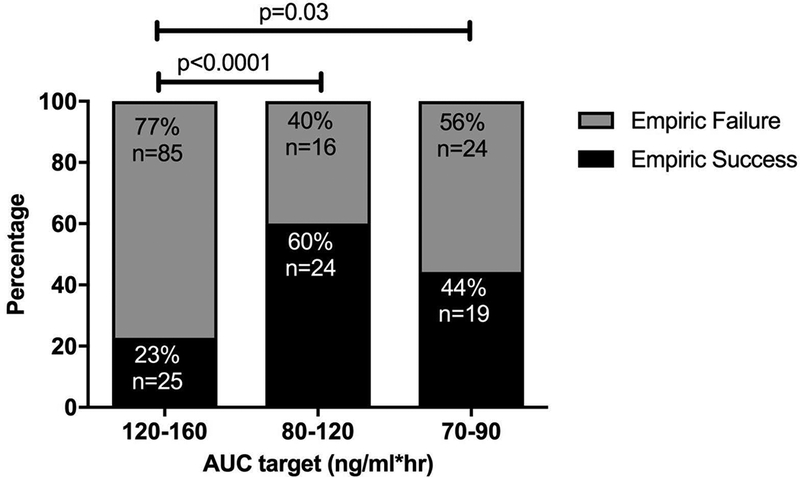
Empiric success rates (both total numbers and percentages) of 3 different AUC ranges encompassing all protocols. (p<0.0001 for AUC range 120 to 160 vs 80 to 120; p=0.03 for AUC range 120 to 160 vs 70 to 90)
The proportion of empiric successes to failures did not significantly differ based on factors that varied among clinical trials, such as infusion length and number of blood samples collected (p= 0.10 and 0.11, respectively), nor did they differ by age for the AUC target of 120–160 ng/ml*hr (p=0.78). When patient covariates were analyzed to assess whether an empiric study was within, above, or below the predefined AUC target (i.e., 120–160 ng/ml*hr), serum creatinine differed significantly among these categories: patients who achieved an empiric success had, on average, a lower value compared to patients who were above target (p=0.01), as shown in Figure 2.
Figure 2:
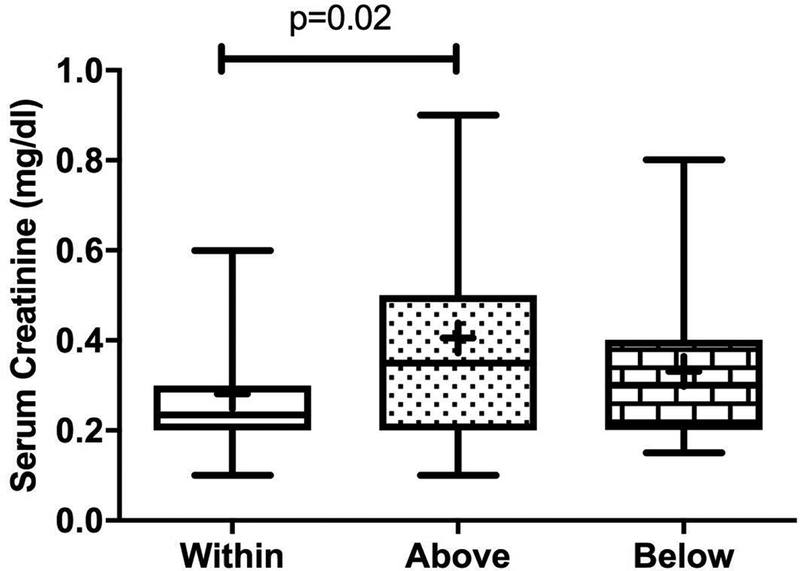
Box-and-whiskers plot of the type of target achieved (in, above, and below target) for the 120–160 ng/ml*hr AUC range for the empiric dose based on serum creatinine. The line in the middle of each box represents the median, the “+” is the mean, the boxes represent the 25th and 75th percentiles, and the upper and lower bars represent the minimum and maximum serum creatinine values, respectively. P-value = 0.02 (ANOVA).
PK-guided dosing
After the empiric topotecan dose was administered, pharmacokinetic studies were performed to determine if the patient was within the AUC target range. If the patient was outside of the target range, further pharmacokinetic studies were performed. Of the 967 total studies evaluated, 736 PK-guided studies in 225 patients were included in this analysis. The overall success rate of the PK-guided dosing strategy was 64% (474/736). The number of PK-guided successes and failures did not differ based on AUC target range, length of infusion, or number of blood samples collected (p= 0.08, 0.84, and 0.61, respectively). As shown in Figure 3, the PK-guided success rates over time have consistently remained higher than that of empiric success rates.
Figure 3:
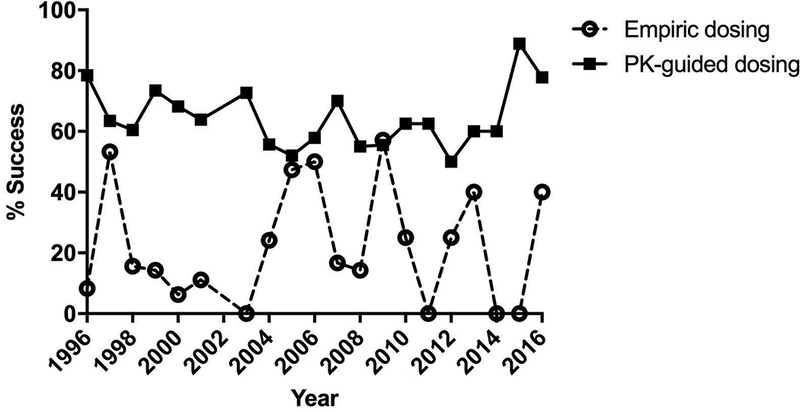
Yearly empiric and PK-guided successes from 1996–2016 from all protocols.
To gain insight into the PK-guided dosing approach in achieving the desired target, all the PK-guided studies within course 1 (n=175) were followed as shown in Figure 4. Based upon the results of the first PK study, the success rate after the first dosage adjustment was 62%, which left 67 patient studies outside the desired target range and requiring a follow-up PK study. For these 67 patient studies, the success rate for their follow-up study (labeled as 2nd PK study) was similar at 66%. However, 7 patients did not have a follow-up PK study to verify if the dosage adjustment resulted in a value within the target range. Thus, these cases were codified as PK-guided failures. By the end of the 2nd PK study, the cumulative PK success rate was 87% (i.e., 152 of 175 studies within target range). By the completion of 4th PK studies, a total of 155 patient studies (89%) successfully achieved their desired AUC target. The remaining 11% (n=20), which were not followed-up with additional PK studies, did receive proportionate dosage adjustments to achieve topotecan AUC values within the target range. These 20 patients are accounted for as follows: 6 patients at an outside institution were unevaluable, as their charts were inaccessible for review; 8 patient studies had AUCs that were 20% higher, on average, than the mid-upper AUC target, and their dosages were appropriately decreased by an average of 22%; and 6 patient studies who had AUCs that were 17% lower, on average, than the mid-lower AUC target, similarly had their dosages increased by an average of 15%.
Figure 4:
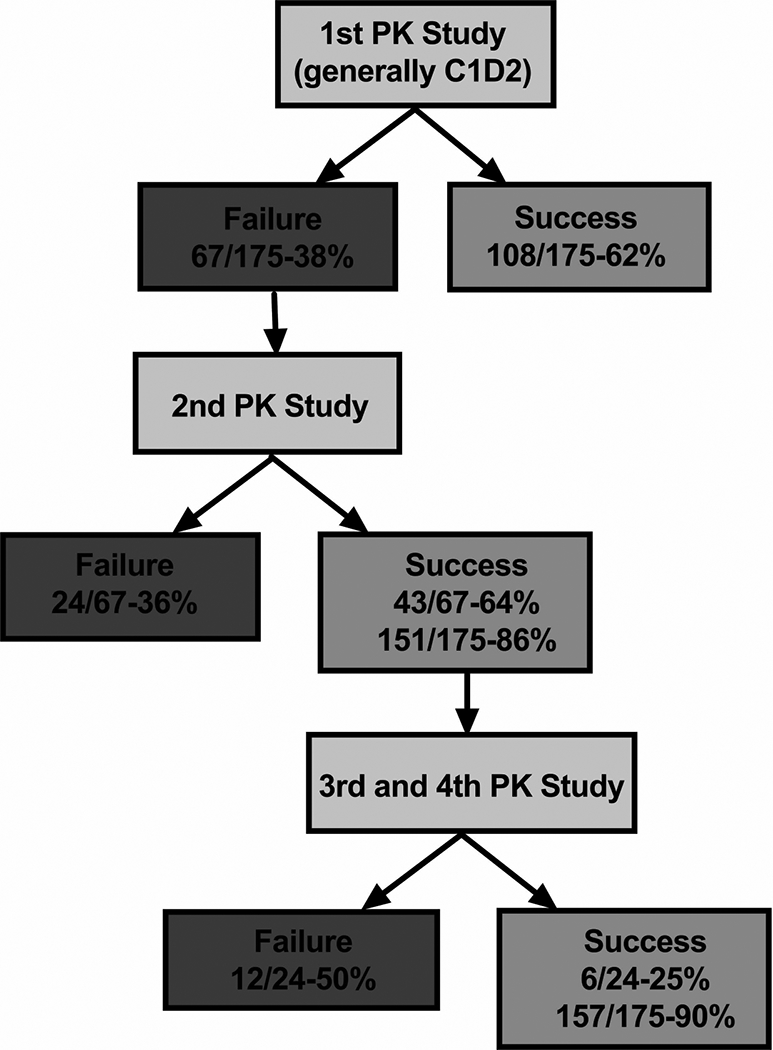
Flowchart of the cumulative failures and successes throughout the PK-guided dosing of C1 (175 patients). Out of the 67 failures from the first PK study, 44 studies achieved subsequent successes, resulting in an 87% cumulative success rate that increased to 89% by the end of the 4th PK-guided study. The remaining 20 patients, who were outside of their predetermined topotecan AUC range, were not restudied to verify target attainment. They did, however, receive a subsequent proportionate dosage adjustment based on their AUC. * Cumulative success rates; ** Cumulative number for patients who were not restudied.
PK-guided versus standard topotecan dosing
The final aim of this study was to compare the PK-guided dosing approach with a clinically accepted fixed topotecan dosing approach. A total of 281 PK studies from 106 patients with an AUC target range of 120 to 160 ng/ml*hr were selected for this simulation analysis. For the fixed dosing approach, the topotecan dosage chosen was 2.0 mg/m2 administered daily for 5 days every 28 days. Thus, the cumulative dosage was 10 mg/m2 within a 28-day course of therapy. The results of our simulation study showed that the mean cumulative topotecan dosage from the PK-guided dosing approach was 18.1 mg/m2. Using the actual topotecan systemic clearance values calculated for each patient during their clinical study, the AUC values for the fixed dosing approach and the PK-guided dosing approach were also simulated: 449 ng/ml*hr and 717 ng/ml*hr, respectively (see Figure 5).
Figure 5:
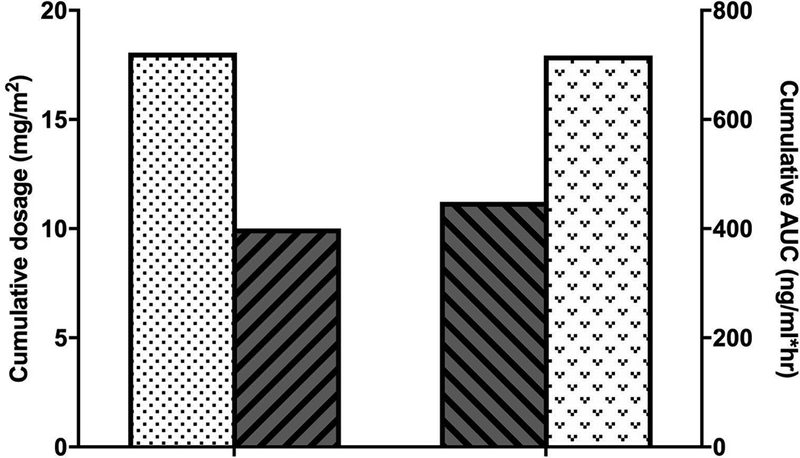
Comparison of the cumulative dosages and AUCs of the both the PK-guided and an MTD (2.0 mg/m2) approach, which was simulated from patients with an AUC target of 120–160 ng/ml*h. (Stipled bars represent PK-guided dosing approach and bars with diagonal lines represent MTD dosing approach.)
Discussion:
This retrospective analysis represents 10 years’ worth of experience with a PK-guided dosing approach for topotecan and resulted in several important observations. First, the process has evolved from a primarily research-based approach (e.g., many samples, bioanalysis performed in a researcher laboratory) to a clinical one (e.g., limited sampling model, bioanalysis performed in a CLIA approved Clinical Pharmacokinetic Laboratory). However, other aspects of the approach remain relatively unchanged, such as an initial empiric fixed dosage, bedside processing to isolate topotecan lactone, and pharmacokinetic modeling to determine the topotecan AUC for any subsequent dosage changes. Second, although the empiric dosage success was only 36% overall, it was as high as 60% for selected AUC ranges. As shown in Figure 3, the PK-guided success rates have consistently remained higher than that of the empiric success rates. Lastly, results of a simulation study showed that our PK-guided dosing approach delivered higher cumulative topotecan dosages and resulted in higher AUC values than a fixed topotecan dosing approach.
Summarized in Supplemental Table 1 are the clinical trials from which the data were obtained for this retrospective analysis. The AUC targets in these clinical trials were derived from clinical and preclinical evidence and accounted for logistical considerations, such as combining topotecan with other anticancer drugs (e.g., trial no.7, in which topotecan was combined with cyclophosphamide). The AUC targets were also disease-specific. For example, patients with medulloblastoma in clinical trial no. 2 had an AUC target range of 120–160 ng/ml*hr based upon data suggesting that a topotecan plasma AUC of 140 ng/ml*hr was associated with a cerebrospinal fluid exposure of > 1 ng/ml for 8 hours10,11 Finally, many of these clinical trials utilized a topotecan pharmacokinetic limited sampling model (LSM) that has been validated and refined throughout the years.12 The use of this LSM has been shown to provide accurate topotecan lactone AUC values, while reducing the technical and clinical costs associated with sample acquisition. Finally, although not formally studied, the use of an LSM decreased the number of blood draws and the time in the clinic, thus, patient satisfaction and quality of life related to the PK-guided studies has most likely improved.
An empiric, or predefined, topotecan dosage was used as the first dose of the first course of therapy (i.e., C1D1). Over the 10 years of this analysis, the average empiric success rate was 36%; however, variability in success rates among the target ranges was observed (see Figure 1). The empiric success rate in the AUC range of 120–160 ng/ml*hr (i.e., 23%) was lower than in the 80–120 ng/ml*hr (i.e., 60%) or the 70–90 ng/ml*hr (i.e., 44%) range. A possible reason for the low empiric success rate in the 120–160 ng/ml*hr group could have been an a priori dosage reduction of the empiric topotecan dosage (i.e., C1D1) by the investigator to avoid what might be perceived as the possibility of myelosuppression. Investigators were likely concerned about myelosuppression because in many patients topotecan was dosed 10 days out of 14 days (i.e., Dx5×2) and even though the PK-guided dosing was performed under the auspices of a clinical trial, investigators had the option to adjust the initial dosage (C1D1) for heavily pre-treated patients. It is possible this adjustment of the empiric topotecan dosage could account for many of these failures, which were below the desired target (~54%).
In the largest subset of targeted patients (i.e., 120 to 160 ng/ml*hr range), patient-specific covariates were examined to account for the variability observed in empiric success rate. In our analysis, those studies within the target range were associated with a lower serum creatinine compared with those studies above the target range. However, it is difficult to interpret the clinical relevance of this finding since most of the serum creatinine values were within the normal age-adjusted ranges. It is noteworthy that this same relationship was not observed with the PK-guided targeting success, given that previous population pharmacokinetic studies have identified renal function (e.g., serum creatinine) as a significant covariate on topotecan systemic clearance.13 This outcome is likely due to the narrow range of normal serum creatinine values, as well as the use of our PK-guided approach to adjust the topotecan dosages based on AUC values, which would negate the effect of the changes due to variability in topotecan systemic clearance.
This study demonstrated that our PK-guided dosing approach achieved favorable targeting success rates. Compared to empiric dosing over time, the PK targeting success remained relatively consistent over time. Although no factors were found to account for the minor year-to-year fluctuations, the most recent trend is toward 80% and higher (see Figure 3). Additionally, an overall 64% success rate is comparable to that observed for other PK-targeted chemotherapeutic agents, such as methotrexate, which has a likelihood of achieving a predefined steady-state plasma concentration (Cpss) of up to 70% in acute lymphoblastic leukemia (ALL) patients.14
By comparing the resultant dosages of our PK-guided approach with that of a standard, topotecan dosing strategy, we demonstrated that the PK-guided dosing can deliver a greater cumulative topotecan dosage and higher overall systemic exposure. Although not explicitly addressed within the purview of our retrospective study, the higher topotecan dosage has been postulated to increase the likelihood of achieving improved antitumor effects and potentially response rates.15 However, using this approach to achieve systemic exposures guided by PK-dosing is dependent on a careful definition from preclinical and/or clinical studies of the desired exposures since high exposures can also contribute to increased toxicity. It is, therefore, crucial to monitor plasma topotecan concentrations to avoid excessive myelosuppression. Another advantage to PK-guided dosing is that it can account for patients with either high or low topotecan systemic clearances. With a fixed dosing approach, patients with high clearances could be inappropriately under-dosed and fail to achieve maximal benefits of the treatment. On the other hand, patients with low topotecan clearances can have elevated systemic exposures, which could lead to excessive toxicity.
Several important limitations are pertinent to interpreting the results of this study. This study was a retrospective analysis, focusing only on the PK-guided topotecan dosing process without including patient outcomes (e.g., toxicity or antitumor effects) in relation to the success or failure of the process. Due to the design of this study, it would not have been feasible to combine the patient outcome data from all nine clinical trials which included different tumor types. Moreover, four of the nine clinical trials were Phase I trials and antitumor effect was clearly not an objective of these trials. Additionally, the expenses of the PK-guided topotecan dosing process were not evaluated in this study. Equipment, personnel, and time required to implement this type of dosing process adds cost and is not easily exportable among institutions. For example, institutions without access to chromatography instruments would be unable to implement this process. Moreover, they may lack the time and resources required to perform bedside sample processing. Thus, our goal has been to further simplify our PK-guided topotecan dosing process as much as possible by decreasing the number of samples required from three to as few as one. We are also working with outside vendors to convert the topotecan bioanalytical method from a chromatography-based method to an immunoassay-based method. Lastly, we have overcome the bedside processing challenge by using whole-blood to measure topotecan lactone.16
Our study illustrates how this PK-guided topotecan dosing approach has addressed the wide interpatient variability in topotecan pharmacokinetics by avoiding the unacceptably low exposures, minimizing the high exposures, and maintaining the majority (~65%) of patients within the desired target range. Future studies need to address the rather poor overall empiric dosage success by using the data from this study to improve the initial dosage prior to the targeting process. Lastly, innovative approaches must continue to be implemented to successfully export into a broader clinical setting this unique topotecan dosing method to further enhance antitumor therapy for this population of pediatric patients.
Supplementary Material
Acknowledgements:
The authors thank the pharmacokinetic research nurses, including Sheri Ring, Paula Condy, and Terri Kuehner, for their assistance in this study; the Stewart Laboratory for bedside collection and processing of the samples; the many post-docs who participated in the pharmacokinetic studies reported in this manuscript; and the clinical pharmacists for their invaluable assistance in the performance of the topotecan PK-guided dosing.
Financial Support: This work was supported by the National Cancer Institute [Grants CA154619 and CA21765] and the American Lebanese Syrian Associated Charities at SJCRH.
Glossary
- ANOVA
Analysis of Variance
- AUC
area under the concentration-time curve
- BSA
body surface area
- CLIA
Clinical Laboratory Improvement Act
- LSM
limited sampling model
- MAP
maximum a posteriori
- PK
pharmacokinetics
- Cpss
steady-state plasma concentration
Footnotes
Conflict of Interest: The authors have no conflicts of interest to declare.
References:
- 1.Liu LF, D’Arpa P. Topoisomerase-targeting antitumor drugs: mechanisms of cytotoxicity and resistance. ImportantAdvOncol. 1992:79–89. [PubMed] [Google Scholar]
- 2.Stewart CF, Zamboni WC, Crom WR, et al. Topoisomerase I interactive drugs in children with cancer. Investigational New Drugs. 1996;14:37–47. [DOI] [PubMed] [Google Scholar]
- 3.Zamboni WC, Stewart CF, Thompson J, et al. Relationship between topotecan systemic exposure and tumor response in human neuroblastoma xenografts. J Natl Cancer Inst. 1998;90(7):505–511. [DOI] [PubMed] [Google Scholar]
- 4.Tubergen DG, Stewart CF, Pratt CB, et al. Phase I trial and pharmacokinetic (PK) and pharmacodynamics (PD) study of topotecan using a five-day course in children with refractory solid tumors: a pediatric oncology group study. J Pediatr Hematol Oncol. 1996;18(4):352–361. [DOI] [PubMed] [Google Scholar]
- 5.Santana VM, Furman WL, Billups CA, et al. Improved response in high-risk neuroblastoma with protracted topotecan administration using a pharmacokinetically guided dosing approach. J Clin Oncol. 2005;23(18):4039–4047. [DOI] [PubMed] [Google Scholar]
- 6.Santana VM, Zamboni WC, Kirstein MN, et al. A pilot study of protracted topotecan dosing using a pharmacokinetically guided dosing approach in children with solid tumors. Clin Cancer Res. 2003;9(2):633–640. [PubMed] [Google Scholar]
- 7.Inaba H, Stewart CF, Crews KR, et al. Combination of cladribine plus topotecan for recurrent or refractory pediatric acute myeloid leukemia. Cancer. 2010;116(1):98–105. [DOI] [PMC free article] [PubMed] [Google Scholar]
- 8.Brennan RC, Qaddoumi I, Mao S, et al. Ocular Salvage and Vision Preservation Using a Topotecan-Based Regimen for Advanced Intraocular Retinoblastoma. J Clin Oncol. 2017;35(1):72–77. [DOI] [PMC free article] [PubMed] [Google Scholar]
- 9.D’Argenio DZ, Schumitzky A. ADAPT II User’s Guide. USC, Los Angeles: Biomedical Simulations Resource; 1990. [Google Scholar]
- 10.Stewart CF, Iacono LC, Chintagumpala M, et al. Results of a phase II upfront window of pharmacokinetically guided topotecan in high-risk medulloblastoma and supratentorial primitive neuroectodermal tumor. J Clin Oncol. 2004;22(16):3357–3365. [DOI] [PubMed] [Google Scholar]
- 11.Pawlik C, Houghton P, Stewart C, Cheshire P, Richmond L, Danks M. Effective schedules of exposure of medulloblastoma and rhabdomyosarcoma xenografts to topotecan correlate with in vitro assays. Clinical Cancer Research. 1998;4(8):1995–2002. [PubMed] [Google Scholar]
- 12.Panetta J, Iacono L, Adamson P, Stewart C. The importance of pharmacokinetic limited sampling models for childhood cancer drug development. Clinical Cancer Research. 2003;9(14):5068–5077. [PubMed] [Google Scholar]
- 13.Schaiquevich P, Panetta JC, Iacono LC, et al. Population pharmacokinetic analysis of topotecan in pediatric cancer patients. Clin Cancer Res. 2007;13(22 Pt 1):6703–6711. [DOI] [PubMed] [Google Scholar]
- 14.Pauley JL, Panetta JC, Crews KR, et al. Between-course targeting of methotrexate exposure using pharmacokinetically guided dosage adjustments. Cancer Chemother Pharmacol. 2013;72(2):369–378. [DOI] [PMC free article] [PubMed] [Google Scholar]
- 15.Metzger ML, Stewart CF, Freeman BB III, et al. Topotecan is active against Wilms’ tumor: results of a multi-institutional phase II study. J Clin Oncol. 2007;25(21):3130–3136. [DOI] [PubMed] [Google Scholar]
- 16.Hubbard KE, Schaiquevich P, Bai F, et al. Application of a highly specific and sensitive fluorescent HPLC method for topotecan lactone in whole blood. Biomed Chromatogr. 2009;23(7):707–713. [DOI] [PMC free article] [PubMed] [Google Scholar]
Associated Data
This section collects any data citations, data availability statements, or supplementary materials included in this article.


