

SUMMARY
The most common genetic cause of amyotrophic lateral sclerosis (ALS) and frontotemporal dementia (FTD) is an expanded G4C2 repeat [(G4C2)exp] in C9ORF72. ALS/FTD-associated toxicity has been traced to the RNA transcribed from the repeat expansion [r(G4C2)exp], which sequesters RNA-binding proteins (RBPs) and undergoes repeat associated non-ATG (RAN) translation to generate toxic dipeptide repeats. Using in vitro and cell-based assays, we identified a small molecule (4) that selectively bound r(G4C2)exp, prevented sequestration of an RBP, and inhibited RAN translation. Indeed, biophysical characterization showed that 4 selectively bound the hairpin form of r(G4C2)exp, and NMR spectroscopy studies and molecular dynamics simulations defined this molecular recognition event. Cellular imaging revealed that 4 localized to r(G4C2)exp cytoplasmic foci, the putative sites of RAN translation. Collectively, these studies highlight that the hairpin structure of r(G4C2)exp is a therapeutically relevant target and small molecules that bind it can ameliorate c9ALS/FTD-associated toxicity.
Graphical Abstract
eTOC Blurb
The most common cause of ALS is an expanded RNA repeat [r(G4C2)exp] that folds into two forms in vitro, a G-quadruplex and a hairpin. Wang et al. show that the hairpin form is present in cells, undergoes aberrant translation that causes toxicity, and thus is a target for therapeutic development.
INTRODUCTION
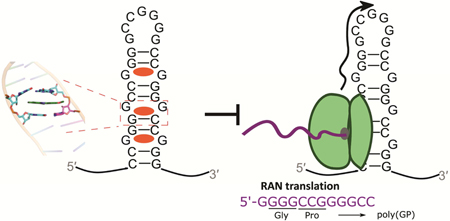
Amyotrophic lateral sclerosis (ALS), a devastating neurodegenerative disorder caused by progressive loss of motor neurons, often results in paralysis and death within three to five years of onset (Taylor et al., 2016). Current treatment options for ALS are scarce and only palliative (Taylor et al., 2016). With the discovery that an expanded, transcribed G4C2 repeat in C9ORF72 is the most common genetic cause of ALS and frontotemporal dementia (FTD) [heretofore “c9ALS/FTD”], a new therapeutic target has emerged (DeJesus-Hernandez et al., 2011; Renton et al., 2011). The transcribed repeat RNA [r(G4C2)exp] is involved in two putative pathological mechanisms: (i) sequestering proteins involved in RNA biogenesis to form toxic r(G4C2)exp-protein foci (Prudencio et al., 2015); and (ii) undergoing repeat associated non-ATG (RAN) translation to produce toxic c9RAN dipeptide repeats (DPRs) in cellular (Almeida et al., 2013; Taylor et al., 2016; Zu et al., 2013), mouse (Chew et al., 2015; O’Rourke et al., 2015), and Drosophila (Mizielinska et al., 2014) models (Figure 1A).
Figure 1: Screening compounds for binding to r(G4C2)8 by displacement of 1a-TOQ and for inhibiting RAN translation.
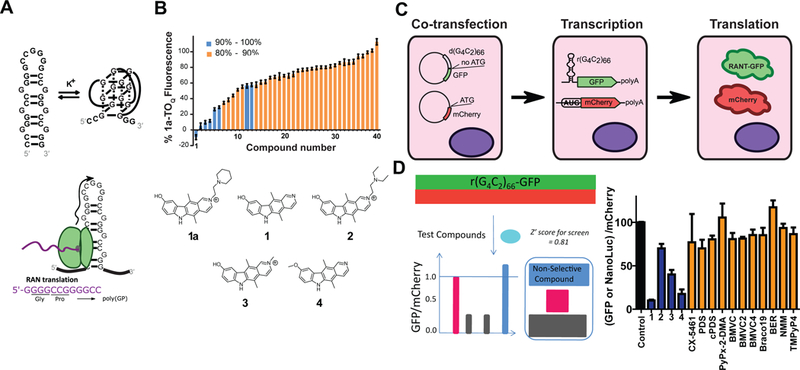
A, Schematics of the equilibrium between the hairpin and the G-quadruplex forms of r(G4C2)exp (top) and RAN translation producing poly(GP) (bottom). B, Screening results as measured via displacement of 1a-TOQ (compound structures providied in Data S1) (top). Compounds with >90% similarity to 1a are indicated with blue bars. Data represent mean values ± SEM of three independent measurements. Chemical structures of 1a and 1–4 (bottom). C, Schematic of a cell-based screen to monitor RAN translation of r(G4C2)exp. D, The cell-based assay can distinguish between selective and non-selective inhibitors of RAN translation by monitoring changes in fluorescence derived from r(G4C2)66-No ATG-GFP (RAN) and mCherry (canonical translation). E, Inhibitory effect of compounds (10 μM) on RAN translation. Note: (i) concentrations of 2 and 3 were 25 μM; (ii) concentration of CX-5461 was 5 μM due to cytotoxicity. BMVC and BMVC2 were studied with the NanoLuc reporter due interference with GFP signal. Error bars are SD.
Current efforts towards developing c9ALS/FTD therapeutics include both antisense oligonucleotides (ASOs) and small molecules that target r(G4C2)exp. Indeed, an ASO directed at C9ORF72 mRNA improved ALS-associated defects in mouse models (Gendron et al., 2017; Jiang et al., 2016). Small molecules, however, could be a viable alternative, owing to their favorable pharmacological properties amenable to traditional drug development (Su et al., 2014; Yang et al., 2015). As the repeat lies in an intron (DeJesus-Hernandez et al., 2011; Renton et al., 2011), small molecule binding could be advantageous in that it may not affect overall protein expression of C9ORF72, which currently has an unknown function (Yang et al., 2015). Previously, we discovered that the small molecule 1a binds r(G4C2)exp and inhibits RAN translation and foci formation in both cultured cells and induced neurons, demonstrating the power of small molecules to favorably modulate RNA toxicity (Su et al., 2014).
Interestingly, r(G4C2)exp exists in an equilibrium between two folded states, a hairpin and G-quadruplex (Figure 1A) (Su et al., 2014; Taylor, 2014). This equilibrium may be perturbed by temperature or by the presence of K+ required for G-quadruplex folding (Lane et al., 2008). Often the G-quadruplex is presumed to be the therapeutically relevant structure (Conlon et al., 2016; Fay et al., 2017), as supported by a few studies that showed favorable biological effects with known G-quadruplex-targeting ligands (Simone et al., 2018; Zamiri et al., 2014). In contrast, 1a binds the hairpin structure of r(G4C2)exp and improves c9ALS/FTD-associated defects in iNeurons (Su et al., 2014). Thus, targeting the G-quadruplex or hairpin structure could both be important for the development of c9ALS/FTD therapeutics.
Thus, we sought to identify more potent inhibitors of r(G4C2)exp toxicity than 1a, compare the activity of hairpin-binding small molecules to known G-quadruplex ligands, and study which fold(s) is therapeutically relevant. Indeed, we found several compounds that inhibited RAN translation better than known G-quadruplex ligands and the ASO Vivo-Morpholino™, mo(G2C4)4. The most potent compound, 4, inhibited two pathomechamisms of c9ALS-FTD, sequestration of RNA-binding proteins (RBPs) and generation of toxic dipeptide repeats via RAN translation. NMR spectroscopy studies and molecular dynamics simulations showed that 4 bound the 1×1 nucleotide GG internal loop in the hairpin structure of r(G4C2)exp. An in vitro translation assay and cellular imaging further support that the hairpin structure of r(G4C2)exp is RAN translated and a biologically relevant structure for the development of c9ALS/FTD therapeutics.
RESULTS
A dye displacement assay identifies small molecules that bind more tightly to r(G4C2)exp than 1a.
To identify more potent inhibitors of r(G4C2)exp than 1a (Su et al., 2014), we employed a chemical similarity search based on our lead compound (Data S1). The search yielded a cohort of small molecules (n = 40) exhibiting at least 80% chemical similarity to 1a with varying charge, structure, and side chains (Data S1). The ability of these 1a-like small molecules to bind r(G4C2)exp in vitro was measured via a dye displacement assay. Combining 1a with TO-PRO-1, a well-known fluorescent RNA intercalator [1a-TOQ (STAR Methods and Data S2], yielded an excellent fluorescent reporter of r(G4C2)exp binding, as evidenced by the 3-fold enhancement of emission signal upon titration of r(G4C2)8. Fitting the change in emission of 1a-TOQ as a function of r(G4C2)8 concentration afforded a Kd of 110 ± 14 nM (Data S1). To validate the assay, we competed off the increase in 1a-TOQ’s fluorescence observed upon binding r(G4C2)8 with 1a, which afforded a dose response as expected. Using 1a, we calculated the Z-factor of this assay, which is equal to 0.88 and thus considered suitable for high-throughput screening (Zhang et al., 1999).
Using the 1a-TOQ displacement assay, we identified ten 1a-like compounds that displaced >50% of 1a-TOQ from r(G4C2)8 (Figure 1B). Generally, compounds with >90% similarity to 1a were the most potent (blue bars; Figure 1B). Several trends were observed to elucidate chemical features that drive binding to r(G4C2)8. Compounds 2, 3, 5, and 12 have positive charges via N-alkylation of the pyridine ring and exhibited potent binding, yet 1 and 4 also demonstrated similar binding affinities despite being uncharged. This suggests that positive charges contribute favorably but are not essential to molecular recognition between the small molecule probe and r(G4C2)exp. Dose-dependent binding assays demonstrated that the best performing compounds (1 – 4, Figure 1B) are more potent than 1a with IC50 values ranging from 0.9 to 8.5 μM (Table 1).
Table 1.
IC50 values for the displacement of 1a-TOQ and for the inhibition of r(G4C2)66-mediated RAN translation.
| Compound | Displacement of 1a-TOQ IC50 (μM) |
Inhibition of RAN Translation IC50 (μM) |
|---|---|---|
| 1a | 2.6 ± 1.0 | 11 ± 1.0 |
| 1 | 1.3 ± 0.5 | 0.27 ± 0.05 |
| 2 | 1.4 ± 0.4 | >25 |
| 3 | 0.9 ± 0.2 | 12 ± 2.0 |
| 4 | 8.5 ± 2.0 | 1.6 ± 0.20 |
| mo(G2C4)4 | - | 7.6 ± 1.0 |
1a-like small molecules inhibit RAN translation in a cellular reporter assay.
To assess the bioactivity of r(G4C2)exp-bincling compounds, we developed a cell-based screen to monitor selective inhibition of RAN translation of r(G4C2)exp (Figure 1C and 1D). Briefly, (G4C2)exp was inserted into the 5′ untranslated region (UTR) of GFP lacking a canonical ATG start codon, akin to a construct previously reported to study RAN translation of r(CGG)exp (Yang et al., 2015). Western blot analysis confirmed that the product generated from this “(G4C2)66-No ATG-GFP” construct is a RAN DPR-GFP fusion, with no detectable amounts of the canonically translated GFP product (Figure S1A).
To assess whether a small molecule selectively inhibits RAN translation, cells were co-transfected with (G4C2)66-No ATG-GFP and a plasmid encoding containing mCherry (ATG-mCherry). Thus, two fluorescent signals could be produced, where GFP fluorescence indicates RAN translation and mCherry fluorescence is a metric of canonical translation. By measuring the relative fluorescence of both proteins, the assay can distinguish whether a small molecule globally affects protein translation non-selectively (both GFP and mCherry are affected), selectively affects canonical translation (only mCherry is affected), or selectively inhibits RAN translation (only GFP is affected) (Figure 1C and 1D). The r(G4C2)exp RAN translation assay has an excellent Z-factor of 0.81, as measured using compound 1a, and is therefore suitable for cell-based high throughput screening.
The most promising compounds (1 – 4) from the 1a-TOQ displacement screen inhibited RAN translation with IC50 values ranging from 0.27 to 12 μM (blue bars in Figure 1E and Table 1). In fact, 1 and 4 are more potent than 1a with IC50 values of 0.27, 1.6, and 11 μM, respectively (Table 1). Both 1 and 4 were better inhibitors of r(G4C2)exp RAN translation than the oligonucleotide Vivo-Morpholino™, mo(G2C4)4, which had an IC50 of 7.6 μM (p<0.001) (Table 1). Thus, small molecules that target structured RNAs can more potently modulate biological activity than oligonucleotides. This phenomenon is likely due to the kinetic issues of oligonucleotides binding to structured RNA targets, which can be further confounded, in this case, by the oligonucleotide’s self-structure (Tran et al., 2014).
To ensure that the relative decrease in the GFP to mCherry signal occurred as a result of inhibition of RAN translation, a counterscreen for 1 – 4 was completed with ATG-GFP (canonical GFP translation) and ATG-mCherry (also canonical translation). As shown in Figure S1B and S1C, 2 – 4 did not significantly affect GFP signal from the ATG-GFP construct relative to the mCherry signal while 1 induced a roughly 20% decrease in the GFP signal at 2.5 μM. Therefore, 2 – 4 are selective RAN translation inhibitors while 1 has some associated non-specific effects. As 4 was the best selective inhibitor of RAN translation in this cell-based assay, it was studied further.
Compound 4 exhibits excellent affinity and selectivity for binding GG internal loops in the hairpin form of r(G4C2)exp.
We next investigated the affinity and selectivity of 4 binding to various DNA and RNA targets by using biolayer interferometry (BLI). Compound 4 bound the desired target, r(G4C2)8, with a Kd of 0.26 μM while weakly binding the antisense RNA [r(G2C4)8] and a fully base paired RNA [r(G2C2)8] (Table 2). In particular, 4 bound r(G4C2)8 ~300-fold more tightly than to the antisense r(G2C4)8 (Kd = 80 μM) and ~540-fold more tightly than to the r(G2C2)8 (Kd = 1400 μM). Repeat length [r(G4C2)n where n = 2, 4, and 6] did not affect 4’s binding affinity (Table S2). The selectivity of 4 binding was studied further with a well-known RNA G-quadruplex called TERRA, r(UAGGG(UUAGGG)3). Although 4 did bind TERRA with a Kd of 8.6 μM, 4 bound 33-fold more tightly to r(G4C2)8 (Table 2). With respect to interactions with DNA, 4 binds to d(G4C2)8 with a Kd of 0.31 μM, however, 4 does not affect (G4C2)66-No ATG-GFP RNA transcript levels as assessed by RT-qPCR (Figure S1D), suggesting that binding interactions between 4 and G4C2 DNA did not affect transcription and are therefore not biologically relevant.
Table 2.
Binding parameters of 4 and r(G4C2)8, d(G4C2)8, r(G2C4)8 (antisense repeat), r((G2C2)4AAAA(G2C2)4) (GC paired), r(UGGGCC)8, and r(UAGGG(UUAGGG))3 (TERRA) by biolayer interferometry.a
| RNA |
Kd,1 (M) |
kon,1 (1/M×s) |
koff,1 (1/s) |
Selectivity for r(G4C2)8 (fold) |
Kd,2 (M) |
kon,2 (1/M×s) |
koff,2 (1/s) |
|---|---|---|---|---|---|---|---|
| r(G4C2)8 | 2.6(±0.3)×10−7 | 2.3(±0.3)×104 | 6.0(±0.1)×10−3 | - | 1.4(±0.1)×10−6 | 4.0(±0.2)×104 | 5.6(±0.3)×10−2 |
| d(G4C2)8 | 3.1(±0.1)×10−7 | 2.6(±0.1)×104 | 8.0(±0.2)×10−3 | 1.2 | 4.0(±1.2)×10−6 | 2.0(±0.6)×104 | 8.0(±0.2)×10−2 |
| r(G2C4)8 (antisense) | 7.9(±5.9)×10−5 | 1.2(±0.9)×103 | 9.5(±0.3)×10−2 | 304 | n/a | n/a | n/a |
| r((G2C2)4AAAA(G2C2)4) (GC paired) |
1.4(±0.9)×10−4 | 1.5(±0.9)×103 | 2.1(±0.8)×10−1 | 538 | n/a | n/a | n/a |
| r(UG3C2)8 | 2.2(±0.9)×10−4 | 1.9(±0.8)×102 | 4.0(±0.2)×10−2 | 847 | n/a | n/a | n/a |
| r(UAG3(U2AG3))3 | 8.6(±0.2)×10−6 | 3.2(±0.1)×103 | 2.6(±0.1)×10−2 | 33 | n/a | n/a | n/a |
kon and koff values were generated by fitting the obtained data using ForteBio’s Data Analysis 7.1 software to 1:1 or 2:1 (heterogeneous) binding equation using entire time range unless specified. Values shown for kon and koff are representative of two independent measurements and the errors are the standard deviation.
Compound 4 is selective for 1×1 nucleotide GG loops over other nucleic acids in vitro and in cells.
We previously found that r(UG3C2)exp produces toxic DPRs via RAN translation, the genetic cause of spinocerebellar ataxia disease type 36 (SCA36) (Liu et al., 2014; Matsuzono et al., 2017; Obayashi et al., 2015). Similar to r(G4C2)exp, r(UG3C2)exp forms a hairpin structure with a GU internal loop stabilized by hydrogen bonding (Figure S2A). Therefore, r(UG3C2)exp serves as an excellent comparison to determine whether 4 binds the 1×1 nucleotide GG internal loop in r(G4C2)exp selectively. Binding studies revealed that 4 had an ≈1000-fold lower affinity for binding r(UG3C2)8 than r(G4C2)8 (Table 2); binding of 4 to r(UG3C2)8 was also not detectable by NMR spectroscopy (Figure S2C). Not surprisingly, 4 is unable to inhibit RAN translation of r(UG3C2)62 in transfected cells (Figure S2B).
NMR spectroscopy and molecular dynamics simulations reveal features of the molecular recognition of r(G4C2)exp by 4.
We next characterized the binding of 4 to r(G4C2) repeats using imino proton NMR and CD spectroscopies. NMR characterization of 4 binding to r(G4C2)4 and to r(G4C2)8 showed a new peak appearing at ~10.5 ppm in the absence of K+ ions, resulting from 4 stabilizing the interactions between the 1×1 nucleotide GG internal loop (Figure 2A and Figure S3A). As the imino proton signal for G-quadruplex is nearby that of hydrogen-bonded GG loops, we studied the binding of 4 to r(G4C2)2, which cannot form a G-quadruplex. Indeed, the same imino proton signal corresponding to the GG loop for r(G4C2)4 and r(G4C2)8 was observed (Figure S4). Further, 4 prevents conversion of the hairipin to the G-quadruplex (Figure S4). As the concentration of 4 increased, pronounced peak shifts of the GC base pair imino protons at 13.3 ppm and 12.5 ppm were observed. By plotting the change in the NMR signals as a function of [4]:[RNA], binding stoichiometry can be determined. As shown in Figure S3A, 4 binds to r(G4C2)4 with a stoichiometric ratio of 4:1 compound:RNA and to r(G4C2)8 with a stoichiometric ratio of 6:1.
Figure 2: The CD and NMR analysis of 4 binding to the 1×1 nucleotide GG internal loops.
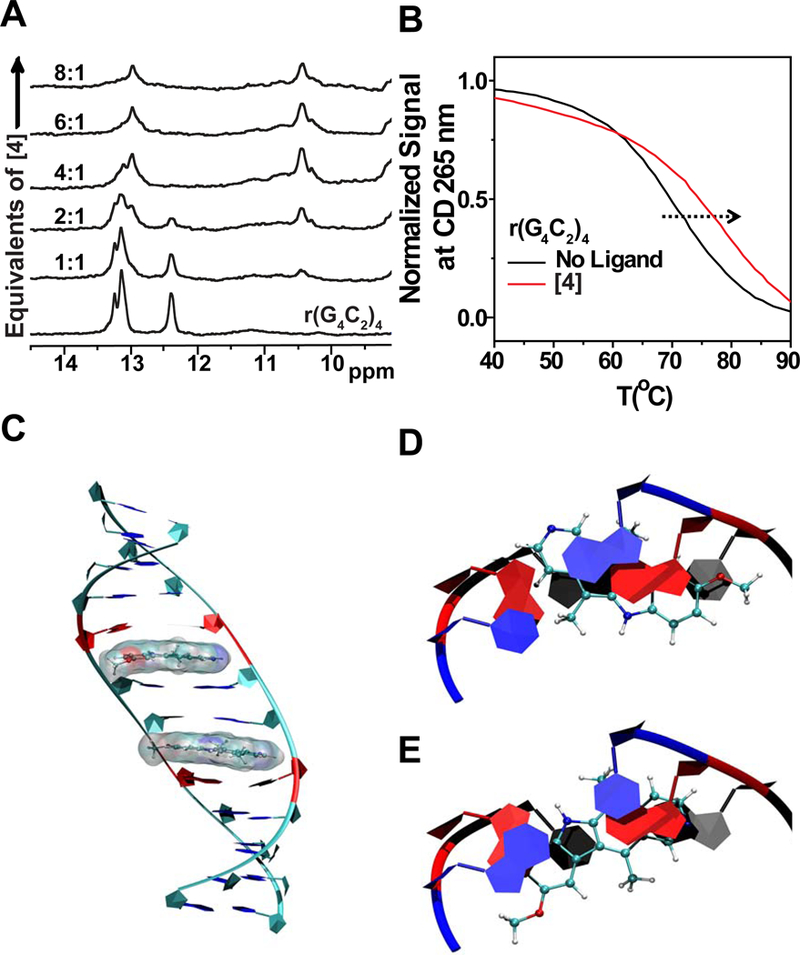
A, Imino proton NMR spectra of r(G4C2)4 with increasing amounts of 4. A new peak appears at ~10.5 ppm upon addition of 4, consistent with 4 binding and stabilizing the GG pair’s hydrogen bonds. B, CD melting of r(G4C2)4 in the presence and absence of 4. C, Two molecules of 4 interacting with a model r(G4C2)exp having two unique 1×1 GG internal loop motifs (CGG and GGC) with syn-anti orientations. D, Top views of 4 interacting with 5’-CGG/5’-CGG. E, 5’-GGC/5’-GGC as displayed on the left. Blue, red, and black colored residues represent the first, second, and third base-pairs from top, respectively.
NOESY analysis revealed NOEs between 4 and the 1×1 nucleotide GG internal loops and adjacent GC pairs (Figure S3B). CD spectroscopy confirmed that 4 stabilizes the hairpin structure as evidenced by the increase in TM from 71 °C to 78 °C after the addition of 4 (Figure 2B). These studies also revealed that 4 has two binding modes, as evidenced by the two signals at 300 nm and 330 nm (Figure S3C). Fitting the resulting data from CD studies to a Hill equation indicate that binding of 4 is cooperative (Figure S3C). Collectively, these studies suggest that 4 binds between 1×1 nucleotide GG internal loops and GC pairs, stabilizing hydrogen bonding within the loop.
To confirm these results, a duplex model that contains three unique 1×1 nucleotide GG internal loops distinguishable by NMR spectroscopy was employed. By site specifically methylating the 1 position of each G in a 1×1 nucleotide GG internal loop, we were able to assign which G residues were acting as hydrogen bond donors and acceptors in its interaction with 4 (see Supplementary Note for details). This analysis revealed: (i) 4 stabilizes hydrogen bonding between the 1×1 nucleotide GG internal loop; (ii) the 1×1 nucleotide GG internal loop hydrogen bond in a syn-anti orientation; and (iii) several NOEs between 4 and the imino protons of the guanine in the 1×1 nucleotide GG internal loop were observed.
To provide additional insight into the molecular recognition of 4 and r(G4C2) repeats, we used molecular dynamics (MD) calculations (see Supporting Information). The lowest binding free energy state from these studies showed 4 stacked between the 1×1 nucleotide GG internal loop and the closing GC base pairs, stabilized by π-π interaction between 4 and loop residues (Figure 2C). Hydrogen bonding between 1×1 nucleotide GG internal loops in the absence of compound were observed in the imino proton NMR spectrum at low temperature (283K) (Figure S3D) but not at room temperature. The observation that hydrogen bonding within the GG loop in the presence of 4 was observable at room temperature provides additional support that 4 stabilizes the RNA’s structure.
G-quadruplex ligands bind r(G4C2)exp but do not inhibit RAN translation.
Collectively, the studies described above suggest that 4’s cellular mode of action is binding to r(G4C2)exp in its hairpin form and blocking RAN translation by stabilization of the RNA’s structure. However, various reports have suggested that the therapeutically relevant fold of r(G4C2)exp is a G-quadruplex (Figure 1A) (Biffi et al., 2014; Burger et al., 2005; Franceschin et al., 2006; Hershman et al., 2008; Huang et al., 2008; Rodriguez et al., 2012; Rzuczek et al., 2010; Siddiqui-Jain et al., 2002; Wang et al., 2014; Xu et al., 2017). We therefore compared the biological activity of 11 well-known G-quadruplex ligands (Data S1) to 4 using our cell-based RAN translation assay (Figure 1C and 1D). [Note: BMVC and BMVC2 were tested using a (G4C2)66-No ATG-NanoLuc construct because they interfere with the fluorescent signal of GFP; 4 was also tested using this system, affording the same IC50 as it did for (G4C2)66-No ATG-GFP (Figure S1E).] Interestingly, the G-quadruplex ligands were poor inhibitors of RAN translation, significantly worse than 4 (Figure 1E). The poor inhibitory effect was not due to lack of affinity, as determined by BLI as the G-quadruplex ligands demonstrated excellent binding to the quadruplex form of r(G4C2)4, induced by addition of K+ (Table S1). TMPyP4 (Kd = 50 nM) and PDS (Kd = 70 nM) compounds bound more tightly to the quadruplex form than 4 bound to the hairpin (Kd = 260 nM) (Tables 2 and S1). [Note: binding of G-quadruplex ligands to the G-quadruplex form was confirmed by NMR spectroscopy (Figure S5).] Thus, inhibiting RAN translation is not simply a function of binding affinity, rather the affinity for a particular structural form and its presence within a cell.
The hairpin is a biologically relevant target for small molecule modulation of r(G4C2)exp biology.
The studies above suggest that the hairpin fold is therapeutically relevant for inhibiting r(G4C2)exp pathobiology, particularly RAN translation. To gain further insight into the structural form adopted r(G4C2)exp by in cells, we conducted both in vitro and cell-based experiments. Although both hairpin and G-quadruplex forms are thermodynamically stable, we were interested studying the kinetically favored form. Imino proton spectra show that upon addition of K+, hairpin signals decrease and the G-quadruplex signals increase (Figure 3A). A three-state kinetic model was employed to extrapolate the unfolding rate of the hairpin into the G-quadruplex structure via an unfolded intermediate (Figure 3A and STAR Methods Equation 3; please see Supplementary Note for further details).
Figure 3: Kinetic and thermodynamic study reveals the hairpin structure is major population in rG4C2exp and also forms in cells.
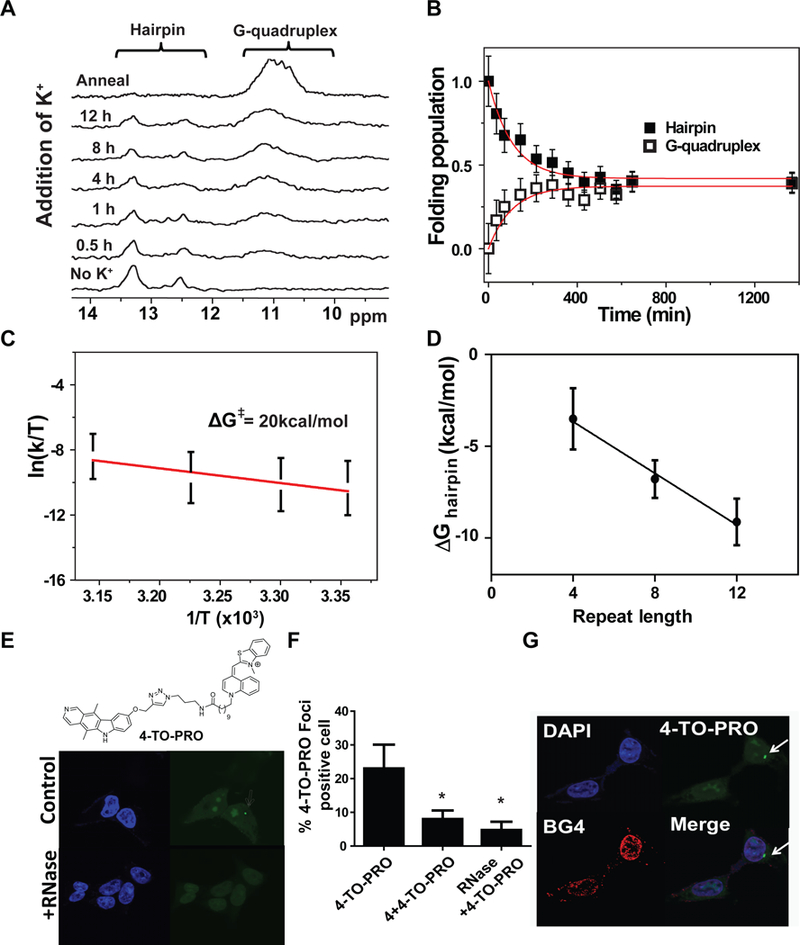
A left, Time-resolved imino proton spectra of r(G4C2)4 was recorded in Li+-only buffer first, then at 0.5, 1, 4, 8, and 12 h post addition of K+ (37 °C), and finally after annealing at 95 °C in K +. A right, Kinetic trace analysis of r(G4C2)4 as monitored by the imino proton NMR signal of hairpin (solid square) or G-quadruplex region (open square) after addition of K+ at 37 °C. The red line shows the fit to a three-state kinetic model. B left, Activation free energy of r(G4C2)4 transition from hairpin structure to unfolded state by Eyring plot of k1. B right, Folding free energy of hairpin structure (ΔG°Hairpin) as a function of r(G4C2)n repeat length (n = 4–12), as measured by CD melting temperature. C, Chemical structure of 4-TO-PRO, and representative images of 4-TO-PRO-treated (G4C2,)66-transfected cells and their quantification of foci-positive cells treated with 4-TO-PRO only (n = 112 cells; 3 biological replicates), pre-treated with 4 and then stained with 4-TO-PRO (n = 100 cells; 3 biological replicates), or treated with RNase and then stained with 4-TO-PRO (n = 142 cells; 3 biological replicates). D, Representative images of cells treated first with BG4 and then 4-TO-PRO. Scale bar = 5 μm in both images. * indicates p < 0.05 as determined by a two-tailed Student t-test.
The unfolding rate of hairpin structure (k1) increased with temperature (Kuo et al., 2015), while the folding rate of G-quadruplex (k3) was temperature-independent (Figure S6A and S6B), consistent with previous G-quadruplex folding studies (Gray and Chaires, 2008; Zhang and Balasubramanian, 2012). These data indicated that a transition state energy is required for hairpin structure unfolding while there is no substantial barrier for G-quadruplex folding. Using these temperature dependent measurements (Figure S6A), a sizable transition state energy, ΔG‡ = 20 kcal/mol, was calculated, suggesting that a substantial kinetic barrier exists between the hairpin and unfolded states for r(G4C2)exp; the formation of the G-quadruplex is evidently limited by this kinetic barrier (Figure 3B) (Kuo et al., 2015).
Computational analysis predicted that the stability of the hairpin increases as repeat length increases (Figure S6C) (Ash et al., 2013). A series of CD measurements confirmed this prediction, as increasing the number of repeats from 4 to 8 to 12 lowered the observed free energy (Figure 3B). The unfolding time (272 to 407 mins) and the population (0.4 to 0.6) (Figure S7D and S7E) in the hairpin form increases from 4 to 12 repeats, indicating that the hairpin structure has a higher folding population than the G-quadruplex and suggesting that hairpin form is the kinetically favored fold.
We next conducted an in vitro translation assay to determine whether the hairpin or G-quadruplex form undergoes RAN translation by using (G4C2)66-No ATG-NanoLuc and luciferase signal as a readout. The construct was used to transcribe r(G4C2)66-No ATG-NanoLuc, which was subsequently folded into a G-quadruplex or hairpin form, as informed by NMR spectroscopy studies. Significant luciferase signal was only observed from r(G4C2)66-No ATG-NanoLuc folded into the hairpin form and not the G-quadruplex form (~3.5-fold difference compared to both the G-quadruplex template and a reaction lacking an RNA template; p<0.001) (Figure S2D).
Our in vitro studies suggest that hairpin fold of r(G4C2)exp predominates from a kinetic standpoint and is a main contributor of pathobiology, at least in terms of RAN translation. To confirm these findings in cells, we used 4 to develop a r(G4C2)exp hairpin imaging agent. Briefly, 4 was conjugated with the well-known RNA binding dye TO-PRO-1, and this hybrid molecule is dubbed 4-TO-PRO (Figure 3C). (G4C2)66-transfected cells were incubated with 4-TO-PRO, revealing strong fluorescent spots in the cytoplasm as determined by fluorescence microscopy (Figure 3C). In contrast, these punctate spots were not visible using TO-PRO-1 alone (Figure S7A). Pre-treating the cells with 4 or RNase significantly reduced these fluorescent spots (Figure 3C and 3D), which suggests that 4 localized to these spots enriched with RNA. According to a previous study by Donnelly et al., these cytoplasmic spots are the putative sites of RAN translation (Donnelly et al., 2013). Therefore, the observed fluorescent signal from 4-TO-PRO was most likely due to binding of cytoplasmic r(G4C2)exp in the hairpin form.
To ascertain whether 4-TO-PRO bound the hairpin or G-quadruplex form of cytoplasmic r(G4C2)exp, the G-quadruplex-specific antibody BG4 was employed (Biffi et al., 2014; STAR Methods). If 4 targets the hairpin form of r(G4C2)exp in cells as expected, then BG4 should not co-localize with 4-TO-PRO; co-localization of BG4 and 4-TO-PRO would indicate that 4 binds to the G-quadruplex form in cells. BG4 was added to the cells first followed by addition of 4-TO-PRO to avoid disrupting BG4 binding. Indeed, BG4 signal did not colocalize with 4-TO-PRO (Figure 3D), providing evidence that 4 binds the hairpin form of cellular r(G4C2)exp and that the hairpin fold of r(G4C2)exp occurs in cells.
Investigating compound mode of action: 4 blocks polysome assembly on r(G4C2)exp.
We next studied 4’s mode of action, which could occur by: (i) transcriptional silencing, (ii) compound-induced cleavage of the mRNA, (iii) blocking ribosomal binding, and/or (iv) preventing ribosomal read-through (stalling). No change in the steady state levels of r(G4C2)exp-containing transcript was observed, as determined by RT-qPCR (Figure S1D); thus 4 does not appear to silence transcription of the mRNA or induce its cleavage.
Polysome profiling studies were then employed to determine whether 4 inhibits ribosome binding or induces stalling. Treatment of HEK293T cells expressing (G4C2)66-No ATG-GFP with 4 reduced the amount of transcript loaded into high molecular weight (HMW) polysomes by 28 percent (p-value < 0.001), low molecular weight (LMW) polysomes by 18% (p-value < 0.01), and monosome-containing fractions by 12% (p-value < 0.05) (Figure 4A and 4B). These results indicate that 4 acts as a steric block that hinders polysome assembly on r(G4C2)exp, thus decreasing levels of toxic DPRs. Previous studies have found that small molecules targeting r(CGG)exp similarly block loading of the corresponding mRNA onto polysomes and inhibit RAN translation (Yang et al., 2015).
Figure 4: Polysome profiling experiments elucidate mode of 4’s inhibition of RAN translation.
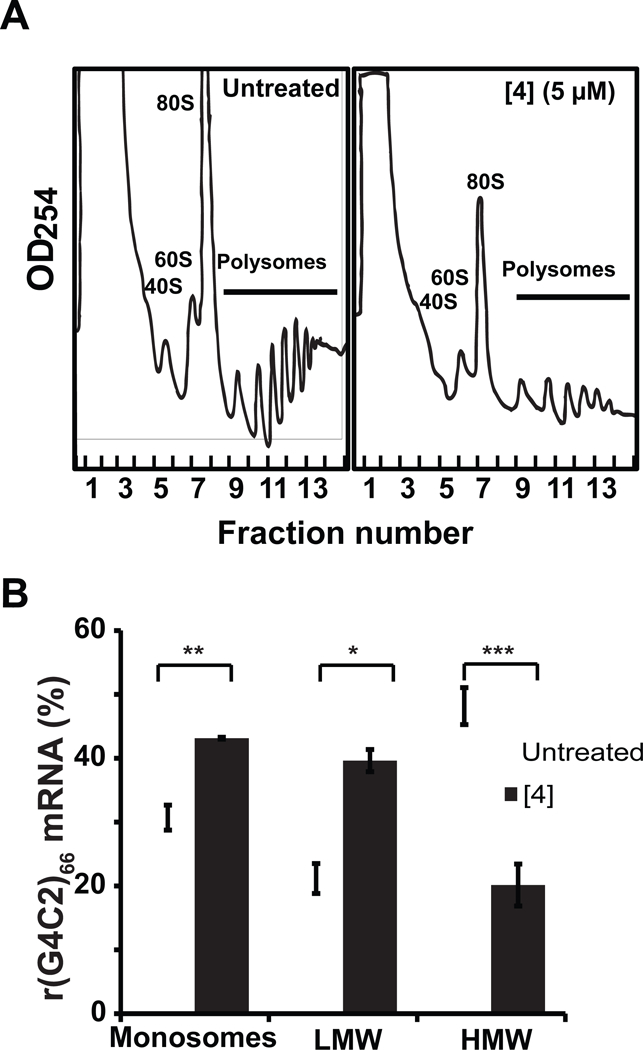
A, Polysome fractionation profiles of cell lysates obtained from HEK293T cells transfected with (G4C2)66-No ATG-GFP plasmid upon treatment with 4 or vehicle (DMSO). Polysome fractionation profiles are representative of two independent experiments. B, Percentage of (G4C2)66-No ATG-GFP mRNA transcript present within monosome and polysome-containing fractions with (white) and without (black) treatment of 4. Fractions labeled as “Monosomes” contain 40S, 60S and 80S ribosomal subunits; “LMW” indicates low molecular weight polysomes; and “HMW” indicates high molecular weight polysomes. *, p < 0.05; **, p < 0.01; *** p <0.001, as determined by a two-tailed Student t test.
Investigating compound mode of action: 4 blocks formation of toxic r(G4C2)exp-RBP complexes.
Another pathomechanism of r(G4C2)exp is sequestration of RBPs. As 4 effectively blocks ribosomal binding, we hypothesized that 4 could also block RBPs from binding r(G4C2)exp, which accumulate in nuclear foci (Mizielinska and Isaacs, 2014). A key protein that binds r(G4C2)exp and colocalizes with r(G4C2)exp foci is heterogeneous nuclear ribonucleoprotein H (hnRNP H) (Prudencio et al., 2015) (Lee et al., 2013). We measured the affinity of hnRNP H for r(G4C2)8 using a gel shift assay, yielding a Kd of 65 ± 26 nM (Figure S7B). Therefore, we developed an in vitro assay around this complex to assess whether compound binding to r(G4C2)exp inhibits RNA-protein complex formation.
The hnRNP H displacement assay was based on a previously developed time-resolved fluorescence resonance energy transfer (TR-FRET) assay used to study whether small molecules inhibited the binding of muscleblind-like 1 protein (MBNL1) to r(CUG)exp (Figure 5A) (Chen et al., 2012). In our assay, biotinylated r(G4C2)8 forms a complex with hnRNP H-His6. A FRET signal is produced when streptavidin-XL665 binds the biotinylated RNA and Tb-Anti-His6 binds to hnRNP H. Small molecules that bind r(G4C2)8 and inhibit the formation of the r(G4C2)8-hnRNP H complex reduce the FRET signal. In this assay, 4 inhibited hnRNP H binding with an IC50 of 19 μM (Figure 5A).
Figure 5: 4 inhibits binding of hnRNP H in vitro and in HEK293T cells expressing (G4C2)66-No ATG-GFP.
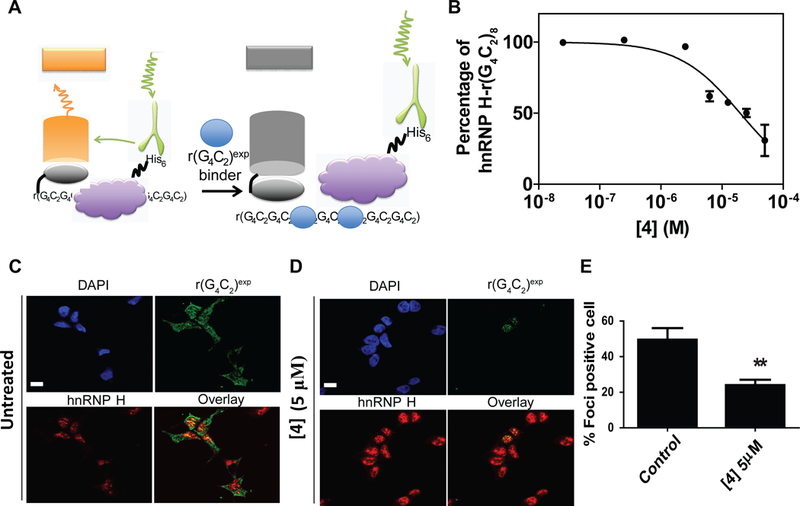
A, Schematic of the in vitro TR-FRET assay used to monitor small molecule inhibition of the r(G4C2)8-hnRNP H complex and dose response curve for 4 B, representative images of RNA-FISH of r(G4C2)exp and immunostaining of hnRNP H in untreated and 4-treated cells and their quantification of foci-positive cells (n = 152; 3 biological replicates for untreated cells and n = 124; 3 biological replicates for 4-treated cells. ** indicates p <0.01 as determined by a two-tailed Student t test.
We next measured reduction of foci upon compound treatment in cells using RNA fluorescence in situ hybridization (FISH) and immunostaining of hnRNP H. As shown in Figure 5B, 4 inhibits foci formation in HEK293T cells expressing (G4C2)66-No ATG-GFP. Quantification confirmed that 4-treatment reduced the number of foci-positive cells and decreased the number of foci in foci-positive cells by 2-fold (p-value = 0.0029; Figure 5B). Thus, 4 inhibits two putative pathomechanisms of C9ALS/FTD - RAN translation and formation of r(G4C2)exp-protein complexes - while binding to the 1×1 nucleotide GG internal loop.
DISCUSSION
Advancing the development of c9ALS/FTD therapeutics depends on establishing whether the G-quadruplex and hairpin forms are therapeutically relevant structures of r(G4C2)exp. Driven by improving upon our previously reported small molecule 1a that ameliorated r(G4C2)exp toxicity in iNeurons by binding to the hairpin structure (Su et al., 2014), we sought to identify better small molecule modulators of r(G4C2)exp toxicity and to use the probes to study r(G4C2)exp structures adopted in cells. Indeed, we identified many compounds that bound to r(G4C2)exp and inhibited RAN translation better than our previously reported compound 1a. The most promising compound, 4, exhibits excellent selectivity and potency towards r(G4C2)exp.
Our biophysical studies indicated that 4 binds to the 1×1 nucleotide GG internal loop in the hairpin structure in r(G4C2)exp, inducing 1×1 nucleotide GG hydrogen bonding by reducing the dynamics of the 1×1 nucleotide GG internal loop. The 1×1 nucleotide GG internal loop in the hairpin is critical for molecular recognition and binding of 4 to the r(G4C2)exp. The π-π stacking interaction of 4 with the individual guanine bases in the 1×1 nucleotide GG loop and adjacent GC closing pair stabilizes the complex structure.
The binding of 4 to r(G4C2)exp prevents key RNA-protein interactions, thereby inhibiting two putative c9ALS/FTD pathomechanisms of r(G4C2)exp: RAN translation of r(G4C2)exp and formation of toxic RBP complexes. 4 inhibits RAN translation by acting as a steric block to prevent polysome assembly. In fact, 4 inhibited RAN translation more potently than the oligonucleotide mo(G2C4)4, demonstrating that small molecule probes are a viable alternative to oligonucleotides. While an ASO complementary to the RAN translation initiation site inhibited ribosomal scanning and, hence, RAN translation (Tabet et al., 2018), ASOs are most efficacious when targeting unstructured regions; thus RNA repeat expansions are not ideal targets. Various factors compound the challenges associated with oligonucleotide-based modalities that target r(G4C2)exp including: (i) the self-structure of oligonculeotides complementary to r(G4C2) repeats (Kovanda et al., 2015)], (ii) off-targets due to sequence-rather than structure-based recognition, and (iii) effects on both RAN and canonical ATG translation (Yang et al., 2015).
A previous report found that hnRNP H colocalized with the G-quadruplex antibody BG4 in c9ALS astrocytes and that the BG4 signal was higher in c9ALS cells than control cell lines (Conlon et al., 2016). A structural study, however, showed that the conserved qRRM domain of hnRNP F/H binds to RNA G-rich sequences and prevents formation of G-quadruplexes (Dominguez et al., 2010). Rather than preclude the formation of G-quadruplexes in r(G4C2)exp, our results indicate that the hairpin is a relevant target for developing c9ALS/FTD chemical probes, as evidenced by the ability of 4 to inhibit the two most prominent mechanisms of r(G4C2)exp pathology.
We compared the bioactivity of 4 to many G-quadruplex ligands, as G-quadruplexes were previously reported to be the target of small molecules (Fay et al., 2017; Haeusler et al., 2014; Simone et al., 2017; Taylor, 2014; Zamiri et al., 2014). These ligands did not effectively inhibit RAN translation despite binding with low nM affinity to the G-quadruplex form of r(G4C2)exp. An in vitro translation assay showed that only the hairpin form of r(G4C2)66 undergoes RAN translation, while the G-quadruplex does not (Figure S2D). Other studies have supported this finding: Rode et al. demonstrated that tRNA shifts the equilibrium between hairpin and G-quadruplex in mRNAs towards the hairpin and increases translational efficacy (Rode et al., 2016) while Guo et al. showed that RNA G-quadruplexes are globally unfolded in mammalian cells (Guo and Bartel, 2016).
Perhaps the most well studied G-quadruplex, in terms of both structure (Lim et al., 2009; Luu et al., 2006; Phan et al., 2007) and folding pathway (Ambrus et al., 2006; Gray and Chaires, 2008; Gray et al., 2014; Mashimo et al., 2008; Mashimo and Sugiyama, 2007), is the human telomere repeat sequence d(TTAGGG)n. Although the final fold is dependent upon cation concentration and the loop sequence, three major species predominate. Two small molecules have been discovered that bind a particular telomerase fold; N-methylmesoporphyrin IX that stabilizes a parallel topology (Sabharwal et al., 2014) and epiberberine that binds the hybrid-2 quadurplex (Lin et al., 2018). Interestingly, the epiberberine-hybrid-2 complex is different than most other small molecule-G-quadruplex complexes (Collie et al., 2015) and perturbs the equilibria between quadruplex forms, converting other structures into the hybrid-2.
Collectively, our studies demonstrate that the hairpin is a therapeutically relevant structure involved in the pathological mechanisms of c9ALS/FTD (Cammas and Millevoi, 2017; Simone et al., 2015). Although a recent study reported that a small molecule reduces r(G4C2)exp foci and inhibits RAN translation in iNeurons by targeting r(G4C2)exp G-quadruplexes, the study did not investigate whether the hairpin structure could be a target for the compound (Simone et al., 2017). G-quadruplex structures are still a potential target to inhibit translation (Bugaut and Balasubramanian, 2012; Endoh et al., 2013; Murat et al., 2014) based on their high thermostability and structural hierarchy.
STAR+ METHODS KEY RESOURCES TABLE
KEY RESOURCES TABLE
| REAGENT or RESOURCE | SOURCE | IDENTIFIER |
|---|---|---|
| Antibodies | ||
| anti-hnRNP H | Novus Biologicals | Cat#: NBP131648; RRID: 10003534 |
| anti-G-quadruplex, BG4 | Sigma-Aldrich | Cat#: MABE917 |
| Chemicals, Peptides, and Recombinant Proteins | ||
| 1–40 | NCI | N/A |
| TOQ | Carreon et al. Org. Lett. 2004, 6, 517 | N/A |
| 1a-amine | Su et al. Neuron 2014, 83, 1043 | N/A |
| 1a-TOQ | This study | N/A |
| i1-i8 | This study | N/A |
| 4-TO-PRO | This study | N/A |
| CHX (cycloheximide) | Sigma | Cat#: 104450 |
| TO-PRO-1 | ThermoFisher | Cat#: T3602 |
| TMPyP4 | FisherScientific | Cat#42–535-0 |
| PDS | Sigma | Cat#SML0678 |
| cPDS | Sigma | Cat#SML1176 |
| BER | Sigma | Cat#B3251 |
| Braco-19 | Sigma | Cat#SML0560 |
| CX-5461 | AdooQ Bioscience | Cat#A11065 |
| NMM | Frontier Scientific | Cat#NMM580 |
| PyPx-2-DMA | Rzuczek at al. J. Med. Chem. 2010, 53, 3632 | N/A |
| BMVC | Gift | Dr. Ta-Chau Chang (IAMS, Academia Sinica) |
| Critical Commercial Assays | ||
| In vitro transcription assay | Promega | Cat# P1320 |
| In vitro translation assay | Promega | Cat# L4540 |
| TR-FRET assay(StreptavidinXL665) | Cisbio | Cat# 610SAXLB |
| TR-FRET assay (MAb Anti6His-Tb-cryptate) | Cisbio | Cat# 61HISTLB |
| Experimental Models: Cell Lines | ||
| HEK293T | ATCC | https://www.atcc.org/Products/All/CRL-3216.aspx |
| Oligonucleotides | ||
| DNA | IDT | N/A |
| RNA | Dharmoncon | N/A |
| Recombinant DNA | ||
| (G4C2)66 | Su et al. Neuron 2014, 83, 1043 | N/A |
| (TG4C2)66 | This study | N/A |
| (G4C2)66-NoATG-GFP | This study | N/A |
| (G4C2)66-NoATG-Nanoluc | This study | N/A |
| mCherry | Addgene | Cat#54563 |
| pet15b expression vector encoding His-tagged hnRNP H1 | Addgene | Cat#2302 |
| Software and Algorithms | ||
| GraphPad 7.03 | Prism | https://www.graphpad.com/ |
| Origin 7.5 | Originlab | https://www.originlab.com/ |
| Topspin 2.1 | Bruker | https://www.bruker.com/products.html |
Experimental Model Details:
Cell culture.
HEK293T cells (female) were cultured in 1× DMEM containing 4.5 g/L glucose, 10% FBS, 2 mM L-glutamine, and 1× penicillin/streptomycin (growth medium) at 37 °C in 5% CO2.
Authentication of cell lines used.
HEK293T cells were purchased from ATCC and used without further authentication.
Method Details:
Compounds.
All 1a-like compounds were acquired from the National Cancer Institute (NCI). Compound identity was confirmed by mass spectroscopy and compound purity was assessed by analytical HPLC. (See the Supporting Information for methods related to acquisition of analytical HPLC traces). All compounds were >95% pure. Methods describing the synthesis of 1a-TOQ (Scheme S1) and 4-TO-PRO (Scheme S2) and their characterization are provided in the Supporting Information. The G-quadruplex ligands, PDS, cPDS (carboxylPDS), BER (Berberine) and Braco-19 were obtained from Sigma. CX-5461 was obtained from Adooq Bioscience. The NMM (N-Methyl mesoporphyrin IX) and TMPyP4 compounds were obtained from Frontier Scientific and ThermoFisher, respectively. PyPx-2-DMA was synthesized as previously described(Rzuczek et al., 2010). The BMVC derivatives were provided by Dr. Ta-Chau Chang (IAMS, Academia Sinica).
Oligonucleotides.
All oligonucleotides used in this study have been purchased from GE Dharmacon and de-protected according to the manufacturer’s recommended procedure. Vivo-Morpholino was acquired from Gene Tools.
Plasmids.
The (G4C2)66, (G4C2)66-NoATG-GFP and (G4C2)66-NoATG-Nanoluc plasmids were constructed using previously described methods (Gendron et al., 2013; Yang et al., 2015). To generate the (TG3C2)62 plamsid, gDNA from fibroblasts of a Sca36+ patients was used as a templates in a nested PCR strategy using ThermalAce DNA Polymerase (Invitrogen) or AmpliTaq Gold 360 Polymerase (Thermo Fisher). The sequence includes 69 bp 5’ of the repeat expansion and 40 bp of 3’ flanking sequence. The PCR products were cloned into the pAG3 expression vector (gift of T. Golde, UF), then sequentially ligated using TypellS restriction enzymes to generate a (TG3C2)62 fragment. All TGGGCCn fragments with 5’ and 3’ flanking sequences were subcloned into the pAG3 expression vector containing two upstream stop codons in each reading frame, as well as 3 different C-terminal tags in alternate frames [i.e., (GP)n-HA, (GL)n-Myc and (WA)n-FLAG].
Affinity of 1a-TOQ for r(G4C2)8
The affinity of 1a-TOQ for r(G4C2)8 was completed by measuring the fluorescence intensity of 1a-TOQ as a function of r(G4C2)8 concentration. Briefly, the RNA was folded in 1× Assay Buffer (8 mM K2HPO4, pH 7.0, 185 mM KCI, and 1 mM EDTA) by heating at 95°C for 3–5 min and slowly cooling to room temperature for 15 min. BSA and 1a-TOQ were added to final concentration of 40 μg/mL and 1.2 μM, respectively. The RNA was then serially diluted into 1× Assay Buffer supplemented with 40 μg/mL BSA and 1.2 μM 1a-TOQ. The resulting curve was fit to a one-site binding model to afford the Kd (Data S1).
Dye displacement assay to study binding of compounds to r(G4C2)8
The RNA, r(G4C2)8, (600 nM final concentration) was folded as described above. Then BSA and 1a-TOQ were added to final concentration of 40 μg/ml_ and 1.2 μM, respectively, followed by the compound of interest. The samples were incubated for 15 min at room temperature and fluorescence was measured (excitation/emission wavelengths of 480/530 nm) using BioTek FLx800 plate reader. Background (emission of 1a-TOQ in absence of RNA) was subtracted, and the signal was normalized to 1a-TOQ complex with RNA in the absence of compound.
IC50’s were measured analogously by completing serial dilutions of the compound of interest in 1× Assay Buffer containing 600 nM r(G4C2)8, 1.2 μM 1a-TOQ, and 40 μg/mL BSA. IC50s were calculated from normalized data using a four-parameter logistic curve fit (SigmaPlot).
Biolayer interferometry (BLI).
The BLI studies were performed in similar fashion to the previously reported procedure(Su et al., 2014) on an Octet RED96 system. Briefly, 5′-biotinylated RNAs (60 nM) were folded by heating at 95°C for 5 min followed by slowly cooling to room temperature in the K+-containing buffer. The K+-containing buffer was prepared similarly using a 10× solution (80 mM KH2PO4, pH 7.0, 185 mM KCI, 1 mM EDTA). Separately, serial dilutions of the compound of interest (ranging from 0.5 μM to 25 μM) were prepared in the corresponding buffer. The following incubation times were used during data acquisition (30 °C with shaking at 1000 rpm): baseline step (180 s), loading of RNA (900 s), washing (180 s), association of compound (500 s), and dissociation of compound (350 s). The resulting curves were analyzed and processed using the version 7.1 of the Octet Data Analysis software by subtracting the response of the sensors recorded upon incubation with solutions containing compound and no RNA (parallel reference). The data were then globally fitted assuming reversible binding using entire time interval for association and dissociation using the 2:1 heterogeneous binding or 1:1 binding curve fitting model.
Recombinant hnRNP H1-His6 Production, Isolation, and Purification.
The pet15b expression vector encoding His-tagged hnRNP H1 was obtained from Addgene (ID: 23020)(Chou et al., 1999) and transformed into Rosetta 2 (DE3) Escherichia coli cells. The transformed cells were grown in LB medium at 37 °C to OD600 = 0.6 before induction with 0.5 mM IPTG and then cultured at 25 °C for 4 h. Cells were pelleted and lysed in 20 mM Tris-HCl, pH 7.5, and 500 mM NaCl (Buffer A) via sonication. The lysate was centrifuged and the pellet was washed with lysis buffer before it was solubilized in 20 mM Tris-HCl, pH 7.5, 500 mM NaCl, and 6 M Urea (Buffer B). After centrifugation, the supernatant was filtered and loaded onto His60 Ni Superflow resin (Clontech). The column was washed with 5 column volumes (CVs) of Buffer B. hnRNP H1 was refolded on the column with a gradient from 100% Buffer B to 100% Buffer A with 20 CVs at a flow rate of 0.1 mL/min. Then the column was washed for 10 CVs of 90% Buffer B and 10% Buffer C (20 mM Tris-HCl, pH 7.5, 500 mM NaCl, and 500 mM imidazole). The refolded protein was eluted with a gradient to 100% Buffer C over 10 CVs.
Affinity of hnRNP H1 for r(G4C2) repeats.
The affinity of hnRNP H1 for r(G4C2) repeats was measured by a gel shift assay. The RNA was 5′ end labeled with [α−32P]ATP and T4 polynucleotide kinase and gel purified as previously described.(Su et al., 2014) Briefly, r(G4C2)a was folded in 1× Folding Buffer (20 mM HEPES, pH 7.5, 110 mM KCl, 10 mM NaCl) by heating to 95 °C for 5 min followed by slowly cooling to room temperature. The buffer was adjusted to 1×TR-FRET Assay Buffer (20 mM HEPES, pH 7.5, 110 mM KCl, 10 mM NaCl, 0.1% (w/v) BSA, 2 mM MgCl2, 2 mM CaCl2, 0.05% Tween-20, 5 mM DTT). The RNA was aliquoted and hnRNP H1-His6 (360 nM final concentration) was added to the first aliquot followed by 1:2 serial dilutions. The samples were incubated at room temperature for 1 h. The RNA and RNA-hnRNP H1-His6 complex were separated on a native 5% polyacrylamide gel prepared with 1×TBE. The percentage of complex formation as a function of hnRNP H1-His6was fit to a one-site binding model to afford the Kd.
TR-FRET hnRNP H Binding Assay.
The TR-FRET assays were performed as previously described(Disney et al., 2012) except the final concentrations of biotinylated r(G4C2)8 RNA and hnRNP H1-His6 were 80 nM and 75 nM, respectively. The RNA was folded by heating to 95 °C for 5 min in 1× Folding Buffer followed by slowly cooling to room temperature. The buffer was adjusted to 1 ×TR-FRET Assay Buffer followed by addition of compound. The mixture was incubated for 15 min at room temperature and then hnRNP H1-His6 was added. After an additional 15 min incubation, streptavidin-XL665 (HTRF, Cisbio Bioassays) and anti-His6-Tb (HTRF, Cisbio Bioassays) were added to a final concentration of 40 nM and 0.44 ng/μL, respectively. After incubating for 1 h, TR-FRET was measured as previously described. Thew IC50’s were either calculated by fitting the equation (1) in Graphpad Prism.
| (eq. 1) |
Verification of RAN translation product in (G4C2)66-NoATG-GFP plasmid by Western Blot.
HEK293T cells were plated in 60 mm cell culture dishes and transfected with 4 μg (G4C2)66-NoATG-GFP or ATG-GFP plasmid using JetPrime transfected agent. After 4 h, cells were trypsinized and plated into 12-well plates in growth medium. After an additional 2 h, the compound of interest or vehicle were added in growth medium. Cells were lysed in the plate using 300 μL/well of mammalian protein extraction reagent (MPER, Pierce Biotechnology) containing 1 μL of halt protease inhibitor cocktail(Thermo Scientific). Cellular proteins were separated by SDS-PAGE and then transferred to a PVDF membrane. Western blotting was completed using anti-GFP (Santa Cruz) as primary antibodies and anti-IgG-horseradish peroxidase conjugate as the secondary antibody. Chemiluminescent signal was generated by SuperSignal West Pico Chemiluminescent substrate (Thermo Scientific), and the blot was imaged using X-ray film.
Cell-based assay to assess RAN translation and Poly(GP) response.
The HEK293T cells (80% confluent) were batch-transfected in growth medium for 4 h with (G4C2)66-No ATG-GFP and a plasmid encoding mCherry (for normalization) using JetPrime transfection reagent (Polyplus) according to the manufacturer’s instructions. The cells were then seeded into a 384-well plate and incubated for 2 h before addition of compound using Biomek NXP Laboratory Automation Workstation that was equipped with a 100 nL 384-pin head. After treatment for 24 h, the medium was removed, and the cells were lysed in 100 mM potassium phosphate lysis buffer, pH 7.8, and 0.2% Triton X-100. Fluorescence was measured using a BioTek FLx800 with 530/25 nm (excitation) and 590/35 nm (emission) filters for mCherry and 485/20 nm (excitation) and 528/20 nm (emission) filters for GFP. Background was determined by measuring the corresponding fluorescence intensities in untransfected cells. The background-corrected ratio of GFP to mCherry was used to determine the effect of compound on RAN translation. Poly (GP) measurement was followed by previous protocol.(Su et al., 2014) The HEK293T cells were batch-transfected with (G4C2)66 or (TG4C2)62 plasmid and were treated different concentration of 4.
Effect of compound treatment on (G4C2)66-No ATG-GFP transcript levels.
Approximately 2×10⁶ HEK293T cells were plated in 60 mm cell culture dishes and transfected with 3.5 μg (G4C2)66-No ATG-GFP plasmid using JetPrime transfect agent per manufacturer’s protocol. After 4 h, cells were trypsinized and plated into 48-well plates in growth medium. After an additional 2 h, the compound of interest or vehicle were added in growth medium. After overnight incubation, the compound-containing medium was removed, and cells were washed with 1× Dulbecco’s phosphate-buffered saline (DPBS). Total RNA was harvested with a Quick RNA™ Mini-Prep Kit (Zymo Research) per the manufacturer’s recommended protocol.
The cDNA was generated from 100 ng RNA using a QScript cDNA Synthesis Kit (Quanta Biosciences) according to manufacturer’s recommended procedure; qPCR was completed with Power SYBR Green PCR Master Mix (Life Technologies) and 1 μL of 10-fold diluted cDNA on an Applied Biosystems 7900HT Fast Real Time PCR System. The levels of (G4C2)66-No ATG-GFP were measured with primers specific for GFP and normalized to 18S or (β-actin values. Table S3 lists the sequences of all PCR primers.
CD spectroscopy.
The CD spectroscopic experiments were conducted using a spectropolarimeter (J-815 Jasco) with a bandwidth of 2 nm at a scan speed of 50 nm/min and a step resolution of 0.2 nm over the spectral range of 210–450 nm. The RNA sample concentration was 10 to 20 μM in 10 mM Na2HPO4 buffer with 50 mM LiCI. Thermal melting curves were recorded by a peltier thermal coupler chamber (Jasco), was monitored at 26 5nm between 20 and 95 °C with a temperature ramping rate of 1°C/min rate. The observed signals were baseline subtracted, and the first derivative zero points were defined as the melting temperature. Shape analysis of the melting curves yielded Van’t Hoff enthalpy (ΔHvH) using standard procedures (Marky and Breslauer, 1987). The cooperativity of 4 binding to r(G4C2) repeats was measured by plotting the normalized signal intensity at 300 nm or 330 nm in CD spectra as a function of the molar ratio of ([4]/ [RNA]) and fitted to the following equation:
| (eq. 2) |
where y is the normalized signal intensity, x0 is initial molar ratio of ([4]/ [RNA]); x is the molar ratio of ([4]/ [RNA]), nHill is Hill coefficient, and K is the Hill binding constant.
NMR spectroscopy.
All NMR spectroscopic experiments were performed on a Bruker AVIII 700 MHz NMR spectrometer equipped a cryoprobe (Bruker, USA). 1D imino proton NMR spectra were recorded by a WATERGATE pulse sequence for water suppression. RNA concentrations were typically 0.1 mM for 1D experiments and 0.4 mM for the 2D experiments, and studies were completed in 10 mM sodium phosphate buffer with 100 mM LiCl. Ligand were prepared 10 mM in D2O or d6-DMSO, and then added into different equivalents into RNA solution. For the kinetic experiments, the RNA samples were prepared in in 10 mM sodium phosphate buffer with 50 mM LiCl as the hairpin folded state, and addition of 150 mM KCl. The time for recording an individual NMR spectrum was 30 min. Kinetic curves were fit to a three-state kinetic model and were analyzed by Origin 7.0 and Topspin 2.0 (see below). An internal reference of 0.1 mM 4,4-dimethyl-4-silapentane-1-sulfonic acid was used. The resonances of exchangeable protons were assigned using 2D nuclear Overhauser effect (NOE) spectroscopy with a mixing time of 400 ms.
Analytical solution of the three-state transition model.
A three-state transition model for hairpin state as (H), unfolding state as U, and G-quadruplex state as Q previously described (Korobov and Ochkov, 2011) is as follows:
| (Equation 3.1) |
Where k1 and k2 are the forward and reverse transition rates associated with the first step between the initial and intermediate states, respectively, while k3 and k4 are the forward and reverse transition rates associated with the second step between the intermediate and final states, respectively. The analytical solution for this three-state transition model is given as:
| (eq. 3.2) |
| (eq. 3.3) |
| (eq. 3.4 |
Where γ1γ2 = k1k3+k2k4+k1k4 and γ1 + γ2 = k1 + k2 + k3+ k4. The initial conditions were H(0) = H0, U(0) = Q(0) = 0. The experimental quantities associated with the initial and final states were extracted from the time-resolved spectra, which were used as input for nonlinear regression to extract k1, k2, k3, and k4 in the Origin 7.5 software (OriginLab Corp., Northampton, MA, USA).
The kinetic data were obtained by analytical solution of three-state transition model, where normalized kinetic curves showed the imino proton signals of initial state of hairpin (H) and final state of G-quadruplex (Q) as a function of time, which were fitted by equation 3.2 and 3.4.
RNA FISH and immunostaining: nuclear foci.
The RNA FISH and hnRNP H immunostaining were completed as previously described.(Lee et al., 2013) Briefly, HEK293T cells (80% confluent) were batch-transfected as described above. The cells were then seeded into 12-well plates with coverslips and incubated for 2 h before addition of compound. After incubation with compound for 24 h, the cells were fixed in 4% paraformaldehyde for 15 min and washed 5 times with 1× DPBS. After washing with 1× DPBS for 15 min at room temperature, the cells were washed with 0.1% Triton X-100 in 1× DPBS for 5 min at room temperature followed by washing with 40% formamide in 2× SSC buffer for 15 min at room temperature. The RNA FISH probe was then added (5 ng/μL of 5’-cy3-d(G2C4)8-3’) in 40% formamide in 2× SSC containing 8 μg/mL BSA, 66 μg/mL yeast tRNA, and 2 mM vanadyl complex. The samples were incubated at 48 °C and 5% CO2 overnight. Following overnight hybridization, the cells were washed three times with 2× SSC and then three times with 1× DPBS at room temperature for 15 min each. To immunostain hnRNP H, cells were fixed with 2% (v/v) formaldehyde in 1× DPBS, permeabilized with 0.1% (v/v) Triton X-100 in 1× DPBS, blocked with 5% goat serum for 40 min, and then incubated with a 1:250 dilution of anti-hnRNP H (Novus Bio) in 1× DPBS for 1 h at room temperature. After washing with 1× DPBS twice, the cells were incubated with a 1:250 dilution anti-rabbit IgG DyLight 650 in 1× DPBS at room temperature for 1 h. After washing (1× DPBS three times at room temperature for 15 min each), cells were stained with 1 μg/mL DAPI in 1× DPBS for 10 min at room temperature and then washed again with 1× DPBS immediately before imaging. Images were collected using an Olympus Fluoview 1000 confocal microscope. A cell was considered foci-positive if green (RNA) and red (hnRNP H) fluorescence signal overlapped in punctate spots. “% Foci-positive Cells” was therefore calculated by dividing the number of foci-positive cells by the total number of cells analyzed and multiplying by 100.
Foci Imaging by 4-TO-PRO and BG4, a G-quadruplex antibody.
Briefly, HEK293T cells (80% confluent) were batch-transfected as described above. The cells were then seeded into 12-well plates with coverslips and incubated for 2 h before addition of compound. After incubation with compound for 24 h, the cells were fixed in 2% paraformaldehyde for 15 min and washed five times with 1× DPBS. The cells were then washed with 0.1% Triton X-100 in 1× DPBS for 5 min and three times with 1× DPBS. 4-TO-PRO (0.5 μM) was added to the cells for 2 h at 37 °C.
For experiments employing 4 or RNase, the cells were incubated 4 (5 μM for 24 h) or RNase, the cells were incubated an RNase solution (25 mg/ ml in 1× DPBS) at 37 °C for 2 h and washed 2 times with 1× DPBS before treatment with 4-TO-PRO. For BG4 studies,(Moye et al., 2015) the cells were fixed with 2% (v/v) formaldehyde in 1× DPBS, permeabilized with 0.1% (v/v) Triton X-100 in PBS, and blocked with 2% (w/v) milk in 1× DPBS. After washing with 1× DPBS twice, the slides were incubated with BG4 primary antibody (600 nM) for 1 h at 37 °C, and washed three times for 5 min with 0.01% Tween-20 in 1× DPBS and then overlaid with secondary antibody (Rabbit anti-flag Tag antibody, Cell Signaling; 1:800 dilution) for 1 h at 37 °C. After washing three times with 0.01% Tween-20 in 1× DPBS, the cells were incubated with anti-rabbit IgG DyLight 650. The cells were stained with 1 μg/ mL DAPI in 1× DPBS for 10 min at room temperature and then washed with 1× DPBS. Images were collected using an Olympus Fluoview 1000 confocal microscope. A cell was considered 4-TO-PRO foci-positive if the cell contained punctate spots with green fluorescence (4-TO-PRO)]. “% 4-TO-PRO Foci-positive Cells” was therefore calculated by dividing the number of 4-TO-PRO foci-positive cells by the total number of cells analyzed and multiplying by 100002E
Polysome profiling.
Polysome profiling studies were completed similarly to previously described. Methods (Yang et al., 2016; Yang et al., 2015). Briefly, 100 mm dishes were plated with 4.5×10⁶ HEK293T cells and batch-transfected as described above. Approximately 2 h after plating, cells were treated with vehicle or 4 (5 μM) and incubated for 16–18 h. Cells were then lysed with 250 μL of ice-cold Cell Lysis Buffer [10 mM NaCI, 10 mM MgCI2, 10 mM Tris, pH 7.5, 1% Triton X-100, 1% sodium deoxycholate, 1 mM DTT supplemented with 0.1 mg/L cycloheximide and 0.2 U/μL RNAsin (Promega)]. The lysate was transferred to an Eppendorf tube, gently vortexed and centrifuged for 5 min at 13,200 rpm and 4 °C. The supernatant was transferred to a new tube and stored at - 80 °C until further use.
Cellular lysates were separated using a 10–50% sucrose gradient in 500 μL fractions. A 100 μL aliquot from each fraction was removed and the RNA isolated by using a Quick RNA™ Mini-Prep (Zymo Research) according to manufacturer’s protocol. cDNA was generated from 250 ng of RNA using a QScript cDNA Synthesis Kit according to manufacturer’s recommended procedure. The levels of (G4C2)66-No ATG-GFP mRNA in each fraction were measured by qPCR as described above with primers specific for GFP (Table S3). Data from vehicle- and compound-treated samples were normalized as follows: triplicate Ct values were averaged and ΔCt values were calculated by comparison to (β-actin; ΔΔCt values were afforded by comparing treated to untreated ΔCt values. Data were then normalized to the fraction with the lowest abundance of GFP.
Verification of RAN translation product in (G4C2)66-NoATG-NanoLuc plasmid by SDS-PAGE and LC-MS.
HEK293T cells were prepared as described in above, and transfected (G4C2)66-NoATG-NanoLuc or ATG-NanoLuc (pNL1.1) plasmid using JetPrime transfected agent. Cells were lysed in the plate using 300 μL/well of mammalian protein extraction reagent (MPER, Pierce Biotechnology) containing 1 μL of halt protease inhibitor cocktail(Thermo Scientific). Cellular proteins were separated by SDS-PAGE. After using coomassie staining to gel, the gel was excised according to size protein maker (Spectra™ Multicolor Broad Range Protein Ladder, Thermo Fisher Scientific) (The molecular weight of the protein NanoLuc (~21 kDa) and RANT-NanoLuc (~35 kDa)). The gel bands were in-gel treated with 10 mM DTT followed by 50 mM iodoacetamide, and subjected to trypsin digestion overnight. Prior to mass spectrometry analysis, the peptide pools were acidified, desalted through Zip-Tip C18 tip columns and dried down.
Each sample was then reconstructed in 100 μl of 0.1% formic acid and 13 μl were loaded into the system. Each sample was analyzed by an Orbitrap Fusion™ Tribrid™ Mass Spectrometer (Thermo Fisher Scientific) coupled to an EASY-nLC 1000 system. Peptides were on-line eluted on an analytical RP column (0.075 × 250 mm Acclaim PepMap RLSC nano Viper, Thermo Fisher Scientific), operating at 300nl/min using the following gradient: : 5–25% B for 40 min, 25–44% B for 20 mins, 44–80% B in 10 sec, 80% B for 5 mins, 80–5% in 10 sec, and 5% B for 20 min (solvent A: 0.1% formic acid (v/v); solvent B: 0.1% formic acid (v/v), 80% CH3CN (v/v) (Fisher Scientific)). The Orbitrap Fusion was operated in a data-dependent MS/MS mode using the 10 most intense precursors detected in a survey scan from 380 to 1,400 m/z performed at 120K resolution. Tandem MS was performed by HCD fragmentation with normalized collision energy (NCE) of 30.0%. Protein identification was carried out using Mascot and Sequest algorithms, allowing Oxidation (Met) and Deamination (Q) as variable modifications. Other settings included Carbamidomethylation of Cys as fixed modification, three missed cleavages, and mass tolerance of 10 and 20 ppm for precursor and fragment ions, respectively. MS/MS raw files were searched against a human database along with porcine trypsin and sequence of protein of interest (NanoLuc).
In vitro translation assay.
The RNA template for translational assays was transcribed from the (G4C2)66-No ATG-NanoLuc plasmid using an in vitro transcription system (RiboMax, Promega). In vitro translation reactions (50 μL) using the Flexi Rabbit Reticulocyte Lysate System (Promega) were programmed with 4μg (G4C2)66-No ATG-NanoLuc RNA and 1μg Firefly Luciferase RNA (Promega) as the template. The RNA was folded into the G-quadruplex form in buffer containing KCI (384 mM) by heating at 95 °C for 10 min followed by slow cooling to 25 °C in a total volume of 10 μL. The RNA was folded into the hairpin form in buffer by placing on ice. (NMR spectroscopy shows that only the hairpin is formed at low temperatures.) After folding, the RNA was added to the reticulocyte lysate, amino acid mixtures, and RNasin ribonuclease inhibitor (Promega) in a total volume of 50 μL (manufacturer’s protocol). Translation proceed for 90 min at 30 °C for 90 min and then luciferase activity was m easured. The reactions were diluted in Glo Lysis Buffer followed by addition of Nano-Glo substrate (Promega).
Molecular dynamics & computational methods.
Parameterization of 4.
Same protocol described before (Childs-Disney et al., 2013; Childs-Disney et al., 2014) was applied to study the binding modes of 4 to r(G4C2)exp. The force field parameters of 4 were prepared as described before.(Childs-Disney et al., 2013; Childs-Disney et al., 2014) The AMBER GAFF force field(Wang et al., 2005) was used to define the atom types while RESP charges were derived following the RESP protocol (Table S3).(Bayly et al., 1993; Cornell et al., 1993) The molecule was optimized and the electrostatic potential as a set of grid points was calculated at the HF level using the 6–31G* basis set, where Gaussian03 was used to perform these calculations.(Frisch et al., 2004)
Binding studies.
The folded hairpin structure of C4G2 has two unique 1×1 GG motifs; (i) 5’-CGG/5’-CGG, and (ii) 5’-GGC/5’-GGC. Thus, two model systems were designed to study the binding modes of 4 to RNA C4G2: (i) r(CCGCGGCGG)2, and (ii) r(CCGGGCCGG)2. For each case, the lowest free energy bound states of 4 were calculated using a dynamic docking methodology we previously designed and successfully applied to study binding modes of two compounds targeting RNA CUG and CCUG repeat expansions.(Childs-Disney et al., 2013; Childs-Disney et al., 2014) For the RNA, amber99 force field(Cornell et al., 1995) with revised χ,(Yildirim et al., 2010) and α/γ(Wales and Yildirim, 2017) torsional parameters were used. Modified implicit solvent model (GBOBC)(Onufriev et al., 2004) with 0.3M salt concentration was used in all binding simulations. The stem regions of RNA were restrained to sample around A-form RNA by inclusion of Watson-Crick (WC) base pairing, and torsional restraints, as well as chirality restraints to keep the chiral centers in proper orientations. The dynamic docking methodology can be summarized as follows: The initial structures of the model RNAs with 1×1 GG motifs have been designed to be in A-form conformations where the 1×1 GG loop residues are in anti-anti state. Compound 4 molecules were put 40 Å away from RNA loops to create the initial structure for the RNA-4 complexes. First, we created initial bound states by slowly moving 4 to the 1×1 GG loops of the RNA by increments of 1 Å. The distance between the center of mass (COM) of the heavy atoms of the closing GC bases and the heavy atoms of ring atoms of 4 was used as the reaction coordinate. During this step, WC base pairing and torsional restraints representing A-form RNA was imposed on the RNA except the loop regions to allow 4 interact with RNA freely. Once 4 was 0 Å away from the RNA loops as described above, we slowly moved the compound away from the RNA by increments of 1 Å. In this second step, WC base pairing and torsional restraints representing A-form RNA was imposed including the loop regions. This process was repeated 50 times continuously, which provided 50 initial bound states for our next step. We then run 50 independent MD simulations in implicit solvent using the 50 structures determined in the previous step. Again, WC base pairing and torsional restraints representing A-form RNA were imposed on the RNA except the loop regions so that 4 was free to sample around the initial conformations. The simulation time of each independent MD was 120 ns creating a total of 6 μs combined trajectory, which was used in cluster analyses. During the whole process, Langevin dynamics with collision frequency of 1 was used with a long-range cutoff of 999 Å. We utilized the pmemd.cuda to perform the MD simulations.(Case et al., 2016)
Analyses.
An in-house code was written to perform the cluster analyses. First, the 50 MD trajectories were combined for the cluster analyses where root-mean-square deviation (rmsd) was used as the parameter to cluster the snapshots in the combined trajectories. Starting from the first structure in the combined trajectory, rmsd analyses were performed and snapshots with <= 1 Å were clustered. Note that the RNA duplexes are symmetric, which were considered during the cluster analyses. Once the clusters were created, MMPBSA(Case et al., 2016) analyses were performed to calculate the relative binding free energies (see Table S4).
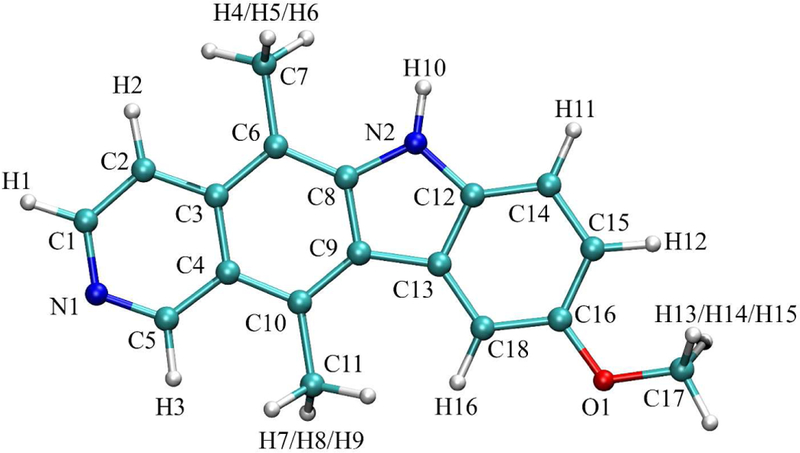
Atom names for 4 (see for atom types and charges).
Atom numbers, names, types, and charges for 4.
| Atom Number |
Atom Name |
Atom Type |
Atom Charge |
Atom Number |
Atom Name |
Atom Type |
Atom Charge |
|---|---|---|---|---|---|---|---|
| 1 | N1 | nb | −0.697242 | 20 | H8 | hc | 0.119629 |
| 2 | C1 | ca | 0.379613 | 21 | H9 | hc | 0.119629 |
| 3 | H1 | h4 | 0.056724 | 22 | N2 | na | −0.449642 |
| 4 | C2 | ca | −0.471363 | 23 | H10 | hn | 0.382690 |
| 5 | H2 | ha | 0.159024 | 24 | C12 | ca | 0.124979 |
| 6 | C3 | ca | 0.281386 | 25 | C13 | cp | 0.194609 |
| 7 | C4 | ca | −0.328324 | 26 | C14 | ca | −0.300241 |
| 8 | C5 | ca | 0.490060 | 27 | H11 | ha | 0.189262 |
| 9 | H3 | h4 | 0.030793 | 28 | C15 | ca | −0.260461 |
| 10 | C6 | ca | −0.081640 | 29 | H12 | ha | 0.169908 |
| 11 | C7 | c3 | −0.180363 | 30 | C16 | ca | 0.399860 |
| 12 | H4 | hc | 0.067851 | 31 | O1 | os | −0.368024 |
| 13 | H5 | hc | 0.067851 | 32 | C17 | c3 | 0.025384 |
| 14 | H6 | hc | 0.067851 | 33 | H13 | h1 | 0.058026 |
| 15 | C8 | ca | 0.084953 | 34 | H14 | h1 | 0.058026 |
| 16 | C9 | cp | −0.109642 | 35 | H15 | h1 | 0.058026 |
| 17 | C10 | ca | 0.133682 | 36 | C18 | ca | −0.419302 |
| 18 | C11 | c3 | −0.355354 | 37 | H16 | ha | 0.182153 |
| 19 | H7 | hc | 0.119629 | ||||
A sample input file used to perform MMPBSA analysis.
============ mmpbsa.in ==============
MMPBSA.py input file for running PB and GB
&general
 startframe=1, endframe=100000, interval=1,
 keep_files=1, verbose =2,
/
&gb
 igb=5, saltcon=0.300,surften=0.0072,surfoff=0.00,
/
&pb
 istrng=0.300, fillratio=4.0,inp=1,radiopt=0,
 indi=1.0,exdi=80,scale=2,linit=1000,prbrad=1.4,
 cavity_surften=0.0072,cavity_offset=0.00,
/
=====================================
Synthetic Methods
General Synthetic Methods.
All reagents and solvents used for chemical synthesis were purchased from commercial sources and used without further purification unless specified. NMR solvents were acquired from Cambridge Isotope Labs and used as received. Compound characterization is provided in Data S2.
Instrumentation.
1H- and 13C-NMR spectra were acquired on 400 MHz or 700 MHz Bruker Avance spectrometers. Chemical shifts (δ) are reported in ppm relative to tetramethylsilane or the respective NMR solvent; coupling constants (J) are in Hertz (Hz). Abbreviations used are s, singlet; bs, broad singlet; d, doublet; dd, doublet of doublets; t, triplet; dt, doublet of triplets; td, triplet of doublets; tt, triplet of triplets; bt, broad triplet; q, quartet; m, multiplet; and bm, broad multiplet.
Reverse-phase HPLC was completed using a Waters 1525 binary HPLC pump equipped with a Waters 2487 dual absorbance detector system. Preparative HPLC separations were completed using Atlantis PrepT3 OBD™ 5 μM 19×150mm column on a gradient of 20% to 100% methanol (MeOH) + 0.1% trifluoroacetic acid (TFA) in H2O + 0.1% TFA over 60 min and a flow rate of 5 mL/min.
Analytical HPLC separations were completed using SunFire C18 3.5μM 4.6×150mm column on a gradient of 20% to 100% methanol (MeOH) + 0.1% TFA in H2O + 0.1% TFA over 60 min and a flow rate of 1 mL/min.
Flash chromatography was performed on a Biotage Isolera instrument using pre-packed silica columns purchased from Agela Technologies.
Mass spectra were recorded on a Varian 500-MS IT mass spectrometer. High resolution mass spectra were obtained at the Scripps Florida Mass Spectrometry and Proteomics Laboratory.
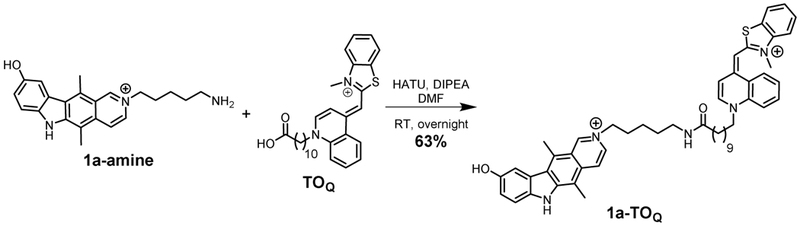
Synthetic scheme for 1a-TOQ.
Synthesis of 1a-TOQ.
1a-amine (Su et al., 2014) and TOQ (Carreon et al., 2004) were synthesized as previously described. TOQ (12.5 mg, 22.5 μmol, 1.0 eq) and HATU (8.3 mg, 22.5 μmol, 1.0 eq) were dissolved in anhydrous N,N-dimethylformamide (DMF; 50 μL), followed by the addition of DIPEA (16 μL, 92 μmol, 4.1 eq). The mixture was vortexed and incubated for 1 min at room temperature. Then an aliquot from a 50 mM 1a-amine (22.5 μmol, 1.0 eq) stock solution in DMF was added. The mixture was stirred for 16 h at room temperature. The reaction mixture was diluted with MeOH and water and purified by preparative HPLC. The product was isolated as a dark red solid in 63% yield (11.4 mg).
1H NMR (400 MHz, DMSO-d6) δ 11.97 (s, 1H), 10.02 (s, 1H), 9.42 (s, 1H), 8.75 (d, J = 8.0 Hz, 1H), 8.58 (d, J = 7.3 Hz, 1H), 8.48 (d, J = 7.1 Hz, 1H), 8.42 (d, J = 7.2 Hz, 1H), 8.11 – 8.00 (m, 2H), 8.01 – 7.91 (m, 1H), 7.83 – 7.77 (m, 2H), 7.73 (dd, J = 10.0, 4.6 Hz, 2H), 7.65 – 7.58 (m, 1H), 7.49 (d, J = 8.6 Hz, 1H), 7.42 (t, J = 7.6 Hz, 1H), 7.30 (d, J = 7.2 Hz, 1H), 7.13 (dd, J = 8.6, 2.3 Hz, 1H), 6.87 (s, 1H), 4.67 (t, J = 7.3 Hz, 2H), 4.51 (t, J = 7.3 Hz, 2H), 4.00 (s, 3H), 3.27 (s, 3H), 3.03 (q, J= 6.6 Hz, 2H), 2.80 (s, 3H), 2.01 (dt, J= 15.0, 7.4 Hz, 2H), 1.92 (t, J = 7.4 Hz, 2H), 1.80 (dt, J = 15.0, 7.5 Hz, 2H), 1.48–1.42 (m, 2H), 1.35– 1.09 (m, 16H).
13C NMR (176 MHz, DMSO-d6) δ 172.01, 160.03, 158.12 (q, TFA), 157.94 (q, TFA), 157.76 (q, TFA), 157.58 (q, TFA), 152.12, 148.48, 146,45, 146.35, 144.89, 144.25, 140.49, 136.96, 136.16, 133.54, 133.28, 132.10, 130.62, 128.25, 126.80, 126.15, 125.82, 124.57, 124.21, 123.90, 123.03, 122.90, 120.29, 119.75, 118.13 (CN, CH3CN), 118.03, 117.92 (q, TFA), 117.48 116.28 (q, TFA), 113.05, 112.14, 110.07, 109.79, 107.82, 88.08, 59.30, 54.94 (CH2, CH2Cl2), 54.14, 37.95, 35.39, 33.81, 30.44, 28.83, 28.78, 28.75, 28.65, 28.59, 28.53, 25.91, 25.25, 23.00, 14.92, 11.96, 1.18 (CH3, CH3CN).
HRMS: calculated for [C51H59N5O2S2+]: 402.7189; found: 402.7191
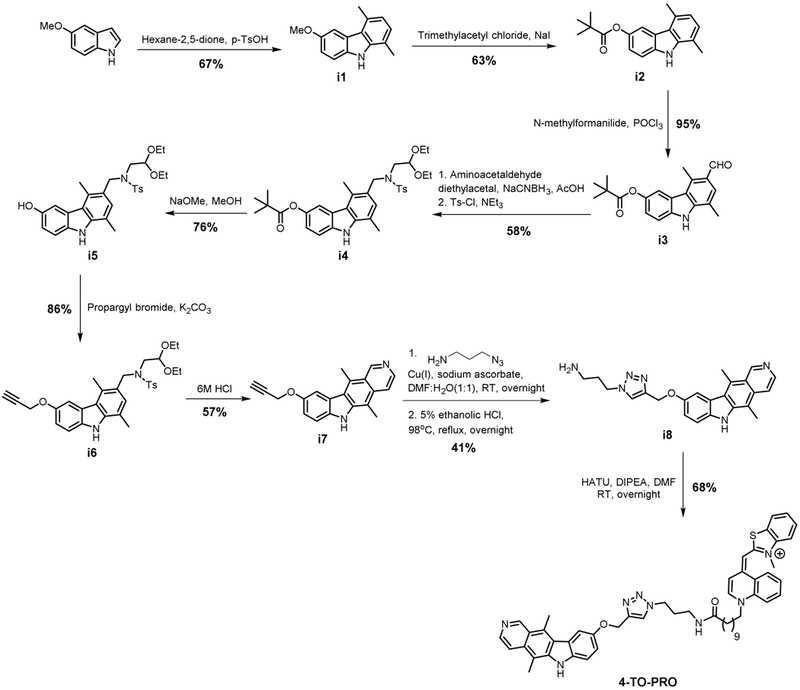
Synthetic scheme for 4-TO-PRO.
Synthesis of i1.
A solution of 5-methoxyindole (5 g, 33.9 mmol, 1.0 eq), hexane-2,5-dione (6.4 mL, 54.2 mmol, 1.6 eq) and p-toluenesulfonic acid (34 mg, 1.7 mmol, 0.05 eq) was sealed in a 20 mL microwave tube and irradiated for 20 min at 160 °C. The reaction mixture was transferred to a 250 mL round-bottom flask and recrystallized form ethanol. The crystallized product was washed with ice-cooled ethanol and dried under vacuum to provide i1 as a slightly red solid (5.11 g, yield = 67%).
1H NMR (400 MHz, CDCl3) δ 7.93 (bs, 1H), 7.70 (d, J=2.4 Hz, 1H), 7.38 (d, J=8.7 Hz, 1H), 7.12 (d, J=7.3 Hz, 1H), 7.08 (dd, J=8.7, 2.4 Hz, 1H), 6.91 (d, J=7.3 Hz, 1H), 3.95 (s, 3H), 2.85 (s, 3H), 2.52 (s, 3H).
13C NMR (101 MHz, CDCl3) δ 207.26, 153.67, 139.70, 134.44, 130.78, 126.14, 125.00, 121.38, 120.49, 117.17, 113.48, 110.94, 106.38, 56.21, 36.94, 29.96, 20.49, 16.60.
HRMS (ESI) calc. for C15H15NO [M+H]+, 226.1154; found 226.1228.
Synthesis of i2.
Trimethylacetyl chloride (1.56 mL, 12.72 mmol, 1.5 eq) and sodium iodide (2.6 g, 17.3 mmol, 2.04 eq) were added to a solution of i1 (1.91 g, 8.48 mmol, 1.0 eq) in 21.4 mL acetonitrile at room temperature. The reaction mixture was heated to reflux (112 °C) for three hours, the solvent was removed under reduced pressure and the crude product was dissolved in ethyl acetate (100 mL). The solution was washed with water (50 mL), a saturated solution of sodium thiosulfate (50 mL) and brine (20 mL). The organic layer was dried over sodium sulfate, filtered and the solvent was removed under reduced pressure. The crude product was loaded on a 100 g pre-filled Biotage cartridge and was eluted by applying a linear gradient from 4–34% EtOAc in hexanes providing i2 as a slightly brown solid (1.56 g, yield = 63%).
1H NMR (400 MHz, CDCI3) δ 8.10 (s, 1H), 7.73 – 7.69 (m, 1H), 7.34 – 7.28 (m, 1H), 7.11 (d, J=7.3 Hz, 1H), 7.06 – 7.01 (m, 1H), 6.88 (d, J=7.3, 1H), 2.72 (s, 3H), 2.50 (s, 3H), 1.48–1.43 (m, 9H).
13C NMR (101 MHz, CDCI3) δ 178.49, 144.17, 139.70, 137.17, 130.96, 126.51, 124.73, 121.28, 120.83, 118.63, 117.24, 114.73, 111.04, 39.24, 27.45, 20.43, 16.68.
HRMS (ESI) calcd. forC19H21NO2 [M+H]+, 296.1572; found 296.1651.
Synthesis of i3.
Phosphorous oxychloride (679 μL, 7.47 mmol, 1.5 eq) was added dropwise to N-methylformanilide (922 μL, 7.47 mmol, 1.5 eq) at room temperature. After stirring for 30 min a solution of i2 (1.47 g, 4.98 mmol, 1.0 eq) was added and the reaction mixture was heated to reflux (140 °C) for three hours. The solvent was removed under reduced pressure and the crude product was dried under vacuum for 90 min. An aqueous solution of potassium acetate (10%) was added and the mixture was stirred for 16 hours at room temperature. The product was filtered and washed with 1% aqueous HCI (10 mL), water (10 mL) and a mixture of hexanes and toluene (1:1, 10 mL). After drying under vacuum, i3 was obtained as a brown solid (1.53 g, yield = 95%).
1H NMR (400 MHz, DMSO-d6) δ 11.82 (s, 1H), 10.36 (s, 1H), 7.89 (d, J=2.3 Hz, 1H), 7.68 (s, 1H), 7.59 (d, J=8.7 Hz, 1H), 7.18 (dd, J=8.7, 2.3 Hz, 1H), 3.07 (s, 3H), 2.55 (s, 3H), 1.36 (s, 9H).
13C NMR (101 MHz, DMSO-d6) δ 191.47, 177.05, 144.12, 143.02, 138.05, 135.90, 128.25, 125.70, 123.59, 121.03, 119.75, 118.35, 115.17, 111.83, 38.54, 26.91, 16.54, 14.61.
HRMS (ESI) calcd. forC20H21NO [M+H]+, 324.1521; found 324.1602.
Synthesis of i4.
A mixture of i3 (1.43 g, 4.42 mmol, 1.0 eq), aminoacetaldehyde diethylacetal (804 μL, 5.53 mmol, 1.25 eq), acetic acid (443 μL, 7.74 mmol, 1.75 eq) and sodium cyanoborohydride (486 mg, 7.74 mmol, 1.75 eq) in ethanol (34 ml.) was heated to 83°C for five hours. The reaction was quenched by the addition of a saturated aqueous solution of NaHCO3 (30 ml.) and the product was extracted with chloroform (3× 30 mL). The combined organic extracts were washed with brine (20 mL), dried over sodium sulfate and the solvent was removed under reduced pressure giving intermediate product as a brown oil (1.91 g, yield = 98%), which was used without any further purification for the next step.
The intermediate product described above was dissolved in 11 mL. THF, triethylamine (1.22 mL, 8.84 mmol, 2.0 eq) and p-toluenesulfonyl chloride (927 mg, 4.86 mmol, 1.1 eq) were added at 0°C. The cooling bath was removed and the reaction mixture was stirred at room temperature for 16 h. After the addition of ethyl acetate and water (each 20 mL), the phases were separated and the aqueous layer was extracted with ethyl acetate (3×20 mL). The combined organic extracts were washed with 0.1 M HCI (1×50 mL), saturated aqueous NaHCO3 solution (1×50 mL) and brine (1×50 mL), dried over sodium sulfate, filtered and the solvent was removed under reduced pressure. The crude product was co-evaporated with silica, loaded on a 100 g pre-filled Biotage cartridge and was eluted by applying a linear gradient from 8–66% EtOAc in hexanes giving i4 (1.56 g, 59%) as a slightly brown solid. (58% yield over two steps)
1H NMR (400 MHz, CDCI3) δ 8.14 – 8.05 (m, 1H), 7.79 – 7.70 (m, 3H), 7.39 – 7.34 (m, 1H), 7.30 – 7.27 (m, 2H), 7.08 – 7.04 (m, 1H), 6.96 (s, 1H), 4.65 (s, 2H), 4.42 (t, J=5.4 Hz, 1H), 3.57 – 3.46 (m, 2H), 3.34 – 3.25 (m, 2H), 3.19 (d, J=5.4 Hz, 2H), 2.71 (s, 3H), 2.39 (s, 3H), 2.37 (s, 3H), 1.43 (s, 9H), 1.07 (t, J=7.0 Hz, 6H).
13C NMR (101 MHz, CDCI3) δ 178.29, 144.29, 143.23, 139.40, 137.54, 137.48, 130.68, 129.62, 129.28, 127.41, 124.76, 124.27, 121.91, 118.83, 117.01, 115.19, 110.90, 102.07, 63.21, 50.74, 49.52, 39.23, 27.43, 21.58, 16.55, 15.92, 15.37.
HRMS (ESI) calcd. for C33H42N2O6S [M]+, 594.2764; found 594.2720.
Synthesis of i5.
Sodium methoxide (78 mg, 1.45 mmol, 2.0 eq) was added to a solution of i4 (430 mg, 0.72 mmol, 1.0 eq) in 3.6 mL methanol and the reaction mixture was stirred for three hours at room temperature. The reaction was quenched by the addition of water (10 mL) and the product was extracted with ethyl acetate (3×20 mL). The combined organic extracts were dried over Na2SO4 and the solvent was removed under reduced pressure. The crude product was co-evaporated with silica and loaded on a 50 g pre-filled Biotage cartridge and was eluted by applying a linear gradient from 10–80% EtOAc in hexanes providing i5 as a brown solid (274 mg, yield = 74%).
1H NMR (400 MHz, DMSO-d6) δ = 10.82 (s, 1H), 8.87 (s, 1H), 7.77 (d, J=8.4 Hz, 2H), 7.53 (d, J=2.3 Hz, 1H), 7.44 (d, J=8.4 Hz, 2H), 7.32 (d, J=8.6 Hz, 1H), 6.91 – 6.87 (m, 2H), 4.47 (s, 2H), 4.04 (t, J=5.4 Hz, 1H), 3.37 – 3.26 (m, 5H), 3.09 (m, 2H), 3.02 (d, J=5.4 Hz, 2H), 2.69 (s, 3H), 2.41 (s, 3H), 2.38 (s, 3H), 0.90 (t, J=7.0 Hz, 6H).
13C NMR (101 MHz, DMSO-d6) δ 150.29, 143.15, 139.47, 136.35, 134.23, 129.75, 129.53, 128.20, 127.15, 123.91, 122.26, 120.99, 116.82, 114.10, 111.22, 107.31, 100.53, 61.98, 50.77, 49.17, 20.98, 16.64, 15.33, 14.99.
HRMS (ESI) calcd. for C28H34N2O5S [M+H]+, 511.2188; found 511.2153.
Synthesis of i6.
i5 (100 mg, 0.196 mmol, 1.0 eq) was dissolved in 2 mL acetone. After the addition of K2CO3 (81 mg, 0.392 mmol, 3.0 eq) and propargyl bromide (80% in toluene, 37 μL, 0.392 mmol, 2.0 eq) the reaction mixture was heated to 80°C and stirred for 16 hours. The reaction was quenched by the addition of water (5 mL) and the product was extracted with EtOAc (3×10 mL). The combined organic extracts were dried over Na2SO4, filtered and the solvent was removed under reduced pressure. The resultant yellow oil was purified by flash chromatography applying a linear gradient from 8–66% EtOAc in hexanes, which provided i6 as a slightly yellow solid (93 mg, yield = 86% yield).
1H NMR (400 MHz, CDCI3) δ 8.00 (s, 1H), 7.82 (d, J=2.4, 1H), 7.74 (d, J=8.3 Hz, 2H), 7.37 (d, J=8.8 Hz, 1H), 7.27 (d, J=8.0 Hz, 2H), 7.11 (dd, J=8.8, 2.4 Hz, 1H), 6.94 (s, 1H), 4.78 (d, J=2.4 Hz, 2H), 4.65 (s, 2H), 4.42 (t, J=5.4 Hz, 1H), 3.52 (dq, J=9.4 Hz, 7.0, 2H), 3.30 (dq, J=9.4 Hz, 7.0, 2H), 3.20 (d, J=5.4Hz, 2H), 2.77 (s, 3H), 2.55 (t, J=2.4 Hz, 1H), 2.39 (s, 3H), 2.36 (s, 3H), 1.07 (t, J=7.0 Hz, 6H).
13C NMR (101 MHz, CDCI3) δ 151.68, 143.24, 139.53, 137.42, 135.48, 130.68, 129.59, 129.14, 127.39, 124.92, 123.91, 121.98, 116.97, 114.59, 111.06, 109.01, 102.07, 79.34, 75.46, 63.24, 57.49, 50.90, 49.52, 21.56, 16.53, 15.90, 15.35.
HRMS (ESI) calcd. for C31H36N2O5S [M+H]+, 549.2345; found 549.2286.
Synthesis of i7.
A solution of i6 (111 mg, 0.202 mmol) in 1.5 mL dioxane and 220 μL of 6M HCI was heated to reflux (120°C) for 45 min. The solvent was evaporated, 6 mL 1% aqueous NaCI solution were added and the suspension was stirred for 1 h. The product was filtered, washed with water and rinsed with acetone. The product was removed from the frit and transferred to an Eppendorf vial, suspended in acetone, centrifuged and the acetone was decanted. The acetone washing was repeated three times, the product was dried in vacuo to yield i7 as a yellow orange solid (39 mg, yield = 57%).
1H NMR (400 MHz, DMSO-d6) δ 12.13 (s, 1H), 9.94 (s, 1H), 8.51 – 8.25 (m, 2H), 8.01 (d, J=2.4, 1H), 7.61 (d, J=8.8 Hz, 1H), 7.35 (dd, J=8.8, 2.4 Hz, 1H), 4.98 (d, J=2.4 Hz, 2H), 3.63 (t, J=2.4 Hz, 1H), 3.31 (s, 3H), 2.84 (s, 3H).
13C NMR (176 MHz, DMSO-d6) δ 151.95, 144.77, 144.00, 137.66, 133.77, 133.65, 127.57, 125.65, 122.59, 119.56, 119.44, 117.73, 112.12, 110.12, 109.80, 79.60, 78.35, 56.54, 14.93, 12.06.
HRMS (ESI) calcd. forC20H16N2O [M+H]+, 301.1263; found 301.1340.
Synthesis of i8.
i7 (10 mg, 33.3 μmol, 1 eq) and 3-azido-1-propanamine (10 mg, 100 μmol, 3 eq) were dissolved in a mixture of DMF:H2O=1:1 (4 mL in total). Then ascorbic acid (2.64 mg, 15 μmol, 0.45 eq) and Cu(l) complex (3 mg, 5 μmol, 0.15 eq) were added under inert atmosphere and the mixture was left to react overnight at room temperature. The solvent was removed and to the solid residue was added 5% ethanolic HCI (5 mL) and the mixture was refluxed overnight at 98°C. Afterwards, the solvent was removed in vacuo and the resulting product was re-dissolved in MeOH:H2O=1:4 and purified using preparative HPLC yielding the desired product as a yellow solid (5.5 mg, yield = 41%).
1H NMR (700 MHz, DMSO-d6) δ 9.97 (s, 1H), 8.42 (q, J = 6.9 Hz, 2H), 8.34 – 8.31 (s, 1H), 8.08 (s, 1H), 7.89 (s, 3H), 7.60 (d, J = 8.7 Hz, 1H), 7.37 (dd, J = 8.7, 2.3 Hz, 1H), 5.34 (s, 2H), 4.51 (t, J = 6.9 Hz, 2H), 3.32 (s, 3H), 2.83 (s, 5H), 2.18 – 2.07 (m, 2H).
13C NMR (176 MHz, DMSO-d6) δ 158.70 (q, TFA), 158.50 (q, TFA), 158.29 (q, TFA), 158.09 (q, TFA), 152.91, 144.83, 144.15, 143.13, 137.42, 133.87, 133.66, 127.59, 125.78, 124.73, 122.71, 119.57, 119.48, 118.27 (q, TFA), 117.61, 116.61 (q, TFA), 114.95 (q, TFA), 113.30 (q, TFA), 112.21, 110.12, 109.33, 62.09, 46.65, 36.40, 27.89, 14.96, 11.99.
HRMS (ESI) calcd. forC23H25N6O [M+H]+, 401.4940; found 401.2058.
Synthesis of 4-TO-PRO.
TOQ (6.43 mg, 13.5 μmol, 1 eq) and HATU (5.14 mg, 13.5 μmol, 1 eq) were dissolved in N,N-dimethylformamide (DMF; 200 μL), followed by addition of N-ethyldiisopropylamine (DIPEA; 5.2 μL, 3.85 mg, 29.76 μmol, 2.2 eq). The mixture was left to react for 15 min at room temperature. Then, i8 (5.95 mg, 14.88 μmol, 1.1 eq) dissolved in DMF (400 μL) previously neutralized with DIPEA (2.2 eq) was added and the mixture was stirred overnight at room temperature. The reaction mixture was concentrated under reduced pressure and re-dissolved in a mixture of MeOH:H2O. The desired product was obtained using preparative HPLC as a dark red solid (7.9 mg, yield = 68%).
1H NMR (700 MHz, DMSO-d6) δ 12.04 (s, 1H), 9.91 (s, 1H), 8.68 (d, J = 8.7 Hz, 1H), 8.56 (d, J = 7.2 Hz, 1H), 8.36 (dd, J = 20.4, 6.9 Hz, 2H), 8.32 (s, 1H), 8.07 (d, J = 8.7 Hz, 1H), 8.03 (d, J = 2.1 Hz, 1H), 7.98 – 7.92 (m, 3H), 7.70 (t, J = 7.4 Hz, 2H), 7.57 – 7.55 (m, 1H), 7.51 (d, J = 8.7 Hz, 1H), 7.37 (t, J = 7.5 Hz, 1H), 7.28 (dd, J = 8.7, 2.3 Hz, 1H), 7.19 (d, J = 7.1 Hz, 1H), 7.04 (s, 1H), 6.76 (s, 1H), 5.30 (s, 2H), 4.52 (t, J = 7.5 Hz, 2H), 4.40 (t, J = 7.1 Hz, 2H), 3.93 (s, 3H), 3.29 (s, 3H), 3.07 (dd, J = 12.6, 6.6 Hz, 2H), 2.81 (s, 3H), 2.05 (t, J = 7.3 Hz, 2H), 1.97 (p, J = 6.9 Hz, 2H), 1.83 – 1.78 (m, 2H), 1.49 – 1.45 (m, 2H), 1.35 – 1.31 (m, 2H), 1.22 (s, 10H).
13C NMR (176 MHz, DMSO-d6) δ 172.33, 159.72, 158.27 (q, TFA), 158.09 (q, TFA), 157.90 (q, TFA), 157.72 (q, TFA), 152.84, 148.27, 144.75, 144.13, 142.91, 140.29, 137.36, 136.89, 133.78, 133.58, 133.18, 128.09, 126.70, 125.74, 125.70, 124.57, 124.41, 124.13, 123.80, 122.77, 122.66, 119.52, 119.37, 117.99, 117.57 (q, TFA), 117.47, 115.88 (q, TFA), 112.87, 112.12, 110.02, 109.25, 107.76, 87.88, 62.08, 54.12, 47.35, 40.02, 35.63, 35.34, 33.68, 30.09, 28.77, 28.75, 28.70, 28.63, 28.50, 28.44, 25.82, 25.18, 19.70, 14.96, 11.99.
HRMS (ESI) calcd. for C52H57N8O2S+ 857.4320; found 857.4278.
Quantification and Statistical Analysis:
Sample size was determined by studying variation in untreated samples. Each sample was randomly assigned as either treated or untreated and were unblinded. Statistical significance was calculated by using a two-tailed Student t test (Prism’s GraphPad v. 7.03). Differences between treatment groups were considered statistically significant when p < 0.05 (*p < 0.05, **p < 0.01, ***p < 0.001). Total RNA harvested from cells was excluded from further analysis if the ratio of Abs260/Abs280 was <1.8, which indicates poor quality. The number of replicates for each experiment is reported in the figure caption (n≥3).
Supplementary Material
SIGNIFICANCE.
The most common genetic cause of ALS and FTD is the expanded G4C2 [(G4C2)exp] repeat in C9ORF72. The RNA transcribed from this repeat expansion, directly causes “c9ALS/FTD” by sequestering RNA-binding proteins and producing toxic dipeptide repeats via RAN translation. Thus, r(G4C2)exp is an important target for chemical probe and lead medicine development. The c9ALS/FTD RNA exists in equilibrium between two forms, a hairpin displaying 1×1 nucleotide GG internal loops and a G-quadruplex. We demonstrated our small molecule, 4, binds the 1×1 nucleotide GG internal loop in the hairpin structure of r(G4C2)exp and thereby inhibits two putative pathomechanisms of c9ALS/FTD. Surprisingly, known G-quadruplex ligands were poor inhibitors of RAN translation. This finding prompted an investigation into the energetics of r(G4C2)exp folding, which revealed that the hairpin form is more kinetically favorable than the G-quadruplex. Further, in vitro translation assays showed that the hairpin, not the G-quadruplex, form of r(G4C2)exp, undergoes RAN translation. Direct imaging using a fluorogenic hybrid molecule combining 4 with TO-PRO-1 demonstrated that: (i) 4 binds cellular r(G4C2)exp and (ii) r(G4C2)exp folds into the hairpin structure in cells. Collectively, our studies demonstrate that a small molecule targeting the hairpin structure can inhibit r(G4C2)exp-associated toxicity. In summary, this work not only highlights the power of rationally designed chemical probes to identify and validate therapeutically relevant RNA structures in cells but also provides new insight into the role of r(G4C2)exp structure in c9ALS/FTD biology.
Highlights.
An expanded RNA repeat that causes ALS folds into two forms in cells
The hairpin, not quadruplex, form of the ALS RNA undergoes RAN translation
Studies were enabled by development of a chemical probe selective for the hairpin
ACKNOWLEDGMENTS.
This work was funded by the National Institutes of Health [DP1 NS096898–02 (M.D.D.); P01 NS099114–01 (M.D.D. and L.P.); R35NS097273 (L.P.); Alzheimer’s Drug Discovery Foundation [ADDF; GRAN translation ID: 2014120 to M.D.D.] and Target ALS [M.D.D.]. Z.F.W is supported in part by the Academia Sinica-TSRI Postdoctoral Fellowship. A.U. acknowledges the Deutsche Forschungsgemeinschaft (DFG) for the DFG Postdoctoral Fellowship.
Footnotes
Competing Financial Interests. M.D.D. is a consultant for Expansion Therapeutics.
Data and Software Availability: N/A
Publisher's Disclaimer: This is a PDF file of an unedited manuscript that has been accepted for publication. As a service to our customers we are providing this early version of the manuscript. The manuscript will undergo copyediting, typesetting, and review of the resulting proof before it is published in its final citable form. Please note that during the production process errors may be discovered which could affect the content, and all legal disclaimers that apply to the journal pertain.
REFERENCES
- Almeida S, Gascon E, Tran H, Chou HJ, Gendron TF, Degroot S, Tapper AR, Sellier C, Charlet-Berguerand N, Karydas A, et al. (2013). Modeling key pathological features of frontotemporal dementia with C9ORF72 repeat expansion in iPSC-derived human neurons. Acta Neuropathol. 126, 385–399. [DOI] [PMC free article] [PubMed] [Google Scholar]
- Ambrus A, Chen D, Dai J, Bialis T, Jones RA, and Yang D (2006). Human telomeric sequence forms a hybrid-type intramolecular G-quadruplex structure with mixed parallel/antiparallel strands in potassium solution. Nucleic Acids Res. 34, 2723–2735. [DOI] [PMC free article] [PubMed] [Google Scholar]
- Ash PE, Bieniek KF, Gendron TF, Caulfield T, Lin WL, Dejesus-Hernandez M, van Blitterswijk MM, Jansen-West K, Paul JW 3rd, Rademakers R, et al. (2013). Unconventional translation of C9ORF72 GGGGCC expansion generates insoluble polypeptides specific to c9FTD/ALS. Neuron 77, 639–646. [DOI] [PMC free article] [PubMed] [Google Scholar]
- Bayly CI, Cieplak P, Cornell WD, and Kollman PA (1993). A well-behaved electrostatic potential based method using charge restraints for deriving atomic charges - the Resp Model. J. Phys. Chem. 97, 10269–10280. [Google Scholar]
- Biffi G, Di Antonio M, Tannahill D, and Balasubramanian S (2014). Visualization and selective chemical targeting of RNA G-quadruplex structures in the cytoplasm of human cells. Nat. Chem. 6, 75–80. [DOI] [PMC free article] [PubMed] [Google Scholar]
- Bugaut A, and Balasubramanian S (2012). 5’-UTR RNA G-quadruplexes: translation regulation and targeting. Nucleic Acids Res. 40, 4727–4741. [DOI] [PMC free article] [PubMed] [Google Scholar]
- Bugaut A, Murat P, and Balasubramanian S (2012). An RNA hairpin to G-quadruplex conformational transition. J. Am. Chem. Soc. 134, 19953–19956. [DOI] [PMC free article] [PubMed] [Google Scholar]
- Burger AM, Dai F, Schultes CM, Reszka AP, Moore MJ, Double JA, and Neidle S (2005). The G-quadruplex-interactive molecule BRACO-19 inhibits tumor growth, consistent with telomere targeting and interference with telomerase function. Cancer Res. 65, 1489–1496. [DOI] [PubMed] [Google Scholar]
- Cammas A, and Millevoi S (2017). RNA G-quadruplexes: emerging mechanisms in disease. Nucleic Acids Res. 45, 1584–1595. [DOI] [PMC free article] [PubMed] [Google Scholar]
- Carreon JR, Mahon KP Jr., and Kelley SO (2004). Thiazole orange-peptide conjugates: sensitivity of DNA binding to chemical structure. Org. Lett. 6, 517–519. [DOI] [PubMed] [Google Scholar]
- Case DA, Betz RM, Cerutti DS, Cheatham TE, Darden TA, Duke RE, Giese TJ, Gohlke H, Goetz AW, Homeyer N, et al. (2016). AMBER 16 (San Francisco, CA: University of California; ). [Google Scholar]
- Chen CZ, Sobczak K, Hoskins J, Southall N, Marugan JJ, Zheng W, Thornton CA, and Austin CP (2012). Two high-throughput screening assays for aberrant RNA-protein interactions in myotonic dystrophy type 1. Anal. Bioanal. Chem. 402, 1889–1898. [DOI] [PMC free article] [PubMed] [Google Scholar]
- Chew J, Gendron TF, Prudencio M, Sasaguri H, Zhang YJ, Castanedes-Casey M, Lee CW, Jansen-West K, Kurti A, Murray ME, et al. (2015). Neurodegeneration. C9ORF72 repeat expansions in mice cause TDP-43 pathology, neuronal loss, and behavioral deficits. Science 348, 1151–1154. [DOI] [PMC free article] [PubMed] [Google Scholar]
- Childs-Disney JL, Stepniak-Konieczna E, Tuan T, Yildirim I, Park H, Chen CZ, Hoskins J, Southall N, Marugan JJ, Patnaik S, et al. (2013). Induction and reversal of myotonic dystrophy type 1 pre-mRNA splicing defects by small molecules. Nat. Commun. 4. [DOI] [PMC free article] [PubMed] [Google Scholar]
- Childs-Disney JL, Yildirim I, Park H, Lohman JR, Guan L, Tran T, Sarkar P, Schatz GC, and Disney MD (2014). Structure of the myotonic dystrophy type 2 RNA and designed small Molecules that reduce toxicity. ACS Chem. Biol. 9, 538–550. [DOI] [PMC free article] [PubMed] [Google Scholar]
- Chou MY, Rooke N, Turck CW, and Black DL (1999). hnRNP H is a component of a splicing enhancer complex that activates a c-src alternative exon in neuronal cells. Mol. Cell. Biol. 19, 69–77. [DOI] [PMC free article] [PubMed] [Google Scholar]
- Collie GW, Campbell NH, and Neidle S (2015). Loop flexibility in human telomeric quadruplex small-molecule complexes. Nucleic Acids Res. 43, 4785–4799. [DOI] [PMC free article] [PubMed] [Google Scholar]
- Conlon EG, Lu L, Sharma A, Yamazaki T, Tang T, Shneider NA, and Manley JL (2016). The C9ORF72 GGGGCC expansion forms RNA G-quadruplex inclusions and sequesters hnRNP H to disrupt splicing in ALS brains. Elife 5, pii: e17820. [DOI] [PMC free article] [PubMed] [Google Scholar]
- Cornell WD, Cieplak P, Bayly CI, Gould IR, Merz KM, Ferguson DM, Spellmeyer DC, Fox T, Caldwell JW, and Kollman PA (1995). A second generation force field for the simulation of proteins, nucleic acids, and organic molecules. J. Am. Chem. Soc. 117, 5179–5197. [Google Scholar]
- Cornell WD, Cieplak P, Bayly CI, and Kollman PA (1993). Application of RESP charges to calculate conformational energies, hydrogen-bond energies, and free-energies of solvation. J. Am. Chem. Soc. 115, 9620–9631. [Google Scholar]
- DeJesus-Hernandez M, Mackenzie IR, Boeve BF, Boxer AL, Baker M, Rutherford NJ, Nicholson AM, Finch NA, Flynn H, Adamson J, et al. (2011). Expanded GGGGCC hexanucleotide repeat in noncoding region of C9ORF72 causes chromosome 9p-linked FTD and ALS. Neuron 72, 245–256. [DOI] [PMC free article] [PubMed] [Google Scholar]
- Disney MD, Liu B, Yang W, Sellier C, Tran T, Charlet-Berguerand N, and Childs-Disney JL (2012). A small molecule that targets r(CGG)exp and improves defects in fragile X-associated tremor ataxia syndrome. ACS Chem. Biol. 7, 1711–1718. [DOI] [PMC free article] [PubMed] [Google Scholar]
- Dominguez C, Fisette JF, Chabot B, and Allain FH (2010). Structural basis of G-tract recognition and encaging by hnRNP F quasi-RRMs. Nat. Struct. Mol. Biol. 17, 853–861. [DOI] [PubMed] [Google Scholar]
- Donnelly CJ, Zhang PW, Pham JT, Haeusler AR, Mistry NA, Vidensky S, Daley EL, Poth EM, Hoover B, Fines DM, et al. (2013). RnA toxicity from the ALS/FTD C9ORF72 expansion is mitigated by antisense intervention. Neuron 80, 415–428. [DOI] [PMC free article] [PubMed] [Google Scholar]
- Endoh T, Kawasaki Y, and Sugimoto N (2013). Translational halt during elongation caused by G-quadruplex formed by mRNA. Methods 64, 73–78. [DOI] [PubMed] [Google Scholar]
- Fay MM, Anderson PJ, and Ivanov P (2017). ALS/FTD-Associated C9ORF72 Repeat RNA Promotes Phase Transitions In Vitro and in Cells. Cell Rep. 21, 3573–3584. [DOI] [PMC free article] [PubMed] [Google Scholar]
- Franceschin M, Rossetti L, D’Ambrosio A, Schirripa S, Bianco A, Ortaggi G, Savino M, Schultes C, and Neidle S (2006). Natural and synthetic G-quadruplex interactive berberine derivatives. Bioorg. Med. Chem. Lett. 16, 1707–1711. [DOI] [PubMed] [Google Scholar]
- Frisch MJ, Trucks GW, Schlegel HB, Scuseria GE, Robb MA, Cheeseman JR, Montgomery J,JA, Vreven T, Kudin KN, Burant JC, et al. (2004). Gaussian 03 (Wallingford, CT: Gaussian, Inc.). [Google Scholar]
- Gendron TF, Bieniek KF, Zhang YJ, Jansen-West K, Ash PE, Caulfield T, Daughrity L, Dunmore JH, Castanedes-Casey M, Chew J, et al. (2013). Antisense transcripts of the expanded C9ORF72 hexanucleotide repeat form nuclear RNA foci and undergo repeat-associated non-ATG translation in c9FTD/ALS. Acta Neuropathol. 126, 829–844. [DOI] [PMC free article] [PubMed] [Google Scholar]
- Gendron TF, Chew J, Stankowski JN, Hayes LR, Zhang YJ, Prudencio M, Carlomagno Y, Daughrity LM, Jansen-West K, Perkerson EA, et al. (2017). Poly(GP) proteins are a useful pharmacodynamic marker for C9ORF72-associated amyotrophic lateral sclerosis. Sci Transl Med 9, pii: eaai7866. [DOI] [PMC free article] [PubMed] [Google Scholar]
- Gray RD, and Chaires JB (2008). Kinetics and mechanism of K+- and Na+-induced folding of models of human telomeric DNA into G-quadruplex structures. Nucleic Acids Res. 36, 4191–4203. [DOI] [PMC free article] [PubMed] [Google Scholar]
- Gray RD, Trent JO, and Chaires JB (2014). Folding and unfolding pathways of the human telomeric G-quadruplex. J. Mol. Biol. 426, 1629–1650. [DOI] [PMC free article] [PubMed] [Google Scholar]
- Guo JU, and Bartel DP (2016). RNA G-quadruplexes are globally unfolded in eukaryotic cells and depleted in bacteria. Science 353, 1382. [DOI] [PMC free article] [PubMed] [Google Scholar]
- Haeusler AR, Donnelly CJ, Periz G, Simko EA, Shaw PG, Kim MS, Maragakis NJ, Troncoso JC, Pandey A, Sattler R, et al. (2014). C9orf72 nucleotide repeat structures initiate molecular cascades of disease. Nature 507, 195–200. [DOI] [PMC free article] [PubMed] [Google Scholar]
- Hershman SG, Chen Q, Lee JY, Kozak ML, Yue P, Wang LS, and Johnson FB (2008). Genomic distribution and functional analyses of potential G-quadruplex-forming sequences in Saccharomyces cerevisiae. Nucleic Acids Res. 36, 144–156. [DOI] [PMC free article] [PubMed] [Google Scholar]
- Huang FC, Chang CC, Lou PJ, Kuo IC, Chien CW, Chen CT, Shieh FY, Chang TC, and Lin JJ (2008). G-quadruplex stabilizer 3,6-bis(1-methyl-4-vinylpyridinium)carbazole diiodide induces accelerated senescence and inhibits tumorigenic properties in cancer cells. Mol. Cancer Res. 6, 955–964. [DOI] [PubMed] [Google Scholar]
- Jiang J, Zhu Q, Gendron TF, Saberi S, McAlonis-Downes M, Seelman A, Stauffer JE, Jafar-Nejad P, Drenner K, Schulte D, et al. (2016). Gain of Toxicity from ALS/FTD-Linked Repeat Expansions in C9ORF72 Is Alleviated by Antisense Oligonucleotides Targeting GGGGCC-Containing RNAs. Neuron 90, 535–550. [DOI] [PMC free article] [PubMed] [Google Scholar]
- Korobov V, and Ochkov V (2011). Chemical kinetics with Mathcad and Maple In Chemical kinetics with Mathcad and Maple (Vienna: Springer-Verlag/Wien,), pp. 35–72. [Google Scholar]
- Kovanda A, Zalar M, Sket P, Plavec J, and Rogelj B (2015). Anti-sense DNA d(GGCCCC)n expansions in C9ORF72 form i-motifs and protonated hairpins. Sci. Rep. 5, 17944. [DOI] [PMC free article] [PubMed] [Google Scholar]
- Kuo MH, Wang ZF, Tseng TY, Li MH, Hsu ST, Lin JJ, and Chang TC (2015). Conformational transition of a hairpin structure to G-quadruplex within the WNT1 gene promoter. J. Am. Chem. Soc. 137, 210–218. [DOI] [PubMed] [Google Scholar]
- Lane AN, Chaires JB, Gray RD, and Trent JO (2008). Stability and kinetics of G-quadruplex structures. Nucleic Acids Res. 36, 5482–5515. [DOI] [PMC free article] [PubMed] [Google Scholar]
- Lee YB, Chen HJ, Peres JN, Gomez-Deza J, Attig J, Stalekar M, Troakes C, Nishimura AL, Scotter EL, Vance C, et al. (2013). Hexanucleotide repeats in ALS/FTD form length-dependent RNA foci, sequester RNA binding proteins, and are neurotoxic. Cell Rep. 5, 1178–1186. [DOI] [PMC free article] [PubMed] [Google Scholar]
- Lim KW, Amrane S, Bouaziz S, Xu W, Mu Y, Patel DJ, Luu KN, and Phan AT (2009). Structure of the human telomere in K+ solution: a stable basket-type G-quadruplex with only two G-tetrad layers. J. Am. Chem. Soc. 131, 4301–4309. [DOI] [PMC free article] [PubMed] [Google Scholar]
- Lin C, Wu G, Wang K, Onel B, Sakai S, Shao Y, and Yang D (2018). Molecular recognition of the hybrid-2 human telomeric G-quadruplex by epiberberine: insights into conversion of telomeric G-quadruplex structures Angew. Chem. Int. Ed. Engl. in press, 10.1002/anie.201804667. [DOI] [PMC free article] [PubMed] [Google Scholar]
- Liu W, Ikeda Y, Hishikawa N, Yamashita T, Deguchi K, and Abe K (2014). Characteristic RNA foci of the abnormal hexanucleotide GGCCUG repeat expansion in spinocerebellar ataxia type 36 (Asidan). Eur. J. Neurol. 21, 1377–1386. [DOI] [PubMed] [Google Scholar]
- Luu KN, Phan AT, Kuryavyi V, Lacroix L, and Patel DJ (2006). Structure of the human telomere in K+ solution: an intramolecular (3 + 1) G-quadruplex scaffold. J. Am. Chem. Soc. 128, 9963–9970. [DOI] [PMC free article] [PubMed] [Google Scholar]
- Marky LA, and Breslauer KJ (1987). Calculating thermodynamic data for transitions of any molecularity from equilibrium melting curves. Biopolymers 26, 1601–1620. [DOI] [PubMed] [Google Scholar]
- Mashimo T, Sannohe Y, Yagi H, and Sugiyama H (2008). Folding pathways of hybrid-1 and hybrid-2 G-quadruplex structures. Nucleic Acids Symp. Ser. 409–410. [DOI] [PubMed] [Google Scholar]
- Mashimo T, and Sugiyama H (2007). Folding pathways of human telomeric hybrid G-quadruplex structure. Nucleic Acids Symp. Ser. 239–240. [DOI] [PubMed] [Google Scholar]
- Matsuzono K, Imamura K, Murakami N, Tsukita K, Yamamoto T, Izumi Y, Kaji R, Ohta Y, Yamashita T, Abe K, et al. (2017). Antisense Oligonucleotides Reduce RNA Foci in Spinocerebellar Ataxia 36 Patient iPSCs. Mol. Ther. Nucleic Acids 8, 211–219. [DOI] [PMC free article] [PubMed] [Google Scholar]
- Mizielinska S, Gronke S, Niccoli T, Ridler CE, Clayton EL, Devoy A, Moens T, Norona FE, Woollacott IO, Pietrzyk J, et al. (2014). C9orf72 repeat expansions cause neurodegeneration in Drosophila through arginine-rich proteins. Science 345, 1192–1194. [DOI] [PMC free article] [PubMed] [Google Scholar]
- Mizielinska S, and Isaacs AM (2014). C9orf72 amyotrophic lateral sclerosis and frontotemporal dementia: gain or loss of function? Cur. Opin. Neurol. 27, 515–523. [DOI] [PMC free article] [PubMed] [Google Scholar]
- Moye AL, Porter KC, Cohen SB, Phan T, Zyner KG, Sasaki N, Lovrecz GO, Beck JL, and Bryan TM (2015). Telomeric G-quadruplexes are a substrate and site of localization for human telomerase. Nat. Commun. 6, 7643. [DOI] [PMC free article] [PubMed] [Google Scholar]
- Murat P, Zhong J, Lekieffre L, Cowieson NP, Clancy JL, Preiss T, Balasubramanian S, Khanna R, and Tellam J (2014). G-quadruplexes regulate Epstein-Barr virus-encoded nuclear antigen 1 mRNA translation. Nat. Chem. Biol. 10, 358–364. [DOI] [PMC free article] [PubMed] [Google Scholar]
- O’Rourke JG, Bogdanik L, Muhammad AK, Gendron TF, Kim KJ, Austin A, Cady J, Liu EY, Zarrow J, Grant S, et al. (2015). C9orf72 BAC transgenic mice display typical pathologic features of ALS/FTD. Neuron 88, 892–901. [DOI] [PMC free article] [PubMed] [Google Scholar]
- Obayashi M, Stevanin G, Synofzik M, Monin ML, Duyckaerts C, Sato N, Streichenberger N, Vighetto A, Desestret V, Tesson C, et al. (2015). Spinocerebellar ataxia type 36 exists in diverse populations and can be caused by a short hexanucleotide GGCCTG repeat expansion. J. Neurol. Neurosurg. Psychiatry 86, 986–995. [DOI] [PubMed] [Google Scholar]
- Onufriev A, Bashford D, and Case DA (2004). Exploring protein native states and large-scale conformational changes with a modified generalized born model. Proteins 55, 383–394. [DOI] [PubMed] [Google Scholar]
- Phan AT, Kuryavyi V, Luu KN, and Patel DJ (2007). Structure of two intramolecular G-quadruplexes formed by natural human telomere sequences in K+ solution. Nucleic Acids Res. 35, 6517–6525. [DOI] [PMC free article] [PubMed] [Google Scholar]
- Prudencio M, Belzil VV, Batra R, Ross CA, Gendron TF, Pregent LJ, Murray ME, Overstreet KK, Piazza-Johnston AE, Desaro P, et al. (2015). Distinct brain transcriptome profiles in C9orf72-associated and sporadic ALS. Nat. Neurosci. 18, 1175–1182. [DOI] [PMC free article] [PubMed] [Google Scholar]
- Renton AE, Majounie E, Waite A, Simon-Sanchez J, Rollinson S, Gibbs JR, Schymick JC, Laaksovirta H, van Swieten JC, Myllykangas L, et al. (2011). A hexanucleotide repeat expansion in C9ORF72 is the cause of chromosome 9p21-linked ALS-FTD. Neuron 72, 257–268. [DOI] [PMC free article] [PubMed] [Google Scholar]
- Rode AB, Endoh T, and Sugimoto N (2016). tRNA shifts the G-quadruplex-hairpin conformational equilibrium in RNA towards the hairpin conformer. Angew. Chem. Int. Ed. Engl. 55, 14315–14319. [DOI] [PubMed] [Google Scholar]
- Rodriguez R, Miller KM, Forment JV, Bradshaw CR, Nikan M, Britton S, Oelschlaegel T, Xhemalce B, Balasubramanian S, and Jackson SP (2012). Small-molecule-induced DNA damage identifies alternative DNA structures in human genes. Nat. Chem. Biol. 8, 301–310. [DOI] [PMC free article] [PubMed] [Google Scholar]
- Rzuczek SG, Pilch DS, Liu A, Liu L, LaVoie EJ, and Rice JE (2010). Macrocyclic pyridyl polyoxazoles: selective RNA and DNA G-quadruplex ligands as antitumor agents. J. Med. Chem. 53, 3632–3644. [DOI] [PMC free article] [PubMed] [Google Scholar]
- Sabharwal NC, Savikhin V, Turek-Herman JR, Nicoludis JM, Szalai VA, and Yatsunyk LA (2014). N-methylmesoporphyrin IX fluorescence as a reporter of strand orientation in guanine quadruplexes. FEBS J. 281, 1726–1737. [DOI] [PMC free article] [PubMed] [Google Scholar]
- Siddiqui-Jain A, Grand CL, Bearss DJ, and Hurley LH (2002). Direct evidence for a G-quadruplex in a promoter region and its targeting with a small molecule to repress c-MYC transcription. Proc. Natl. Acad. Sci. U. S. A. 99, 11593–11598. [DOI] [PMC free article] [PubMed] [Google Scholar]
- Simone R, Balendra R, Moens TG, Preza E, Wilson KM, Heslegrave A, Woodling NS, Niccoli T, Gilbert-Jaramillo J, Abdelkarim S, et al. (2018). G-quadruplex-binding small molecules ameliorate C9orf72 FTD/ALS pathology in vitro and in vivo. EMBO Mol. Med. 10, 22–31. [DOI] [PMC free article] [PubMed] [Google Scholar]
- Simone R, Fratta P, Neidle S, Parkinson GN, and Isaacs AM (2015). G-quadruplexes: Emerging roles in neurodegenerative diseases and the non-coding transcriptome. FEBS Lett. 589, 1653–1668. [DOI] [PubMed] [Google Scholar]
- Su Z, Zhang Y, Gendron TF, Bauer PO, Chew J, Yang WY, Fostvedt E, Jansen-West K, Belzil VV, Desaro P, et al. (2014). Discovery of a biomarker and lead small molecules to target r(GGGGCC)-associated defects in c9FTD/ALS. Neuron 83, 1043–1050. [DOI] [PMC free article] [PubMed] [Google Scholar]
- Tabet R, Schaeffer L, Freyermuth F, Jambeau M, Workman M, Lee CZ, Lin CC, Jiang J, Jansen-West K, Abou-Hamdan H, et al. (2018). CUG initiation and frameshifting enable production of dipeptide repeat proteins from ALS/FTD C9ORF72 transcripts. Nat. Commun. 9, 152. [DOI] [PMC free article] [PubMed] [Google Scholar]
- Taylor JP (2014). Neurodegenerative diseases: G-quadruplex poses quadruple threat. Nature 507, 175–177. [DOI] [PubMed] [Google Scholar]
- Taylor JP, Brown RH Jr., and Cleveland DW (2016). Decoding ALS: from genes to mechanism. Nature 539, 197–206. [DOI] [PMC free article] [PubMed] [Google Scholar]
- Tran T, Childs-Disney JL, Liu B, Guan L, Rzuczek S, and Disney MD (2014). Targeting the r(CGG) repeats that cause FXTAS with modularly assembled small molecules and oligonucleotides. ACS Chem. Biol. 9, 904–912. [DOI] [PMC free article] [PubMed] [Google Scholar]
- Wales DJ, and Yildirim I (2017). Improving computational predictions of single-stranded RNA tetramers with revised α/γ torsional parameters for the Amber force field. J. Phys. Chem. B 121, 2989–2999. [DOI] [PubMed] [Google Scholar]
- Wang JM, Huang FC, Kuo MH, Wang ZF, Tseng TY, Chang LC, Yen SJ, Chang TC, and Lin JJ (2014). Inhibition of cancer cell migration and invasion through suppressing the Wnt1-mediating signal pathway by G-quadruplex structure stabilizers. J. Biol. Chem. 289, 14612–14623. [DOI] [PMC free article] [PubMed] [Google Scholar]
- Wang JM, Wolf RM, Caldwell JW, Kollman PA, and Case DA (2005). Development and testing of a general amber force field (vol 25, pg 1157, 2004). J. Comput. Chem. 26, 114–114. [DOI] [PubMed] [Google Scholar]
- Xu H, Di Antonio M, McKinney S, Mathew V, Ho B, O’Neil NJ, Santos ND, Silvester J, Wei V, Garcia J, et al. (2017). CX-5461 is a DNA G-quadruplex stabilizer with selective lethality in BRCA1/2 deficient tumours. Nat. Commun. 8, 14432. [DOI] [PMC free article] [PubMed] [Google Scholar]
- Yang WY, He F, Strack RL, Oh SY, Frazer M, Jaffrey SR, Todd PK, and Disney MD (2016). Small molecule recognition and tools to study modulation of r(CGG)exp in fragile X-associated tremor ataxia syndrome. ACS Chem. Biol. 11, 2456–2465. [DOI] [PMC free article] [PubMed] [Google Scholar]
- Yang WY, Wilson HD, Velagapudi SP, and Disney MD (2015). Inhibition of non-ATG translational events in cells via covalent small molecules targeting RNA. J. Am. Chem. Soc. 137, 5336–5345. [DOI] [PMC free article] [PubMed] [Google Scholar]
- Yildirim I, Stern HA, Kennedy SD, Tubbs JD, and Turner DH (2010). Reparameterization of RNA x torsion parameters for the AMBER force field and comparison to NMR spectra for cytidine and uridine. J. Chem. Theory Comput. 6, 1520–1531. [DOI] [PMC free article] [PubMed] [Google Scholar]
- Zamiri B, Reddy K, Macgregor RB Jr., and Pearson CE (2014). TMPyP4 porphyrin distorts RNA G-quadruplex structures of the disease-associated r(GGGGCC)n repeat of the C9orf72 gene and blocks interaction of RNA-binding proteins. J. Biol. Chem. 289, 4653–4659. [DOI] [PMC free article] [PubMed] [Google Scholar]
- Zhang AY, and Balasubramanian S (2012). The kinetics and folding pathways of intramolecular G-quadruplex nucleic acids. J. Am. Chem. Soc. 134, 19297–19308. [DOI] [PubMed] [Google Scholar]
- Zhang JH, Chung TD, and Oldenburg KR (1999). A simple statistical parameter for use in evaluation and validation of high throughput screening assays. J. Biomol. Screen. 4, 67–73. [DOI] [PubMed] [Google Scholar]
- Zu T, Liu Y, Banez-Coronel M, Reid T, Pletnikova O, Lewis J, Miller TM, Harms MB, Falchook AE, Subramony SH, et al. (2013). RAN proteins and RNA foci from antisense transcripts in C9ORF72 ALS and frontotemporal dementia. Proc. Natl. Acad. Sci. U. S. A. 110, E4968–4977. [DOI] [PMC free article] [PubMed] [Google Scholar]
- Zuker M (2003). Mfold web server for nucleic acid folding and hybridization prediction. Nucleic Acids Res. 31, 3406–3415. [DOI] [PMC free article] [PubMed] [Google Scholar]
Associated Data
This section collects any data citations, data availability statements, or supplementary materials included in this article.