

Abstract
Background
There are few reports on the comparative medical characteristics of type 2 diabetes models in late stage. An analysis of comparative medical characteristics of Zucker diabetic fatty type 2 diabetes mellitus (ZDF‐T2DM) rats during the course of development to late stage disease was performed.
Methods
In this study, ZDF rats were fed with high‐sugar and high‐fat diets to raise the fasting blood glucose, and develop of type 2 diabetes. At the late stage of T2DM, the preliminary comparative medical characteristics of the T2DM model were analyzed through the detection of clinical indicators, histopathology, related cytokine levels, and insulin‐related signaling molecule expression levels.
Results
In the T2DM group, the fasting blood glucose was higher than 6.8 mmol/L, the serum insulin, leptin, and adiponectin levels were significantly decreased, and glucose intolerance and insulin resistance were measured as clinical indicators. Regarding pathological indicators, a large number of pancreatic islet cells showed the reduction of insulin secretion, resulting in damaged glycogen synthesis and liver steatosis. At the molecular level, the insulin signal transduction pathway was inhibited by decreasing the insulin receptor substrate 1 (IRS1), insulin receptor substrate 2 (IRS2), phosphatidylinositol 3 kinase (PI3K), and glycogen synthesis kinase 3β (GSK‐3β) expression levels.
Conclusion
The results show that the ZDF/T2DM rats have typical clinical, histopathological, and molecular characteristics of human T2DM and thus can be used as an effective model for T2DM drug development and treatment of advanced T2DM.
Keywords: clinical indicators, histopathology, molecular expression, type 2 diabetes mellitus, Zucker diabetic fatty rats
1. INTRODUCTION
Diabetes is one of the three major noncommunicable diseases that threaten human health worldwide. The International Diabetes Federation (IDF) has reported that six million people die directly from diabetes every year, and an additional 318 million people are suffering with diabetes. The number of patients with diabetes is predicted to reach 642 million by 2040.1 Patients with type 2 diabetes account for more than 90% of diabetic patients, and the incidence is rising constantly. Diabetes causes a variety of complications, including renal failure, cardiovascular disease, neuropathy, and blindness. Many studies have shown that the primary cause of diabetes is damage to the secretory function of pancreatic β‐cells and insulin resistance in target tissues. The latter is an important pathophysiological characteristic.2 However, the etiology and pathogenesis have not been defined. Most insulin resistance is caused by signaling defects in insulin receptors in target tissues (ie, muscle, fat, or liver), such as insulin receptor substrate 1 (IRS1), insulin receptor substrate 2 (IRS2),3, 4 leptin receptor (LEPR),5 phosphatidylinositol 3 kinase (PI3K),6, 7 and glycogen synthesis kinase 3β (GSK3β).8, 9
Currently, the spontaneous T2DM rodent models used for experimental research include the Goto Kakisaki Wistar rats,10 KKAy mice,11 Zucker diabetic fatty rats,12 black line hamsters, Nagoya‐Shibata‐Yasuda mice, Psammomys obesus (PO),13 and Otsuka Lung‐Evans Tokushima Fatty (OLETF) rats and transgenic mice. Among these models, ZDF rats show characteristics such as obesity, hyperglycemia, insulin disorders, and dyslipidemia14 due to defects in the leptin receptor gene (LEPR), which closely match the pathological characteristics of type 2 diabetes mellitis (T2DM). Therefore, ZDF rats can provide an appropriate animal model for studies of T2DM. We used a high‐sugar and high‐fat diet to induce obesity in the ZDF rat model. We successfully constructed a type 2 diabetes mellitus model and evaluated the similarities between the ZDF rats and human T2DM in terms of clinical characteristics, pathological features, and pathogenesis. Our results show that ZDF rats provide a well‐matched T2DM animal model.
2. MATERIALS AND METHODS
2.1. Animals
Normal male rats (n = 8) and ZDF rats (n = 8) were purchased from Beijing Botai Hongda Biotechnology Company, and were fed with normal diets and high‐sugar and high‐fat diets, respectively. All animal experiments were performed in the Animal Experimental Barrier System of the Institute of Medical Biology and Chinese Academy of Medical Sciences. All experiments were approved by the Experimental Animal Ethics Committee of the Institute of Medical Biology at the Chinese Academy of Medical Sciences. The experimental animals were used in accordance with the principles of the 3Rs,15 and humane care was provided to the experimental animals, along with daily SPF‐class feed and clean drinking water. The ambient temperature was maintained at 20‐22°C, the daily temperature difference was less than 4°C, the humidity was 50%‐60%, the ammonia concentration was less than 14 mg/m3, the noise level was less than 60 dB, the illumination was 15‐20 lx, and the day and night cycles were 12 hours/12 hours. At the end of the experiment, the rats were sacrificed by euthanasia, with a 150 mg/kg dose of pentobarbital sodium intraperitoneally injected with anesthesia.
2.2. Monitoring of clinical indicators
Blood glucose was measured using the Roche blood glucose meter (ACCU‐CHEK® Performa). The changes in food intake, water drinking, body weight, and fasting blood glucose were monitored once per month for 4 months. Insulin resistance in the T2DM model rats was measured using a glucose tolerance test (GTT) and an insulin tolerance test (ITT). The GTT monitored changes in the blood glucose level in each group of rats at 0, 15, 30, 60, 90, and 120 minutes following an intraperitoneal injection of 50% glucose at a dose of a 2 g/kg after fasting for 16 hours. The ITT monitored levels in blood glucose at 0, 15, 30, 60, 90, and 120 minutes after a 1 U/kg intraperitoneal injection of human insulin (Novo Spirit) after 16 hours of fasting. Blood lipids were measured with a fully automated biochemical analyzer (AU400 Automatic Biochemical Analyser, Olympus) in blood samples collected after fasting for 16 hours. The serum leptin, insulin, and adiponectin levels were measured with ELISA kits (Beijing Bo Sheng Jingwei Technology Co., Ltd, Bossbio). HOMA‐IR is an indicator for evaluating the level of insulin resistance in an individual. The calculation method is as follows: Fasting blood glucose level (FPG, mmol/L) × fasting insulin level (FINS, mIU/L)/22.5 HOMA‐β is an index for evaluating islet β‐cell function in an individual. The calculation method is as follows: 20× fasting insulin level (FINS, mIU/L)/(fasting blood glucose level (FPG, mmol/L)‐3.5) (%).
2.3. Hematoxylin‐eosin staining
After the rats from each group were sacrificed, liver and pancreas samples were fixed with 4% formaldehyde, dehydrated, and embedded. A paraffin section (4 μm) was prepared and allowed to stand at 65°C for 30 minutes. The sections were dyed successively with xylene and anhydrous, 95%, 85%, 75%, and 65% ethanol. Next, the sections were stained with eosin (Fuzhou Maixin Biotechnology Development Co., Ltd) and hematoxylin (Biotechnology Development Co., Ltd), dehydrated with a reverse gradient of ethanols, sealed with a neutral resin, and analyzed under an optical microscope (Nikon Eclipse 80i).
2.4. Oil red O staining
Frozen liver tissue sections from each group of rats were activated with 60% isopropanol for 10 minutes and stained with oil red O for 30 minutes. They were then decolorized with 60% ethanol, washed with distilled water, stained with hematoxylin, stored in PBS, and observed for liver steatosis under a microscope.
2.5. Immunohistochemistry
Dewaxed paraffin pancreas sections were immersed in 3% sodium citrate buffer at pH 6.0, heated at 95°C for 12 minutes and slowly cooled to room temperature approximately 30 minutes, placed in a hydrogen peroxide solution for 10 minutes to block endogenous peroxidase activity, and washed with PBS three times. Next, the sections were incubated overnight at 4°C with an anti‐insulin primary antibody (GTX81555, Genetex, 1:200), incubated at room temperature for 60 minutes with the GM anti‐HRP‐labeled polymer (Gene Tech Shanghai Company Ltd.), and washed three times with PBS. Finally, the sections were observed by optical microscopy after staining with DAB and hematoxylin, and sealing the sections with a neutral resin.
2.6. Periodic acid‐Schiff staining
Dewaxed paraffin liver and muscle sections from each group of rats were oxidized with periodic acid for 10 minutes, stained with Schiff's liquid for 10 minutes, stained with hematoxylin, and sealed with neutral resin. Next, the glycogen synthesis ability of each group was evaluated by observing the amount of glycogen and muscle glycogen under a microscope.
2.7. Western blot analysis
Protein samples were extracted from the liver and muscle tissues were quantified using the BCA Protein Concentration Assay Kit (Kanka Century) and boiled to denature the proteins. Proteins isolated and purified from the 10% Bio‐Rad protein gel were transferred to a PVDF membrane using a semidry instrument (Bio‐Rad) and blocked with 5% skimmed milk for 2 hours. The target protein bands were cut according to the size of the marker, incubated at 4°C overnight with the corresponding primary antibodies IRS1 (abcam, ab40777, 1:1000), IRS2 (abcam, ab46811, 1:1000), PI3 kinase p85α (abcam, ab40755, 1:500), and GSK3β (abcam, ab131356, 1:1000), and later washed three times with TBST. Control samples were incubated with anti‐β‐actin (GeneTex, GTX629630, 1:4000) for 1 hour at room temperature and washed three times with TBST. Images were successfully collected, and the data were analyzed using the ECL chemiluminescence method and the Bio‐Rad ChemiDoc Touch system.
2.8. Data analysis
Western blot analysis was performed using the Image Lab software, and the results were graphed with the GraphPad Prism software. All data were expressed as the (x ± s, mean ± SEM). The statistical analysis was performed with the GraphPad Prism software. A paired t test was used for the comparisons. A value of P < 0.05 indicates a significant difference. Values of P < 0.01 and P < 0.001 indicated extremely significant differences.
3. RESULTS
3.1. linical index changes in the T2DM rat model
The daily food intake was significantly increased in the T2DM group (33.56 ± 8.81 g) compared with the control group (18.88 ± 2.81 g, P < 0.01). Daily drinking water consumption was significantly higher for the T2DM group (133.64 ± 78.18 mL) than for the control group (25.73 ± 4.48 mL, P < 0.01). However, there was no significant difference in body weights between the T2DM group (312.75 ± 102.70 g) and control group (252.56 ± 93.51 g) (Figure 1A). The fasting blood glucose concentration was 29.53 ± 3.24 mmol/L in the T2DM group and that in the control group was 4.52 ± 0.40 mmol/L, It indicated that Fasting blood glucose levels of T2DM group were significantly higher than control group. (P < 0.01) (Figure 1B, upper).
Figure 1.

The partial clinical index of each group of rats. A, the daily food intake, daily drinking water consumption and body weight of the T2DM group of rats were higher than that of the control group. B, curves for fasting blood glucose (upper), glucose tolerance test (middle), and insulin tolerance test (bottom) and the AUC analysis. C, serum insulin levels (upper left), insulin resistance index (right upper) and HOMA‐β index (lower left). D, levels of total cholesterol (TC), triglyceride (TG), high‐density lipoprotein (HDL) and low‐density lipoprotein (LDL) in each group of rats. All data are presented as means ± SEM (*P < 0.05; **P < 0.01; ***P < 0.001)
The GTT showed that the blood glucose levels of the control group reached maximum values at 15 minutes and then declined to 6.58 ± 0.88 mmol/L at 2 hours. However, blood glucose values in the T2DM group were 23.20 ± 5.87 mmol/L at 2 hours, which was higher than diagnostic criteria value of 11.1 mmol/L. The area under the curve (AUC) analysis showed that the concentration of blood glucose in the T2DM group was significantly greater than that in the control group (P < 0.01) (Figure 1B, middle). The ITT showed that the blood glucose levels in the control group steadily decreased to a low level (1.43 ± 0.67 mmol/L) after 2 hours, whereas in the T2DM group the blood glucose levels decreased slightly at 15 minutes and later gradually recovered to 7.20 ± 1.82 mmol/L after 2 hours, which was greater than 6.8 mmol/L. The AUC analysis showed that the plasma glucose level in T2DM group was significantly higher than that in the control group (P < 0.05) (Figure 1B, bottom).
The insulin levels in the T2DM group (3.78 ± 1.29 mU/L) were significantly lower than those in the control group (13.24 ± 1.67 mU/L) (P < 0.001) (Figure 1C, left). The insulin resistance index (HOMA‐IR) was significantly higher (5.33 ± 1.39) in the T2DM group than in the control group (2.48 ± 0.07) (P < 0.01) (Figure 1C, middle), whereas the HOMA‐β index (3.23 ± 1.31) was significantly lower in the T2DM group than in the control group (278.88 ± 107.32) (P < 0.01) (Figure 1C, right).
Finally, the levels of low‐density lipoproteins (LDL; 1.01 ± 0.08 mmol/L), high‐density lopiproteins (HDL; 2.62 ± 0.28 mmol/L), total cholesterol (TC; 6.70 ± 0.89 mmol/L), and triglycerides (TG; 4.87 ± 1.07 mmol/L) were significantly increased in the T2DM group vs those in the control group (P < 0.001) (Figure 1D).
3.2. Histopathological diagnosis in the T2DM rat model
A relatively irregular and disorderly cell pattern and a decrease in the number of cells was found in islet cells of ZDF‐T2DM rats compared with the cell pattern in normal pancreas (Figure 2A, left). Coagulative necrosis and sinusoidal expansion of bleeding were exhibited in liver cells in ZDF‐T2DM rats, accompanied by lymphocyte infiltration (Figure 2A, middle). We also observed glomerular swelling, partial vitreous changes, lymphocyte infiltration, partial necrosis of renal tubular epithelial cells, and edema in the T2DM group (Figure 2A, right). Additionally, oil red O staining results showed the presence of many red lipid droplets in the liver tissue sections from the T2DM group and an increase in abnormal lipid storage (P < 0.001) (Figure 2B). The insulin immunohistochemistry results showed that the pancreatic islets appeared as a clear brown positive reaction in the control group, indicating that the cells could secrete insulin normally. However, the brown positive reaction was weak in the T2DM group, which indicated an insulin secretory dysfunction. The difference between the two groups was very significant (P < 0.01) (Figure 2C).
Figure 2.
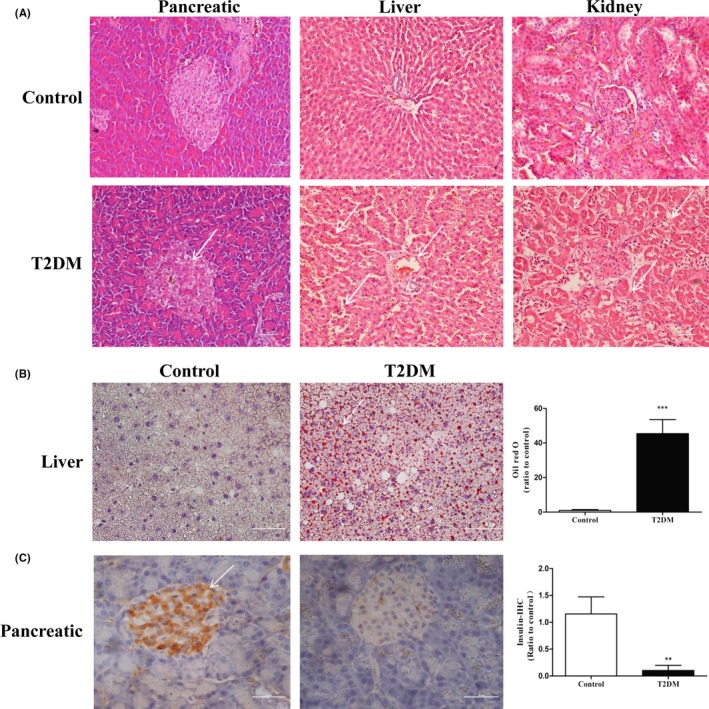
The partial histopathological diagnosis of each group of rats. A, analysis of HE staining in pancreas, liver, and kidney tissues. B, oil red O staining of liver tissue. C, immunohistochemical results showing insulin level of pancreatic tissue. All data are presented as means ± SEM (*P < 0.05; **P < 0.01; ***P < 0.001)
3.3. Decrease in leptin and adiponectin levels at the late stage of disease
The serum leptin levels were significantly lower in the T2DM group (1.23 ± 0.54 μg/L) than those in the control group (2.45 ± 0.72 μg/L) (P < 0.05) (Figure 3A). Similarly, the adiponectin level was significantly decreased in the T2DM group (4.50 ± 2.17 μg/L) compared with the control group (15.64 ± 5.93 μg/L) (P < 0.05) (Figure 3B).
Figure 3.
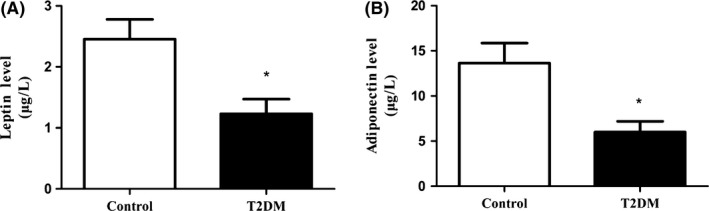
The leptin and adiponectin levels in each group of rats. A, levels of serum leptin. B, expression of plasma adiponnectin. All data are presented as means ± SEM (*P < 0.05; **P < 0.01; ***P < 0.001)
3.4. Impairment of the ability to synthesize glycogen in the T2DM rat model
The periodic acid‐Schiff (PAS) results showed that the liver glycogen content was significantly higher in the control group vs the T2DM group (P < 0.001) (Figure 4A). A large amount of glycogen was stored in the muscle cells of the control group, whereas less glycogen accumulated in the T2DM group (P < 0.001) (Figure 4B). These results indicated that the T2DM group of rats had a significantly reduced ability for glycogen synthesis.
Figure 4.
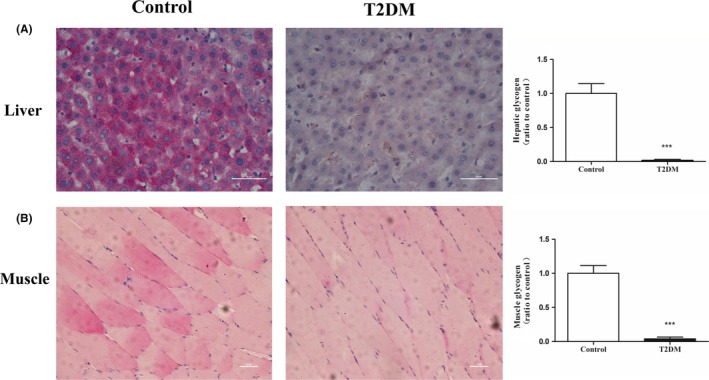
The glycogen contents of liver and muscle tissues were decreased in the T2DM group of rats. The PAS staining analysis demonstrated that the liver glycogen (A) and muscle glycogen (B) contents of the T2DM group were decreased. All data are presented as means ± SEM (*P < 0.05; **P < 0.01; ***P < 0.001)
3.5. Detection of insulin‐associated signal transduction molecules in the T2DM rat model by Western blot
The IRS1, IRS2, GSK‐3β, and PI3K expression levels measured by Western blot were significantly lower in the liver tissue from the T2DM group than those in the control group (P < 0.01) (Figure 5A). Similarly, IRS‐1, IRS‐2, PI3K, and GSK‐3β expression were significantly decreased in the muscle tissues from the T2DM group vs the control group (P < 0.05) (Figure 5B).
Figure 5.
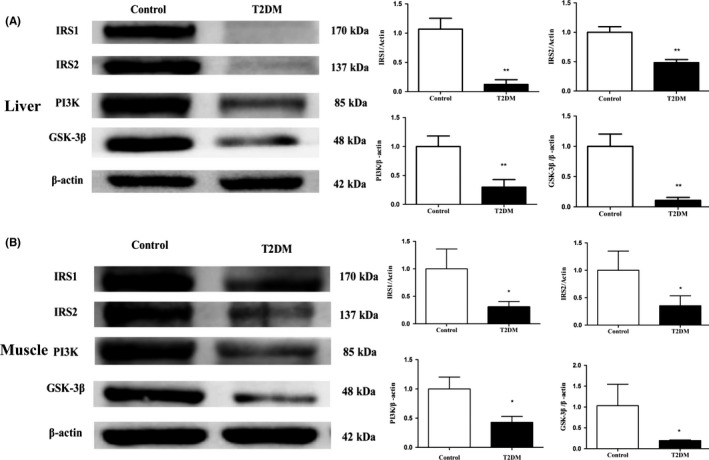
The expression levels of proteins related to glucose metabolism in the liver and muscle tissues. A, expression levels of IRS1, IRS2, PI3K, and GSK3β were decreased in the liver tissues of T2DM group of rats. B, similarly, the expression levels of IRS1, IRS2, PI3K, and GSK3β were decreased in the muscle tissues of the T2DM group. All data are presented as means ± SEM (*P < 0.05; **P < 0.01; ***P < 0.001)
4. DISCUSSION
With the increasing number of patients with type 2 diabetes, researches on the disease are also deepening. The pathogenesis of type 2 diabetes is complex and is primarily related to gene variation, internal and external environmental factors, abnormal protein modifications, epigenetic effects, oxidative stress and energy metabolism disorders.16, 17, 18 Building better animal models is the key to studying type 2 diabetes. ZDF rats are commonly used in the field of diabetes research, but there are few studies of the comparative medical characteristics of ZDF rats in the terminal stage of T2DM. In the present study, clinical indexes, pathology, and molecular expression were measured in ZDF rats with terminal T2DM to provide basic data for T2DM patients.
Our results showed that daily diet and drinking water were significantly increased in the T2DM group of rats vs the control group (P < 0.01). Although the difference in body weights between the two groups did not reach significance, the changes were characteristic of obesity seen with T2DM. Additionally, fasting blood glucose levels were significantly higher than 6.8 mmol/L in the T2DM group and were significantly different from those in the control group (P < 0.01). In the GTT test, 2‐hour postprandial blood glucose values of the T2DM group were higher than 11.1 mmol/L, indicating that the rats in the T2DM group had impaired glucose metabolism and glucose tolerance. In the ITT test, the blood glucose levels of the T2DM group of rats had decreased by 15 minutes, but were nonetheless significantly higher than those of the control (P < 0.05). The GTT and ITT trials initially demonstrated the clinical characteristics of type 2 diabetes in the T2DM rats. The results indicated that the T2DM group were glucose intolerant, which led to impaired glucose metabolism.19 Moreover, the serum insulin levels measured by ELISA were significantly lower in the T2DM group compared with the control group (P < 0.001). This finding indicated that insulin secretion was seriously insufficient in the T2DM group. We used the steady‐state model (HOMA) proposed by Mathhrow et al20 to further evaluate insulin resistance and islet β‐cell dysfunction in ZDF‐T2DM rats, and the results were consistent with the characteristics of patients in the advanced stage of T2DM. Additionally, the TC, TG, HDL, and LDL levels were all increased in the T2DM group (P < 0.001), which indicated that the T2DM group had a lipid metabolism disorder and hyperlipidemia.21 The insulin resistance caused by glucose metabolism disorders increased fat mobilization, and the lack of insulin increased the glucagon concentration and fat decomposition, resulting in an increased serum free fatty acid concentration. The liver provides abundant raw material for fat metabolism and thus synthesizes excess TG, whereas the lack of insulin reduces lipoprotein esterase activity and increases the blood lipoprotein concentration, resulting in abnormal lipid metabolism.22, 23, 24
In the histopathology analysis, using HE staining, hepatic cell edema and coagulation necrosis were observed in liver sections in the T2DM group. Fat vacuoles, central venous dilatation, lymphocyte infiltration, renal tubular epithelial cell shedding and edema, glomerular atrophy, nuclear pyknosis and dissolution, and inflammation were detected in the nephridial tissue sections. Pancreatic fibrosis, islet cell deletion, and lymphocyte infiltration were found in the pancreatic tissues. The liver tissue sections stained with oil red O showed a large number of red lipid droplets in the T2DM group, indicating the presence of steatosis in the liver. The liver is the central hub of fat metabolism, and dysfunction in any step of the fat metabolism process can cause steatosis, which primarily results from lipoprotein synthesis disorders, neutral fat synthesis, or a fatty acid oxidation disorder. These results indicated that the T2DM group of rats had lipid metabolism disorders. The clinical and histopathological indicators suggested that the clinical diagnostic characteristics of the T2DM animal model were similar to those of T2DM in human patients, and the pathogenesis and development of T2DM in the animal model were similar to those of T2DM.25, 26, 27
Glycogen and muscle glycogen accumulation were significantly lower in the T2DM group than in the control group, which indicated that the glycogen synthesis process was blocked. Moreover, the expression levels of IRS1, IRS2, PI3K, and GSK‐3β were significantly decreased in the liver and muscle tissues in the T2DM group compared with the control group. Many studies have suggested that insulin activates the downstream section of the PI3K/Akt signaling pathway by phosphorylating IRS1/IRS2 to regulate the glucose metabolism process.28 Our results suggested that the PI3K/Akt signaling pathway mediated the development of T2DM. Additionally, mutual regulation occurs between leptin, adiponectin, and insulin. Leptin inhibits the secretion of insulin in peripheral tissues,29 whereas adiponectin improves insulin sensitivity.30 The expression levels of leptin and adiponectin measured using ELISA were significantly reduced in the T2DM group. Therefore, we can speculate that the leptin receptor is not normally expressed in ZDF rats due to LEPR gene mutation, which means leptin cannot combine with the receptor to inhibit its normal function. These defects affect the regulation of leptin, adiponectin, and insulin, which would induce the reduction in insulin sensitivity, inhibit the PI3K/AKT signaling pathway, downregulate GSK‐3β expression, and ultimately block glycogen synthesis. Therefore, the important molecules IRS1 and IRS2, which mediate expression of insulin sensitivity, are significantly reduced in the course of late stage disease in the ZDF‐T2DM rats. This reduction seriously blocks the function of insulin and glucolipid metabolism.In summary, the clinical and pathological features of the ZDF rat model of type 2 diabetes are similar to those of T2DM patients. Thus, this model may be characterized as an ideal model for studying the pathogenesis of terminal stage of type 2 diabetes and the evaluation of new drugs.
CONFLICT OF INTEREST
None.
AUTHOR CONTRIBUTIONS
SYL conceived the idea and designed the experiment. YLP and JWH performed the main experiments, analyzed the data, and cowrote the main manuscript. GLL collected and detected serum samples. SYL revised the manuscript. YLP and JWH have contributed equally to this work. All authors read and approved the final manuscript.
ACKNOWLEDGEMENTS
We are indebted to Jiahong Gao and Jinling Yang for expert technical assistance with the fish facility. This work was supported by National Natural Science Foundation of China (No. 81570749, 81301073, 81571254), National Science and Technology Major Project of the Ministry of Science and Technology of China (No. 2017ZX09101003‐003‐008), Yunnan Natural Science Foundation (No. 2013FB089), the Fundamental Research Funds for the Central Universities (No. 33320140083), the CAMS Initiative for Innovative Medicine (2016‐I2M‐2‐006). The Special Funds for High‐level Health and Family Planning Technical Personnel training of Yunnan Province (No. D‐201653, 2017HB068).
Pang YL, Hu JW, Liu GL, Lu SY. Comparative medical characteristics of ZDF‐T2DM rats during the course of development to late stage disease. Animal Model Exp Med. 2018;1:203–211. 10.1002/ame2.12030
Funding information
National Natural Science Foundation of China (No. 81570749, 81301073, 81571254), National Science and Technology Major Project of the Ministry of Science and Technology of China (No. 2017ZX09101003‐003‐008), Yunnan Natural Science Foundation (No. 2013FB089), the Fundamental Research Funds for the Central Universities (No. 33320140083), the CAMS Initiative for Innovative Medicine (2016‐I2M‐2‐006). The Special Funds for High‐level Health and Family Planning Technical Personnel training of Yunnan Province (No. D‐201653, 2017HB068).
Yun‐Li Pang and Jing‐Wen Hu contributed equally to this work.
REFERENCES
- 1. Ogurtsova K, Da Rocha Fernandes JD, Huang Y, et al. IDF Diabetes Atlas: global estimates for the prevalence of diabetes for 2015 and 2040. Diabetes Res Clin Pr. 2017;128:40‐50. [DOI] [PubMed] [Google Scholar]
- 2. Kahn CR. Banting Lecture. Insulin action, diabetogenes, and the cause of type II diabetes. Diabetes. 1994;43(8):1066‐1084. [DOI] [PubMed] [Google Scholar]
- 3. Eckstein SS, Weigert C, Lehmann R. Divergent Roles of IRS (Insulin Receptor Substrate) 1 and 2 in Liver and Skeletal Muscle. Curr Med Chem. 2017;24(17):1827‐1852. [DOI] [PubMed] [Google Scholar]
- 4. Wei Y, Gao J, Qin L, et al. Tanshinone I alleviates insulin resistance in type 2 diabetes mellitus rats through IRS‐1 pathway. Biomed Pharmacother. 2017;93:352‐358. [DOI] [PubMed] [Google Scholar]
- 5. Adamia N, Virsaladze D, Charkviani N, Skhirtladze M, Khutsishvili M. Effect of metformin therapy on plasma adiponectin and leptin levels in obese and insulin resistant postmenopausal females with type 2 diabetes. Georgian Med News. 2007;145:52‐55. [PubMed] [Google Scholar]
- 6. Cao BY, Li R, Tian HH, et al. PI3K‐GLUT4 signal pathway associated with effects of EX‐B3 electroacupuncture on hyperglycemia and insulin resistance of T2DM rats. Evid Based Complement Alternat Med. 2016;2016:7914387. [DOI] [PMC free article] [PubMed] [Google Scholar]
- 7. Dai B, Wu Q, Zeng C, et al. The effect of Liuwei Dihuang decoction on PI3K/Akt signaling pathway in liver of type 2 diabetes mellitus (T2DM) rats with insulin resistance. J Ethnopharmacol. 2016;192:382‐389. [DOI] [PubMed] [Google Scholar]
- 8. Liu Y, Tanabe K, Baronnier D, et al. Conditional ablation of Gsk‐3beta in islet beta cells results in expanded mass and resistance to fat feeding‐induced diabetes in mice. Diabetologia. 2010;53(12):2600‐2610. [DOI] [PMC free article] [PubMed] [Google Scholar]
- 9. Nemoto T, Yanagita T, Kanai T, Wada A. Drug development targeting the glycogen synthase kinase‐3beta (GSK‐3beta)‐mediated signal transduction pathway: the role of GSK‐3beta in the maintenance of steady‐state levels of insulin receptor signaling molecules and Na(v)1.7 sodium channel in adrenal chromaffin cells. J Pharmacol Sci. 2009;109(2):157‐161. [DOI] [PubMed] [Google Scholar]
- 10. Portha B, Giroix MH, Tourrel‐Cuzin C, Le‐Stunff H, Movassat J. The GK rat: a prototype for the study of non‐overweight type 2 diabetes. Methods Mol Biol. 2012;933:125‐159. [DOI] [PubMed] [Google Scholar]
- 11. Chen LM, Li XW, Huang LW, Li Y, Duan L, Zhang XJ. The early pathological changes of KKAy mice with type 2 diabetes. Zhongguo Yi Xue Ke Xue Yuan Xue Bao. 2002;24(1):71‐75. [PubMed] [Google Scholar]
- 12. Clark JB, Palmer CJ, Shaw WN. The diabetic Zucker fatty rat. Proc Soc Exp Biol Med. 1983;173(1):68‐75. [DOI] [PubMed] [Google Scholar]
- 13. Miyake Y, Yamamoto K, Tsujihara N, Osawa T. Protective effects of lemon flavonoids on oxidative stress in diabetic rats. Lipids. 1998;33(7):689‐695. [DOI] [PubMed] [Google Scholar]
- 14. Etgen GJ, Oldham BA. Profiling of Zucker diabetic fatty rats in their progression to the overt diabetic state. Metabolism. 2000;49(5):684‐688. [DOI] [PubMed] [Google Scholar]
- 15. Aske KC, Waugh CA. Expanding the 3R principles: more rigour and transparency in research using animals. EMBO Rep. 2017;18(9):1490‐1492. [DOI] [PMC free article] [PubMed] [Google Scholar]
- 16. Uchigata Y. Pathogenesis, diagnosis, and treatment of type 2 diabetes in adolescence. Nihon Rinsho. 2016;74(Suppl 2):517‐522. [PubMed] [Google Scholar]
- 17. Benito LP, Garcia MR, Puig DM, et al. Pathological characteristics of patients with diabetes mellitus type 2, in Spanish Primary Care. Rev Clin Esp. 2004;204(1):18‐24. [DOI] [PubMed] [Google Scholar]
- 18. Ren CJ, Zhang Y, Cui WZ, Mu ZM. Progress in the role of oxidative stress in the pathogenesis of type 2 diabetes. Sheng Li Xue Bao. 2013;65(6):664‐673. [PubMed] [Google Scholar]
- 19. Shiota M, Printz RL. Diabetes in Zucker diabetic fatty rat. Methods Mol Biol. 2012;933:103‐123. [DOI] [PubMed] [Google Scholar]
- 20. Tang Q, Li X, Song P, Xu L. Optimal cut‐off values for the homeostasis model assessment of insulin resistance (HOMA‐IR) and pre‐diabetes screening: developments in research and prospects for the future. Drug Discov Ther. 2015;9(6):380‐385. [DOI] [PubMed] [Google Scholar]
- 21. Urbanova M, Haluzik M. The role of adipose tissue in pathogenesis of type 2 diabetes mellitus. Cesk Fysiol. 2015;64(2):73‐78. [PubMed] [Google Scholar]
- 22. Oku H, Tokuda M, Okumura T, Umino T. Effects of insulin, triiodothyronine and fat soluble vitamins on adipocyte differentiation and LPL gene expression in the stromal‐vascular cells of red sea bream, Pagrus major. Comp Biochem Physiol B Biochem Mol Biol. 2006;144(3):326‐333. [DOI] [PubMed] [Google Scholar]
- 23. Albalat A, Saera‐Vila A, Capilla E, Gutierrez J, Perez‐Sanchez J, Navarro I. Insulin regulation of lipoprotein lipase (LPL) activity and expression in gilthead sea bream (Sparus aurata). Comp Biochem Physiol B Biochem Mol Biol. 2007;148(2):151‐159. [DOI] [PubMed] [Google Scholar]
- 24. Hanyu O, Miida T, Obayashi K, et al. Lipoprotein lipase (LPL) mass in preheparin serum reflects insulin sensitivity. Atherosclerosis. 2004;174(2):385‐390. [DOI] [PubMed] [Google Scholar]
- 25. Siwy J, Zoja C, Klein J, et al. Evaluation of the Zucker diabetic fatty (ZDF) rat as a model for human disease based on urinary peptidomic profiles. PLoS ONE. 2012;7(12):e51334. [DOI] [PMC free article] [PubMed] [Google Scholar]
- 26. Fang FS, Tian H, Li CL, et al. The clinical characteristics and trend of conversion to type 2 diabetes mellitus of individuals with normal glucose tolerance‐hyperinsulinemia. Zhonghua Nei Ke Za Zhi. 2010;49(6):480‐483. [PubMed] [Google Scholar]
- 27. Gendeleka GF, Lakiza VV, Perstnev AI. The clinical characteristics of patients with type‐2 diabetes mellitus. Lik Sprava. 1996;5–6:109‐113. [PubMed] [Google Scholar]
- 28. Yin X, Xu Z, Zhang Z, et al. Association of PI3K/AKT/mTOR pathway genetic variants with type 2 diabetes mellitus in Chinese. Diabetes Res Clin Pract. 2017;128:127‐135. [DOI] [PubMed] [Google Scholar]
- 29. Benomar Y, Naour N, Aubourg A, et al. Insulin and leptin induce Glut4 plasma membrane translocation and glucose uptake in a human neuronal cell line by a phosphatidylinositol 3‐kinase‐ dependent mechanism. Endocrinology. 2006;147(5):2550‐2556. [DOI] [PubMed] [Google Scholar]
- 30. Olczyk P, Koprowski R, Komosinska‐Vassev K, et al. Adiponectin, leptin, and leptin receptor in obese patients with type 2 diabetes treated with insulin detemir. Molecules. 2017;22(8):1274. [DOI] [PMC free article] [PubMed] [Google Scholar]