Abstract
A new model is proposed based on signal transduction via G proteins for adaptation of the signal relay process in the cellular slime mold Dictyostelium discoideum. The kinetic constants involved in the model are estimated from Dictyostelium discoideum and other systems. A qualitative analysis of the model shows how adaptation arises, and numerical computations show that the model agrees with observations in both perfusion and suspension experiments. Several experiments that can serve to test the model are suggested.
1. INTRODUCTION
The cellular slime mold Dictyostelium discoideum (Dd hereafter) is a widely used system for the study of many developmental processes, including extracellular communication, signal transduction, chemotaxis, pattern formation, and differentiation [8]. In the presence of an adequate food supply the amoebas exist as free-ranging individuals, but when the food supply is exhausted an elaborate developmental program is initiated. After a period of starvation, cells attain relay competence, by which it is meant that they can detect an external cAMP pulse and respond to it by synthesizing and releasing cAMP. Experiments show that the response to cAMP has two separate components. One component is signal relay, which includes the adaptation of internal cAMP secretion to prolonged external cAMP stimuli. The other component includes cGMP synthesis and the effect of this on chemotaxis. Our objective here is to develop a new model for the cyclic AMP pathway and to explain how adaptation of the signal relay process occurs in this pathway. The cGMP pathway, which is linked to chemotaxis, is similar to the PI cycle found in mammalian cells [4, 15–17, 22]. Calcium is involved as a messenger in this pathway, and there appears to be some crosstalk between the chemotaxis-activating pathway and the signal relay pathway [41], but it is as yet not well enough defined to warrant detailed modeling.
There is a substantial body of experimental information on the input-output behavior of Dd under a variety of stimulus protocols [9–13], including short and prolonged stimuli and sequential stimuli. One important fact observed in these experiments is that the relay response adapts to constant stimuli over a range of four orders of magnitude in the stimulus amplitude. There are two components to relay adaptation: a rapid component that probably involves receptor modification and occurs on a time scale of minutes, and a slower component that involves down-regulation of receptors. Recent work on models of adaptation in signal relay are reported in [32]–[37], where an attempt was made to incorporate as many of the biochemical steps as possible. The two main biochemical pathways involved in the models are activation of adenylate cyclase via a simplified transduction scheme in which the enzyme and receptor are precoupled, and an inhibitory pathway in which calcium regulates the activity of the enzyme. The biochemical evidence for such control and the results of numerical computations that show that the input–output behavior of the cells is accurately described by this model are given in these papers. We will refer to this model as the Monk-Othmer model. The model developed here is similar in spirit but quite different in detail. Recent experimental evidence discussed later demonstrates the involvement of G proteins in the signal transduction pathway and shows that calcium is involved in the PI cycle pathway. This opens the way for a more detailed analysis of the signal transduction process and, in particular, raises the possibility that the rapid component of relay adaptation arises in the transduction pathway without any direct involvement of calcium. In the present model the inhibition arises from a parallel inhibitory channel that provides a type of feedforward control, whereas in the Monk-Othmer model the primary control is via direct feedback.
Signal transduction via G proteins has been studied in a number of systems, including Dd, but is best characterized in mammalian systems. Dd-specific results are given in Section 2, and suffice it here to say that it is reasonable to assume that there are Gs, and Gi proteins present in the membrane. In other systems it is known that they couple the effects of stimulus and inhibitor. We base the model for the adenylate cyclase–activating pathway on what is known for mammalian cells, but, of course, in Dd the stimulus signal and inhibitory signal coincide. Since the single external cAMP has the dual effect of stimulation and inhibition, it is necessary, in order to get adaptation, to have two different receptors for external cAMP, and we call these Rs, and Ri. A novel feature of our model is that the inhibitory effect of Gi is at the receptor level. The activated Gi binds with the cAMP–Rs, complex and terminates its capacity for activating Gs. The detailed rationale behind the model is given in Section 2. In Section 3 we derive the equations that describe the model. Conservation conditions and singular perturbation techniques are used to reduce the numbers of differential equations involved. Some qualitative analysis of the model is done in Section 4 in order to develop an intuitive understanding of how this model functions.
Numerical results are presented in Section 5. The results show good agreement with experimental data from perfusion experiments. As was found in previous papers [32–37], this implies that the model should also reproduce the results for suspension experiments and for wave propagation in aggregation fields. The former is verified in Section 6, and results on the latter will be reported elsewhere. The results suggest that the fast component of adaptation can arise entirely within the adenylate cyclase–activating pathway; no coupling to other components such as the calcium or PI cycles is needed. This does not rule out the possibility that the PI cycle is involved in the adaptation process in Dd, and there is evidence for crosstalk between the cAMP pathway and the PI cycle pathway in Dd [23, 41]. Of course, theoretical analysis can never prove a model, and some experiments to test it are proposed in Section 7. The predicted outcomes of the proposed experiments are obtained via computer simulations. In the Appendix we give estimates for the parameters involved in the system. Some of the data needed are available from experiments on Dd, and some are estimated from other systems.
2. THE SIGNAL PATHWAYS FROM STIMULUS TO cAMP GENERATION
2.1. HORMONAL CONTROL OF ADENYLATE CYCLASE ACTIVITY IN MAMMALIAN CELLS
Recent research on the role of G proteins in the activation of adenylate cyclase has established some of the main steps in transmembrane signal transduction in numerous systems [21, 26, 30, 43–45]. In this section we give a brief review of the results known for the mammalian cAMP pathway in order to establish a basis for the mathematical model developed later.
While there are different membrane-bound receptors for different stimuli in this pathway, they fall into two classes that are generally denoted Rs and Ri. Rs is the receptor for agonist signals Hs, such as epinephrine, glucagon, and the β-adrenergic agonists. Antagonist signals Hi are transduced through the Ri receptor, examples of which include the α2-adrenoceptor and the muscarinic M2 receptor. Ri receptors may also respond to stimulus hormones [3, 14,47], which is the case in Dd. The Rs receptors are coupled to a single pool of a G protein denoted Gs, which is a heterotrimeric protein comprising an αs subunit, a β subunit, and a γ subunit.
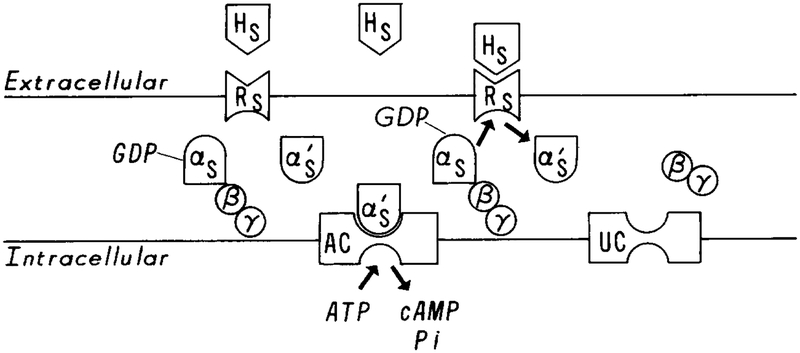
A typical scheme for signal transduction is shown in Figure 1. Upon binding of agonist to a receptor, the agonist–receptor complex HsRs catalyzes the conversion of Gs from the inactive GDP-binding state, to the active GTP-binding state, with the release of GDP and the βγ subunits. Binding of the active Gs protein, which we denote by or αsGTP, with the unactivated adenylate cyclase, which we denote UC, converts the latter into the activated cyclase AC. αsGTP is deactivated by the intrinsic GTPase activity of αs. Modulo the basal rate for the unactivated cyclase, the rate at which cAMP is produced is proportional to the amount of agonist present, and a constant level of stimulus can sustain a constant level of cAMP production in the absence of adaptation.
FIG. 1.
A schematic diagram of the activation of adenylate cyclase via Gs proteins. Hs denotes the stimulus signal, Rs the stimulus receptor, αsGDPβγ unactivated Gs protein, and UC unactivated adenylate cyclase. It is believed that upon binding of Hs with Rs, Gs is activated by the HsRs complex. This involves the release of the βγ subunits and the addition of GTP to the αs chain. αsGTP, which is denoted by in this figure, then activates adenylate cyclase, which catalyzes the conversion of ATP to cAMP.
The reactions in the inhibitory pathway are not as well established. It is known that a specific protein Gi, which is the transducer of inhibitory signals, exists in the membrane. The mechanism for activating Gi is the same as that for activating Gs: HiRi catalyzes the exchange of GTP for GDP on Gi, which decomposes into βγ and αiGTP. (or αiGTP), the active state of Gi, then turns off activation of adenylate cyclase by a mechanism that is not yet completely understood. Gi also has a three- subunit structure comprising αi, β, and γ subunits. The β and γ subunits are identical to the β and γ subunits of Gs, but αi is different from from αs.
Many of the details of the transducing process are not known, even in the best-characterized systems. Some of these are discussed briefly in order to explain how we arrived at the model.
• Is Gs precoupled with adenylate cyclase? The issue here is whether HsRs interacts with the GsUC complex, or whether HsRs interacts with Gs first, releasing , after which reacts with UC. Levitzki [27] argues that Gs is always coupled to adenylate cyclase in vivo. This argument is based on the work of Arad et al. [2] and on kinetic analysis, which indicates that the interaction between Gs and adenylate cyclase is not rate-limiting [27, 46]. Gilman [21] believes that this conclusion is not correct, based on the behavior in the presence of detergent and the excess of the amount of Gs over adenylate cyclase observed in vivo (cf. also [1] concerning the amounts of Gs and cyclase). Even though the experiments show that the rate is first-order in the hormone–receptor complex, one cannot conclude that Gs and UC are always bound; it may simply be that the rate of binding of to UC is large relative to other rates in the pathway, and this is what is assumed later in the model.
• Does interact directly with UC? In view of the fact that Gi and Gs have very similar structures, it is conceivable that interacts directly with adenylate cyclase, just as interacts with UC. If the inhibitory effect of is only competitive, then either there must be a large amount of present, or the binding of to UC must be very tight in order to turn off the signal. However, all attempts to identify a complex have failed [29]. Thus it is widely accepted that does not interact with UC directly to express the inhibitory effect.
• Does the subunit exchange hypothesis explain inhibition? Gilman proposed the “subunit exchange hypothesis” based on the observations that Gi is usually present at a higher concentration than Gs in vivo and that the subunits of β and γ in Gi and Gs are identical. He argued that the βγ subunits released by will have a much higher concentration than and can reduce the amount of free by displacing the reaction equilibrium toward the inactive Gs form [7, 19, 44].
There are several difficulties with this hypothesis, as was noted by Levitzki [29]. First, he argues that his recent work suggests that the βγ subunit plays no regulatory role. Second, if Gilman’s mechanism were operative, then the activation of any G protein with the same βγ subunit would result in the inhibition of adenylate cyclase, even if it is not in the pathway in question. In the analysis given in the following section it will be seen that even though βγ subunits may account for some inhibitory effect, it would not be enough to account for full adaptation in Dd.
• Does Gi or interact with HsRs? In [27] it is found that the β-adrenoceptor catalyzes the binding of GTPγS to Gi with an efficiency that is 30% of that for the activation of Gs. Levitzki remarks that “these interesting observations point to the possibility that Gi may mediate inhibition of adenylate cyclase not only directly on the catalytic subunit or via the βγ subunits released from Gi and scavenging αs, but also exerting its inhibitory effect on stimulatory receptors.” Thus, Gi does not have to carry out its inhibitory effect through the interaction with adenylate cyclase or Gs, but can do so through HsRs [28], which means that the effects of Gs and Gi are not symmetric. Levitzki suggests that in the absence of hormone, Rs, is bound with Gi, and that binding of hormone frees that receptor to catalyze the activation of Gs. However, in Dd the agonist and antagonist are identical, and it is difficult to see how the signal would be turned off. Later in this section we describe a scheme for Dd in which interacts directly with HsRs.
2.2. THE EVIDENCE FOR G PROTEIN-BASED TRANSDUCTION IN Dd
Several classes of cAMP receptors have been identified in Dd, and the dissociation constants for these receptors have been measured [49, 50]. Recently, significant progress has been made in understanding the signal pathway leading to the activation of adenylate cyclase. Gilman [21] set forth criteria for determining whether G proteins are involved in signal transduction, and van Haastert and coworkers [5, 40, 50] have concluded that the adenylate cyclase activation pathway in Dd meets several of these criteria. A Gα protein (Gα2) that may be involved in signal transduction has been identified, and since it does not have a site for ADP ribosylation catalyzed by pertussis toxin [18], it may be involved in the stimulatory channel.
In other systems pertussis toxin catalyzes the ADP ribosylation of αiGDP, which blocks its inhibitory effect. If there is a Gi protein that modulates inhibition in Dd, then one expects that adaptation would be abolished when pertussis toxin is applied, and this is precisely what is observed experimentally [39–41]. In the experiment the initial increase of cAMP was identical in control and pertussis toxin–treated cells, which suggests that activation of adenylate cyclase is not affected, but cAMP synthesis continued in toxin-treated cells, due to a strongly diminished desensitization. This suggests that pertussis toxin plays the same role in Dd as it does in mammalian cells. Gs is not affected by pertussis toxin; hence the stimulatory pathway is not affected.
It is also known that cAMP induces phosphorylation of the cAMP receptors in Dd [24, 25] and that this occurs on the same time scale as adaptation. Thus phosphorylation may be involved in adaptation, perhaps by interfering with the activation of a Gs protein. However, phosphorylation is not sufficient for adaptation, since pertussis toxin treatment blocks adaptation but does not interfere with receptor modification [40, 50]. This suggests that activation of a Gi protein is necessary for adaptation [42]. In our model we propose one scheme by which this might occur and show that it can produce the observed adaptation. To simplify the scheme we do not include a role for phosphorylation, but in the conclusion section we indicate how this can be incorporated and what effects this would have on the dynamics. This leaves us with three possible patterns of interactions for adaptation: (i) can interact with adenylate cyclase directly; (ii) may possibly turn off the signal by buffering via the βγ subunits; and (iii) can interact with cAMP–Rs directly.
(i) If the G protein network is as in other systems, then it is unlikely that interacts with adenylate cyclase directly, and the scheme shown in Figure 2, which was suggested in [39]–[41], is questionable. However, such a scheme is not unworkable, for if we suppose that interacts with to turn off the enzyme, then numerical simulations indicate that the experimental results can be reproduced. This point will be elaborated in the conclusion section.
FIG. 2.
The scheme of interactions for the regulation of AC proposed by van Haastert and coworkers [39–41].
(ii) The ratio of Gs to Gi is very important here. If the concentration of Gi is much greater than that of Gs, then it is possible that the βγ subunits released from Gi can buffer , and complete adaptation can result. However, if the concentration of Gs is greater than about 10% of Gi, there will be a significant amount of free and thus a significant steady-state rate of cAMP production, which is at variance with observations for Dd. Moreover, the concentrations of Gs and Gi proteins are approximately the same in Dd under the assumption that they are proportional to the concentrations of the corresponding receptors [49].
(iii) A model based on the interaction of with cAMP–Rs can explain the adaptation process and other experimental results. As we remarked earlier, it is difficult to obtain adaptation if Gi interacts directly with cAMP–Rs. Thus we propose the following scheme.
| (1) |
This mechanism is supported by several facts.
• It is found in other systems that an increase in the GTP concentration causes a decrease in the concentration of the HsRs complex but has little effect on the HiRi complex [27, 31]. In our mechanism the decrease in [HsRs] due to the increase in [GTP] is mediated through the increase in . The formation of and its rapid decomposition leads to a decrease in the concentration of the HsRs complex.
• The affinity of Rs for Hs is decreased in the presence of [31, 49]. In the proposed scheme this results from the rapid decomposition of the complex.
The detailed mechanism for relay adaptation, of which the above is one component, is described in the next section.
3. THE MATHEMATICAL MODEL
The reactions in the mechanism are as follows. Here and hereafter we use H to represent the extracellular cAMP stimulus.
(i) The Stimulus Pathway
| (2a) |
| (2b) |
| (2c) |
| (2d) |
| (2e) |
| (2f) |
| (2g) |
(ii) The Inhibitory Pathway
| (3a) |
| (3b) |
| (3c) |
| (3d) |
| (3e) |
| (3f) |
| (3g) |
| (3h) |
(iii) Production and Secretion of Intracellular cAMP
| (4a) |
| (4b) |
| (4c) |
| (4d) |
| (4e) |
The definition of the symbols used in these reactions is given in Table 1, as are the mathematical symbols used later. The function l5 is the secretion rate function, and we assume here that it is linear. In the perfusion experiments, the secreted cAMP must be distinguished from cAMP in the perfusate, since the former is radioactively labeled. We use an asterisk (*) to indicate the former.
TABLE 1.
The Variables and Their Symbols
| Pathway | Species | Concentration | Meaning Function |
|---|---|---|---|
| Stimulus | HRS | y1(t) | Stimulus receptor bound with cAMP |
| HRSGS | y2(t) | cAMP-Rs complex bound with Gs | |
| y3(t) | Activated Gs protein | ||
| y4(t) | Activated adenylate cyclase | ||
| αsGDP | y5(t) | Hydrolyzed | |
| Inhibitory | HRi | y6(t) | Inhibitory receptor bound with cAMP |
| HRiGi | y7(t) | cAMP-R; complex bound with Gi | |
| y8(t) | Activated Gi protein | ||
| y9(t) | Activated Gi bound with HRS | ||
| αiGDP | y10(t) | Hydrolyzed | |
| Generation and secretion | y11(t) | Activated AC bound with ATP | |
| cAMPi | y12(t) | Intracellular cAMP | |
| iPDE-cAMPi | y13(t) | Intracellular iPDE-cAMP complex | |
| Total amount of secreted cAMP |
The basic assumptions concerning the transduction component of the model are the following.
• The Gs and Gi proteins exist unbound in the membrane and act as shuttle messengers in the presence of cAMP. In the inactive GDP-bound form, the α subunit of each has a high affinity for the βγ subunit.
• The βγ subunit is released upon the activation of the G protein. The βγ subunits of Gs and Gi are identical.
• The roles of Gs and Gi are not symmetric. combines with inactive adenylate cyclase and transforms it to its active form, while combines with the activated form of Rs, cAMP–Rs, and converts it to its inactive form Rs by releasing cAMP.
• The hydrolyzation rates of , where x = s or i, are the same for all states, that is, for Gs, , , and for Gi, , . (This assumption is not essential and can be easily changed. In reality, , , and may have a higher rate of hydrolysis than and ).
There are three interacting pathways involved: (1) the stimulus pathway, which involves signal transduction from extracellular cAMP to Rs, from Rs to Gs, and from Gs to adenylate cyclase; (2) the inhibitory pathway, in which the extracellular signal is transduced into an inhibitory intracellular signal; and (3) the pathway for the generation and secretion of intracellular cAMP. If extracellular cAMP is a dynamic variable, as in the suspension experiments, the stimulus, production, and secretion pathways form a positive feedback loop. This loop is controlled by negative feedback from the parallel inhibitory pathway, as shown in Figure 3. Clearly the dynamics will depend strongly on the characteristic time scales of the positive and negative feedback loops. When viewed at the level of cAMP production, which is the output, these parallel pathways constitute a feedforward control loop in which the disturbance signal is measured, processed, and used to turn off cAMP production and secretion (see Figure 3). The preset value for the system is the basal cAMP turnover rate of UC. The external disturbance is the increase in the extracellular cAMP concentration. This increase is detected by the “observer” Ri and by the “processor,” which is the inhibitory pathway. The feedforward signal acts at Rs, and in this way the “disturbance” is greatly reduced before it enters the “system,” which comprises Gs and UC.
FIG. 3.
A schematic diagram of the interactions in the proposed model. An extracellular cAMP stimulus serves as both the stimulus and the inhibitory signal. Adaptation arises from the action of on the hormone–receptor cmplex. Viewed at the level of cAMP production, this interaction produces a feedforward mechanism for the control of cAMP production.
Certain of the species involved in the model are assumed to be constant, and their effects are included in the kinetic constants. These are GTP, GDP, ATP, Pi, AMP, and other species that may influence the reactions. Furthermore, in the “mechanism” given below, we neglect unimportant back-reactions and reactions that generate short-lived intermediates such as HRsαsGTPβγ and . Furthermore, we neglect the hydrolysis of activated adenylate cyclase bound with substrate, and we neglect the basal (unactivated) activity of the cyclase.
Notice that the nature of the reactions between and the cAMP–Rs complex is different than that of the reactions between and UC. The effect of is to increase the binding rate between ATP and adenylate cyclase by activating adenylate cyclase, while the effect of is to decrease the rate of the binding between extracellular cAMP and Rs by deactivating Rs. The rapid decomposition of accounts for the apparent loss of affinity of Rs for extracellular cAMP. Of course, once the complex decomposes, extracellular cAMP can bind to the bare receptor again. An increase in the GTP concentration will cause an increase of , which in turn causes a loss of affinity of Rs to extracellular cAMP and a decrease in the total amount of cMAI–Rs complex in the steady state.
For simplicity, we only display the differential equations for the variables y1–y14, since the remaining unknowns can be obtained from conservation conditions. There are seven conservation relations for the system, and the quantities that are determined by these relations are listed in Table 2. The differential equations for quantities in the stimulus pathway are
| (5) |
The differential equations for quantities in the inhibitory pathway are
| (6) |
The differential equations for the production and secretion of intracellular cAMP are
| (7) |
Here , , and .
TABLE 2.
The Quantities Determined by Conservation Conditions
| Species | Concentration | Definition |
|---|---|---|
| Rs | z1(t) | Free Rs in membrane |
| Gs | z2(t) | Free Gs in membrane |
| UC | z3(t) | Free adenylate cyclase in the membrane |
| Ri | z4(t) | Free Ri in the membrane |
| Gi | z5(t) | Free Gi in the membrane |
| βγ | z6(t) | Free βγ subunits in the membrane |
| iPDE | z7(t) | Free PDE in the cytoplasm |
The conservation relations that determine the dependent variables zi, i = 1, …,7, are
| (8) |
where subscript T denotes the initial value of a quantity. When these are solved for the zi and the solutions used in (5)–(7), the result is a system of 13 equations in y1, …, y13, with at worst quadratic nonlinearities. The reader can easily show that the flow associated with these equations preserves positivity, that is, solutions of these equations that begin in the nonnegative cone of composition space remain there. Furthermore, it is easy to see that y1, …, y11 and y13 remain bounded for all time, and the bounds are given in Table 3. If appropriate assumptions are made about the secretion function and the rate constants for adenylate cyclase and intracellular phosphodiesterase, then the same is true of y12. Thus the governing equations are well-posed in the mathematical sense.
TABLE 3.
Bounds for the Independent and Dependent Dimensional Variables
| 0 ⩽ y1 ⩽ [Rs]T | 0 ⩽ y8 ⩽ [Gi]T | 0 ⩽ z1 ⩽ [Rs]T |
| 0 ⩽ y2 ⩽ min([Rs]T, [Gs]T) | 0 ⩽ y9 ⩽ min([Rs]T, [Gs]T) | 0 ⩽ z2 ⩽ [Gs]T |
| 0 ⩽ y3 ⩽ [Gs]T | 0 ⩽ y10 ⩽ [Gi]T | 0 ⩽ z3 ⩽ [UC]T |
| 0 ⩽ y4 ⩽ min([Gs]T, [UC]T) | 0 ⩽ y11 ⩽ min([Gs]T, [UC]T) | 0 ⩽ z4 ⩽ [Ri]T |
| 0 ⩽ y5 ⩽ [Gs]T | 0 ⩽ y12 ⩽ ∞ | 0 ⩽ z5 ⩽ [Gi]T |
| 0 ⩽ y6 ⩽ [Ri]T | 0 ⩽ y13 ⩽ [iPDE]T | 0 ⩽ z6 ⩽ [Gs]T + [Gi]T |
| 0 ⩽ y7 ⩽ min([Ri]T, [Gi]T) | 0 ⩽ z7 ⩽ [iPDE]T |
4. ANALYSIS OF THE MODEL
In this section we describe the qualitative behavior of the model, we do a reduction that simplifies the system, and we analyze various components of the dynamics.
4.1. A QUALITATIVE DESCRIPTION OF ADAPTATION AND DEADAPTATION IN THE MODEL
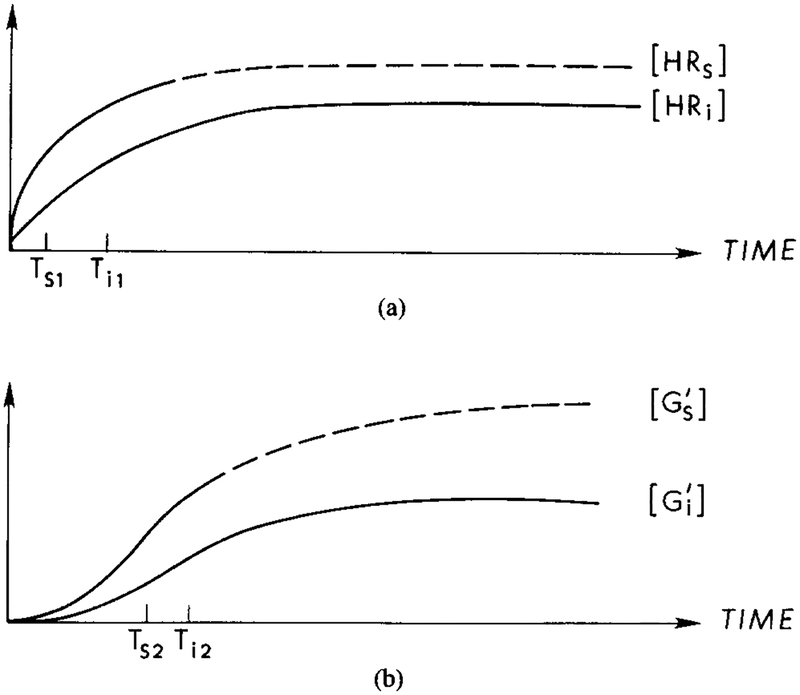
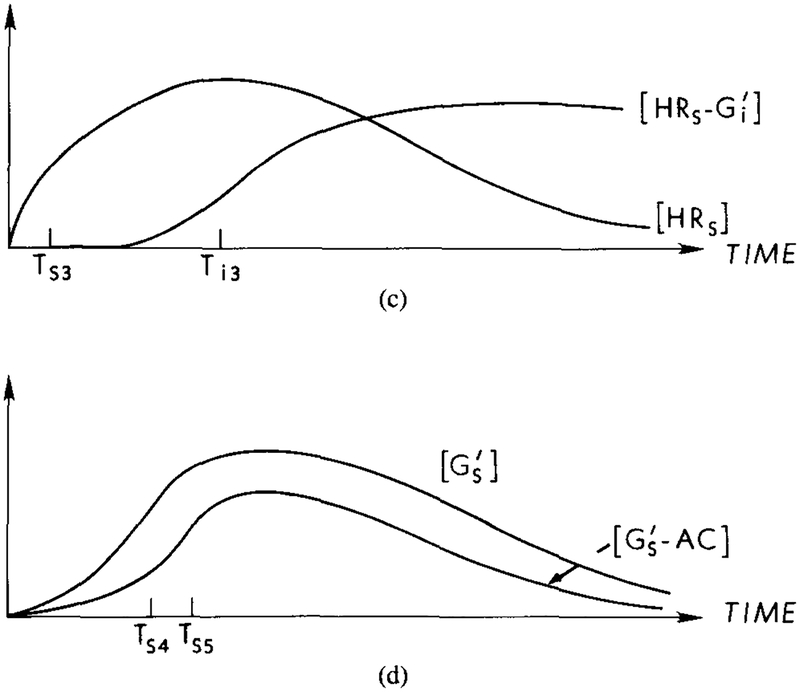
Suppose that a step change in the extracellular concentration of cAMP is introduced in a perfusion apparatus. Since agonist and antagonist are the same in Dd, and will be produced simultaneously. activates UC, while combines with HRs to deactivate it. This blocks the further production of , and the produced in response to the step will be degraded by hydrolysis. Thus there will be an initial burst of cAMP produced, but the activated adenylate cyclase will decay due to the hydrolysis of . If a higher concentration is presented, then a new burst of and will be produced. As we shall see, if the time scales in the stimulatory and inhibitory channels are adjusted properly, this mechanism can produce the full range of observations in perfusion and suspension experiments. The qualitative time course of the various species following a step change in cAMP is shown in Figure 4. In [39], cAMP secretion was compared in pertussis-treated and untreated cells, and it was found that for the first 30 s of stimulus the secretion rates were the same. This indicates that the lag time in the inhibitory pathway, which is Ti1 + Ti2 in Figure 4, is of the order of 30 s.
FIG. 4.
A qualitative description of latency and adaptation in the signal transduction process under a constant stimulus. The time for activation of G protein is the major component of the latency between stimulus arrival and activation of the adenylate cyclase. Adaptation at the receptor level results from the interaction of with HRs, which reduces the amount of activated Gs and cyclase. (a) Response curves for HRs and HRi under a constant stimulus. Ts1 and Ti1, represent the half-maximal times for the respective components. The dashed line indicates the response for HRs in the absence of an inhibitory effect. (b) Response curves for the concentrations of and . Ts2 and Ti2 represent the half-maximal times for the respective components. The dashed line indicates the response if the inhibitory effect is not present. (c) In the presence of , HRs is diminished due to the formation of . The half-maximal time, Ts3, for HRs in the presence of is approximately the same as Ts1, whereas Ti3 > Ti2. (d) Response curves for the concentration of and . The half-maximal time for , Ts4, is approximately equal to Ts2, whereas the half-maximal time for , Ts5, is greater than Ts4. The rate of cAMPi production is proportional to the concentration of GsAC.
If a constant cAMP stimulus that has been held long enough to produce full adaptation is terminated, the concentration of the HRs and HRi complexes will decay. Decay of HRi, produces no new , and the amount of will decrease due to hydrolysis. Under the assumption that hydrolysis is first-order in the substrate, deadaptation occurs at an exponential rate when the stimulus is withdrawn.
4.2. NONDIMENSIONALIZATION AND REDUCTION OF THE EQUATIONS
Nondimensionalization.
We start by introducing dimensionless variables for the 14 independent concentration variables. The choices of dimensionless variables depend on the estimates of kinetic parameters, which are derived in the Appendix. The results are summarized in Tables 4 and 5.
TABLE 4.
Estimates of the Kinetic Parameters
| Pathway | Parameter | Estimated value | Source |
|---|---|---|---|
| Stimulus | k1 | 7.5 s−1 μM−1 | van Haastert and de Wit [49] |
| k−1 | 0.45 s−1 | van Haastert and de Wit [49] | |
| k2 | 1.0 × 10³ m2/(μmol·s) | Gilman [21] | |
| k−2 | 0.0 s−1 | Gilman [21] | |
| k3 | 1.0 × 10³ s−1 | Gilman [21] | |
| k4 | 1.0 × 10⁴ m2/(μmol·s) | ||
| k−4 | 0.0 s−1 | ||
| k5 | 0.0625 s−1 | Gilman [21] | |
| k6 | 1.0 × 10⁵ m2/(μmol·s) | ||
| Inhibitory | h1 | 2.2 s−1 μM−1 | van Haastert and de Wit [49] |
| h−1 | 1.0 s−1 | van Haastert and de Wit [49] | |
| h2 | 40.0 m2/(μmol·s) | Dinauer et al. [13] | |
| h−2 | 0.0 s−1 | Dinauer et al. [13] | |
| h3 | 4.0 × 10² s−1 | Dinauer et al. [13] | |
| h4 | 5.0 × 10⁶ m2/(μmol·s) | ||
| h−4 | 0.0 s−1 | ||
| h5 | 7.5 × 10⁻³ s−1 | Gerisch and Wick [20] | |
| h6 | 17.0 s−1 | van Haastert and de Wit [49] | |
| h7 | 105 m2/(μmol·s) | ||
| cAMP generation and secretion | l | 20.2 s−1 | Levitzki [29] |
| l−1 | 20.2 s−1 | Levitzki [29] | |
| l2 | 202 s−1 | Levitzki [29] | |
| l3 | 5.0 × 10⁻⁴ m3/(μmol·s) | Rapp et al. [37] | |
| l−3 | 0.0 s−1 | Rapp et al. [37] | |
| l4 | 50 s−1 | Rapp et al. [37] | |
| l5 | 0.157 s−1 |
TABLE 5.
Estimates for the Fixed Concentrations
| Quantity conserved | Molecules per cell | Standard concentration |
|---|---|---|
| [Rs]T, [Gs]T, [UC]T | 3.84 × 10⁴ | 1.67 × 10⁻⁴ μmol/m2 |
| [RilT [Gi]T | 5.76 × 10⁴ | 2.50 × 10⁻⁴ μmol/m2 |
| [iPDE]T | 7.28 × 10⁵ | 1.73 × 10³ μmol/m3 |
After nondimensionalization, one finds that the dimensionless variables fall into two categories: those that reach a pseudo-steady state rapidly, which we call the singular variables, and the remainder, which we call nonsingular variables. The mathematical symbols for singular variables are vi, i = 1, …,6, and for nonsingular variables ui, i = 1, …,8. The dimensionless variables and their relationship to the corresponding dimensional variables are listed in Table 6. The nondimensionalization gives rise to a number of small parameters, which are defined in Table 7. Other dimensionless kinetic parameters are listed in Table 8. Note that corresponds to .
TABLE 6.
The Relationship Between Dimensional and Dimensionless Variables
| Species | Dimensional form | Dimensionless form | |
|---|---|---|---|
| Stimulus pathway | HRS | y1 | u1 = y1/[Rs]T |
| HRSGS | y2 | ||
| y3 | u2 = y3/[Gs]T | ||
| y4 | u3 = y4/[UC]T | ||
| αsGDP | y5 | v2 = (k6/k5)y5 | |
| Inhibitory pathway | HRi | y6 | u4 = y6/[Ri]T |
| HRiGi | y7 | ||
| y8 | u5 = y8/[Gi]T | ||
| y9 | u5 = y8/[Gi]T | ||
| αiGDP | y10 | v4 = (h7/h5)y10 | |
| cAMP generation and secretion | y11 | ||
| cAMPi | y12 | u7 = y12/[iPDE]T | |
| iPDE-cAMPi | y13 | ||
| Time scale | t | τ = k5t |
TABLE 7.
The Small Dimensionless Kinetic Parameters and Their Values
| Small parameter | Relation to dimensional parameters | Value |
|---|---|---|
| ϵ1 | k5/(k−2 + k3) | 6.25 × 10⁻⁵ |
| ϵ2 | k5/k6[Gs]T | 3.74 × 10⁻⁴ |
| ϵ3 | k5/(h−2 + h3) | 1.56 × 10⁻⁴ |
| ϵ4 | k5/h7[Gi]T | 2.50 × 10⁻⁴ |
| ϵ5 | k5/(l−1 + l2) | 2.81 × 10⁻⁴ |
| ϵ6 | k5/(l−3 + l4) | 1.56 × 10⁻³ |
TABLE 8.
Other Dimensionless Parameters and Their Values
| Dimensionless parameter | Relation to dimensional parameter | Value | |
|---|---|---|---|
| Stimulus Pathway | αH | (k1/k5)H(t) | 120 μM−1 × H(t) |
| αl | k−1/k5 | 7.2 | |
| α2 | k2[Gs]T/k5 | 2.67 | |
| α3 | k3/(k−2 + k3) | 1.0 | |
| α4 | k4[Gs]T/k5 | 26.7 | |
| Inhibitory Pathway | βH | (h1/k5)H(t) | 35.2 μM−1 × H(t) |
| β1 | h−1/k5 | 16.0 | |
| β2 | h2[Gi]T/k5 | 0.16 | |
| β3 | h3/(h−2 + h3) | 1.0 | |
| β4 | h4[Gi]T/k5 | 2.0 × 10⁴ | |
| β5 | h5/k5 | 0.12 | |
| β6 | h6/k5 | 272.0 | |
| cAMP generation and secretion | γ1 | l1/k5 | 323.2 |
| γ2 | 0.048 | ||
| γ3 | (l−3 + l4)/l3[iPDE]T | 57.7 | |
| γ4 | l4/k5 | 800.0 | |
| γ5 | l5/k5 | 0.224 | |
| Independent concentrations | cl | [Rs]T/[Gs]T | 1.0 |
| c2 | [Ri]T/[Gi]T | 1.0 | |
| c3 | [Rs]T/[Gi]T | 0.668 | |
| Dependent concentrations | c4 | [UC]T/[Gs]T | 1.0 |
| cl/c3 | [Gi]T/[Gs]T | 1.5 |
The dimensionless form of (5)–(7), wherein the conservation equations have been used to remove zi, is as follows. The differential equations for the singular variables are
| (9) |
and the differential equations for the nonsingular variables are
| (10) |
Upper and lower bounds for the solution in dimensionless terms are given in Table 9. In deriving these it is assumed that the initial conditions satisfy the conservation equations and lie inside the bounded region.
TABLE 9.
Bounds for the Dimensionless Variables
| Nonsingular variable | Singular variable |
|---|---|
| 0 ⩽ u1 ⩽ 1 | |
| 0 ⩽ u2 ⩽ 1 | 0 ⩽ v2 ⩽ k6[Gs]T/k5 |
| 0 ⩽ u3 ⩽ min(l, [Gs]T/[UC]T) | |
| 0 ⩽ u4 ⩽ 1 | 0 ⩽ v4 ⩽ h7[Gi]T/h5 |
| 0 ⩽ u5 ⩽ 1 | |
| 0 ⩽ u6 ⩽ min(l,[Gi]T/[Rs]T) | 0 ⩽ v6 ⩽ (l−3 + l4)/l3[iPDE]T |
| 0 ⩽ u7 ⩽ ∞ |
Simplification via Singular Perturbation.
On the τ time scale, the singular equations can be reduced to the algebraic system
| (11) |
The solution of this system to within terms of is
| (12) |
If we replace the vi in Equation (10) by their pseudo-steady-state values given by Equation (12), then we get an ordinary differential equation system with seven independent variables. We can also approximate this differential equation system by dropping the and higher order terms, where ϵ ≡ max{ϵi}. After some simplifications, we obtain the following system.
| (13) |
4.3. ANALYSIS OF THE COMPONENT STEPS
We next analyze the qualitative dynamics of the model. For convenience in relating the results to the biochemical steps, we do this in terms of the dimensional quantities. First we analyze various individual steps by uncoupling the pathways. The second part is devoted to the study of the coupled system. In this case the dynamics cannot be analyzed directly, but with certain simplifications we can analyze the steady-state behavior. This provides some qualitative understanding of how adaptation arises.
The Dynamics of G-Protein Activation.
We first suppose that k4 = h4 = 0, which suppresses activation of AC and inactivation of HRs. This enables us to uncouple the three pathways and study the dynamics of G-protein activation.
First consider the binding to Rs, for which the reactions are (2a) and (2b). We invoke the pseudo-steady-state assumption for [HRsGs] to reduce the degrees of freedom, by setting
In this way, we obtain the usual expression
and according to our estimates of parameters,
Hence the amount of HRsGs is very small compared to [HRS], and therefore we have the approximation
or equivalently,
| (14) |
Thus the response is
| (15) |
where Kd ≡ k−1/k1 is the dissociation constant. This process is fast because k−1 is relatively large. The half-time for this process is
and the steady-state response is
| (16) |
where [·]s denotes the steady-state concentration of a species. A similar analysis can be done for the binding of cAMP to Ri.
Next we consider the activation of Gs by HRs. The reactions involved are (2b), (2c), (2e), and (2g). Our estimates of the parameters (cf. Appendix) shows that k6 is very large. Hence [αsGDP] is small, and we simplify the analysis by setting [αsGDP] = 0. The simplified reaction and conservation equations are
and therefore
| (17) |
where kon = k2k3/(k−2 + k3)[HRs]. Here kon is not a constant but is time-dependent. When the stimulus level is higher than 0.1 μM, the binding step is much faster than the activation of . Hence we can suppose that the binding is in equilibrium and use the value of [HRs] given by (16) in kon. Consequently,
| (18) |
When [H] is smaller than 0.1 μM, the speed of the binding step is comparable to that of activation of Gs. In this case we cannot get an explicit solution, but in any case, the half-time for this response is estimated by
Using the estimate of kon and koff, we find that
Thus the steady-state response is given by
| (19) |
A similar analysis can be done for the activation of Gi. The biochemical reactions involved are (3b), (3c), (3e), and (3h), since . Because h7 is large, we neglect [αiGDP] and obtain the approximate solution
| (20) |
where hon = [h2h3/(h−2 + h3)][HRi]. The half-time for this response is
and using our estimates of hon and hoff we obtain
Thus in the absence of coupling, the delay in the buildup of is of the same order as the observed adaptation time.
The steady-state response is given by
Table 10 shows the steady-state response of receptor binding and activation of the G proteins for different stimulus levels, using the parameter values estimated in the Appendix. From this table one sees how the fractions of the activated G proteins depend on the stimulus level.
TABLE 10.
The steady-state response of uncoupled stimulus and inhibitory pathways to external cAMP stimuli
| [H](μM) | 10−4 | 10−3 | 10−2 | 10−1 | 1 | 10 |
|---|---|---|---|---|---|---|
| 0.17% | 1.64% | 14.3% | 62.5% | 94.0% | 99.4% | |
| 0.022% | 0.22% | 2.15% | 18% | 69.0% | 95.7% | |
| 0.45% | 4.36% | 27.7% | 62.6% | 71.5% | 72.7% | |
| 0.03% | 0.29% | 2.79% | 19.4% | 47.9% | 57.1% |
A Steady-State Analysis of the Coupled System.
In this section, we will do the steady-state analysis for the coupled pathways, that is, for the case of k4 ≠ 0 and h4 ≠ 0. The three pathways are coupled, and we cannot obtain an explicit solution, but we can obtain some quantitative insight into adaptation.
The binding of external stimulus H with Ri is the same as in the case for the decoupled system, but will be different, since a fraction of the will be bound to HRs. Since we assume that decays at the same rate irrespective of what form it is in, we may consider the combined concentration of the two forms of , namely, and .
Let denote this quantity:
| (21) |
Reactions (3d) and (3g) do not alter , and therefore it is dynamically equivalent to in the preceding analysis. As a result,
| (22) |
Now consider the equations for [HRs] and . The differential equations are
| (23) |
This system is closed since is given by (22), but we cannot find an explicit solution to it. Therefore we only do the steady-state analysis in order to obtain some insight as to how adaptation works in this step. With some simplifications we obtain the system
| (24) |
where is given in (16). The approximate solution is
| (25) |
and since u1 = [HRs]/[Rs]T, this represents the unadapted portion of [HRs]. From this equation one can deduce the following:
• An increase in h4 causes a decrease in [HRs]s, by virtue of reaction (3d).
• An increase in causes a decrease in [HRs]s. This can occur, for example, by increasing hon or [Gi]T.
• An increase in h6 leads to an increase in [HRs]s, because decomposes faster.
One of the basic assumptions given in Section 3 is that the is hydrolyzed at the same rate irrespective of whether it is in free or bound form. An argument similar to that used to obtain shows that the combined concentrations of , , and , which we denote , is the same as the concentration of in the uncoupled system. Since [HRs] is very small at steady state (see Table 11), it follows from (19) that and , are small. The last row of Table 11 gives the values of corresponding to the parameters given in the Appendix. Thus we see that adaptation of internal cAMP production and secretion results from adaptation at the level of the stimulatory receptor.
TABLE 11.
The Steady-State Concentrations of Components in the Transduction Steps
| [H] (μM) | 10−4 | 10−3 | 10−2 | 10−1 | 1 | 10 |
|---|---|---|---|---|---|---|
| 0.022% | 0.22% | 2.15% | 18.0% | 69.0% | 95.7% | |
| 0.03% | 0.29% | 2.79% | 19.4% | 47.9% | 57.1% | |
| 0.093% | 0.18% | 0.21% | 0.30% | 1.01% | 4.33% | |
| 0.03% | 0.058% | 0.067% | 0.096% | 0.32% | 1,37% |
5. NUMERICAL RESULTS
5.1. THE DYNAMICS OF THE UNCOUPLED SYSTEM
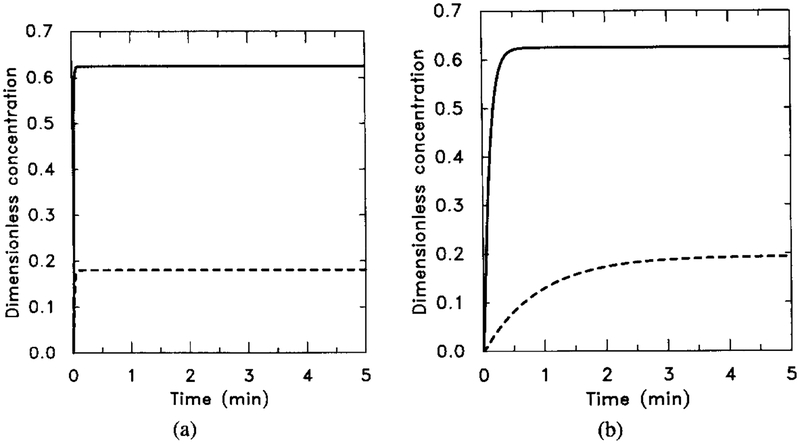
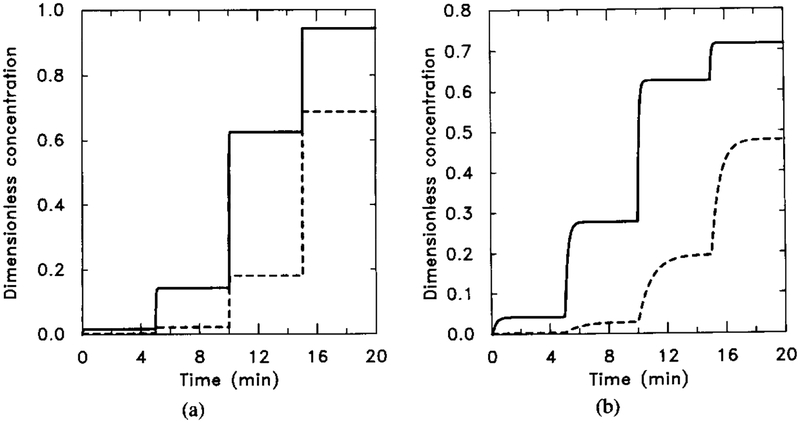
In the first set of simulations we let k4 = h4 = 0, with other parameters held at the values estimated in the Appendix. Typical response curves are shown in Figure 5 for a single-step stimulus. One can see that the response of both HRs and HRi is rapid; both reach their steady-state value within seconds. On the other hand, and increase on a much slower time scale, with the former increasing more rapidly and to a higher level than the latter.
FIG. 5.
The response of the uncoupled system. The stimulus is [H] = 0.1 μM for t ∈ (0, 5). The numerical results can be compared with the analytical results obtained from the analysis in Section 4 and with Figure 6 to verify the steady-state additivity of the uncoupled system. (a) The dimensionless concentrations of HRs (solid line) and HRi (dashed line). (b) The dimensionless concentrations of (solid line) and (dashed line). Note that the half-time for the buildup of agrees well with the theoretical estimate but that the rise time for is longer than the theoretical estimate. This discrepancy indicates that the pseudo-steady-state hypothesis applied to [HRsGs] is probably not valid on this time scale.
If the steady-state response for a certain level of stimulus is independent of the stimulus history, then we say that the system exhibits steady-state additivity. This property is illustrated in Figure 6, where we show the response to a sequence of lo-fold increases in the stimulus. Comparison of Figures 5 and 6 shows that the steady-state response to a single step to H = 0.1 μM is the same as the response to a multistep stimulus ending at the same level, but the time-dependent portions of the responses are completely different.
FIG. 6.
The response of the uncoupled system to sequential increases of the stimulus. The sequence is [H] = 0.001 μM for t ∈ (0, 5); [H] = 0.001 μM for t ∈ (5, 10); [H] = 0.1 μM for t ∈ (10, 15); and [H] = 1.0 μM for t ∈ (15, 20). (a) The dimensionless concentrations of HRs (solid line) and HRi (dashed line). (b) The dimensionless concentrations of (solid line) and (dahsed line).
The numerical responses for [HRs], [HRi], , and are consistent with the results obtained from the qualitative analysis, which justifies the approximations we made in the previous section. We shall see later that [HRs] changes significantly in the coupled system compared to the uncoupled system, while [HRi] and , which is the combined amount of and , change very little.
5.2. THE DYNAMICS OF THE COUPLED SYSTEM: EXPERIMENTAL AND NUMERICAL
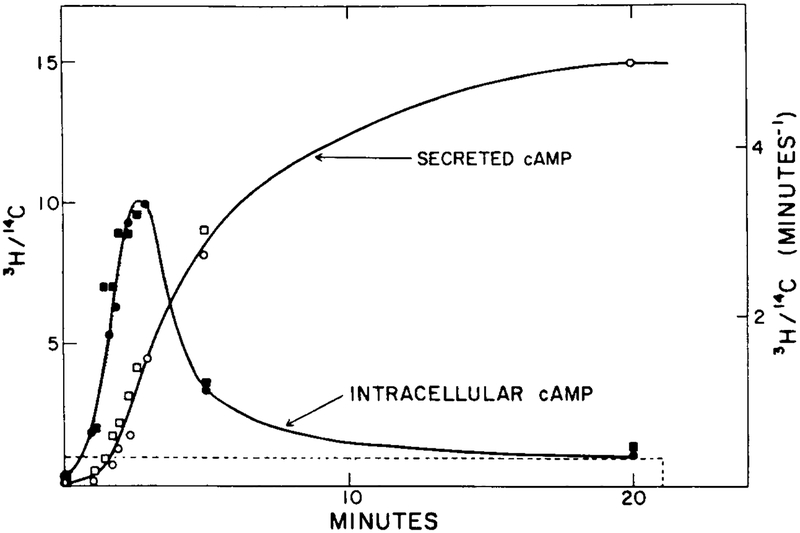
The perfusion experiments done by Devreotes and coworkers [10, 13] provide a benchmark against which an adaptation model can be tested. The result of a typical experiment is shown in Figure 7. Note that the secretion rate does not adapt perfectly in this experiment.
FIG. 7.
The experimental response of cAMP secretion to a single prolonged stimulus of 10−6 M extracellular cAMP (from [11]). The stimulus is a 20-min step function of 1 μM magnitude (dashed line). Two experimental results (circles and squares) are shown here for intracellular cAMP concentration (filled symbols) and cAMP secretion (open symbols).
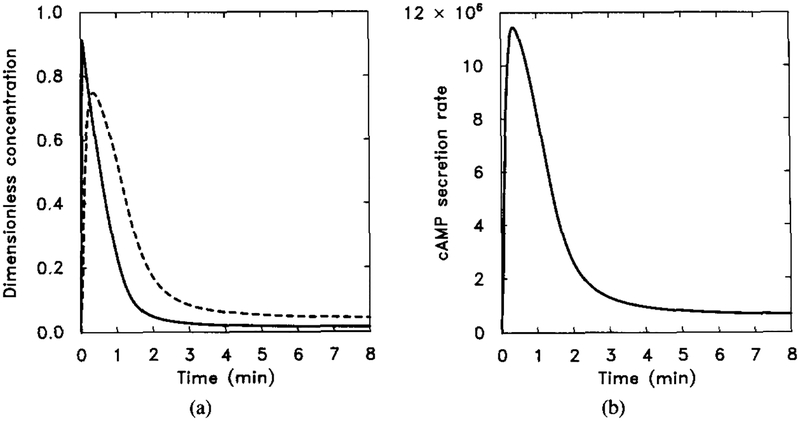
The predicted cAMP secretion rate in response to the same stimulus is shown in Figure 8, where it is seen that the model also predicts incomplete adaptation. Note also that the predicted secretion rate peaks more rapidly for the estimated parameters than does the observed rate. The time to peak could be increased by decreasing either k1 or k4
FIG. 8.
The response of the model to a prolonged stimulus of 10−6 M extracellular cAMP. The stimulus is [H] = 1.0 μM from t = 0 to t = 8 min. (a) The dimensionless concentrations of HRs (solid line) and cAMPi/10 (dashed line). (b) The dimensional secretion rate of cAMPi in molecules per cell per minute. Compare with Figure 7 for experimental data.
The rapid buildup and decrease of [HRs] shown in Figure 8a illustrates the fact that adaptation to a constant stimulus occurs at the receptor level. Since the time scale of [HRs] is fast compared to the activation of Gs and adenylate cyclase, one can regard the signal carried by [HRs] as a δ function with a certain magnitude that depends on the stimulus levels. That is, the interaction of the stimulatory and inhibitory pathways generates a signal like a δ function. If the signal transduction from Gs to adenylate cyclase can be approximately treated as a linear amplification process, then the response to this δ-function input would give the transient response of this process in a control-theoretic sense. However, the biochemical processes involved are not linear, but one should note that the response still has the shape of a first-order transient function.
As the stimulus level increases, the maximum secretion rate increases as well as the steady-state unadapted portion. Even at the largest stimulus level, the unadapted portion is less than 5% of the maximum rate. The parameter that has the strongest effect on the unadapted fraction is h4. A five-fold increase in h4 will decrease the unadapted fraction to an insignificant level at all the stimulus levels.
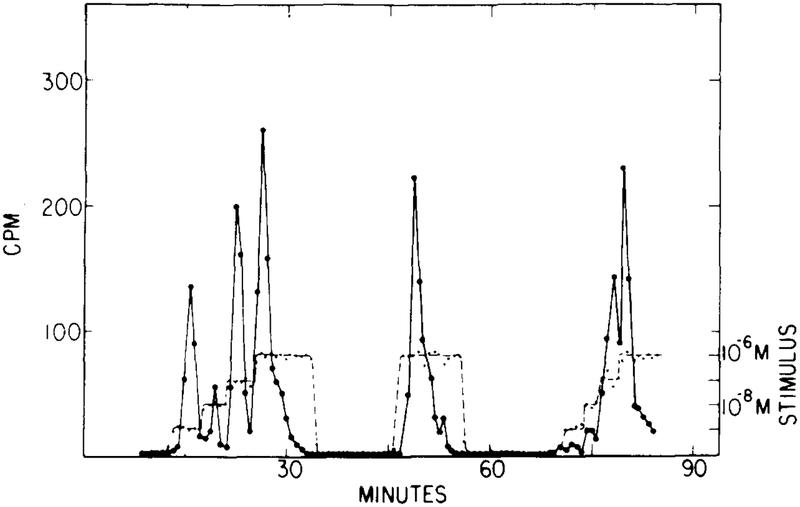
Figure 9 shows the response for a stimulus sequence of four steps, beginning with a step from 0 to 10−9, followed by three 10-fold increases.
FIG. 9.
The experimentally observed cAMP secretion in response to a multistep stimulus. The first step is from 0 to 10−9 M, and this is followed by three 10-fold increases. (Adapted from [9].)
The computational results, using the parameters estimated in the Appendix, are shown in Figure 10. One sees that the response to the initial 10−9 M signal is too small compared to the experimental data. In order to get a significant initial response to a stimulus of 10−9 M, we changed the value of k−1 to 0.075, which is still in the range of the experimental values.
FIG. 10.
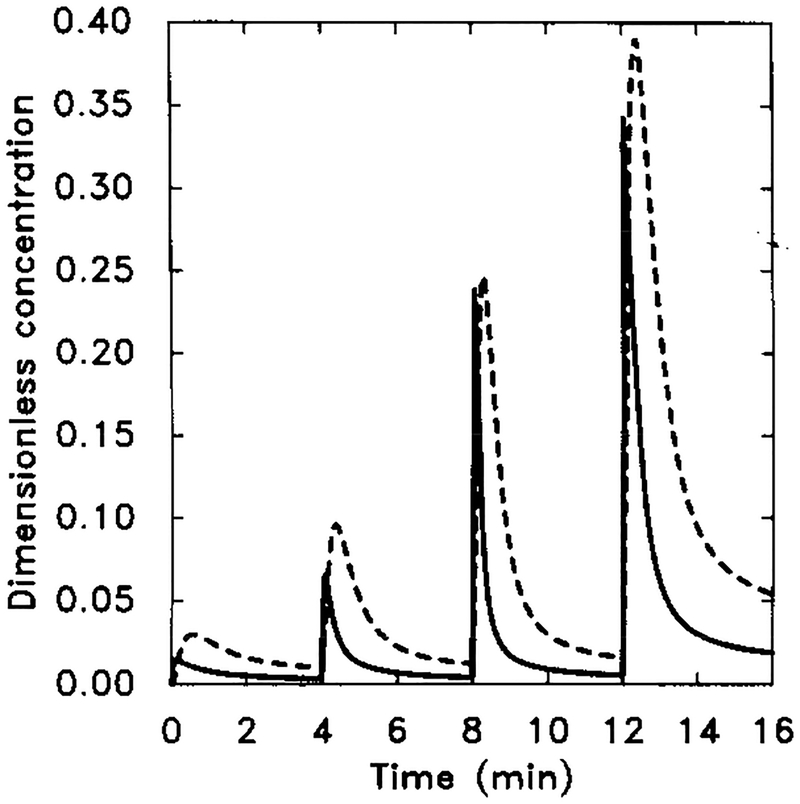
The numerical response of the system using the measured k−1. Starting at t = 0 min, extracellular cAMP was increased from 0 to 10−9 M and then to 10−6 M in three 10-fold steps of 4 min duration. Dimensional parameter values are given in Table 4. The dimensionless concentrations of HRs (solid line) and cAMPi/10 (dashed line).
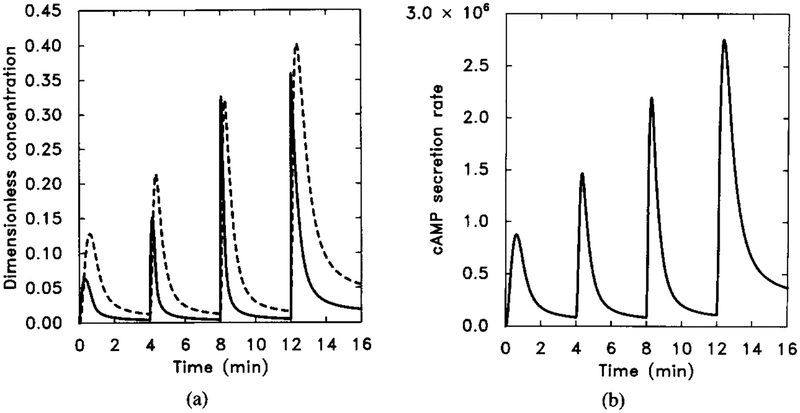
Figure 11 shows the response, and one can see that now it is very similar to the experimental data. Hereafter we will use this value, with other parameters unchanged, for the numerical experiments. A similar result can be obtained by slowing the rise of somewhat.
FIG. 11.
The numerical response to sequential 10-fold increases of stimuli with k−1 in Table 4 changed from 0.45 to 0.075. Other parameter values are unchanged. The stimulus is the same as in Figure 10. (a) The dimensionless concentrations of HRs (solid line) and cAMPi/10 (dashed line). (b) The dimensional secretion rate of cAMPi (molecules per cell per minute). Compare with Figure 9 for experimental data.
In Figure 9 the response to the second step of the stimulus sequence H = 10−8 M is small compared to the responses to other stimulus levels. This can be reproduced in the model by speeding up the response of the inhibitory channel. For example, by increasing h2 and h5 by a factor of 3, one obtains a response very similar to that shown in Figure 9.
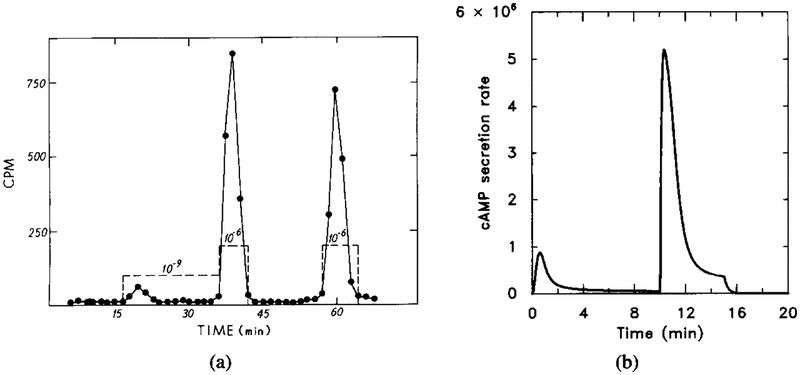
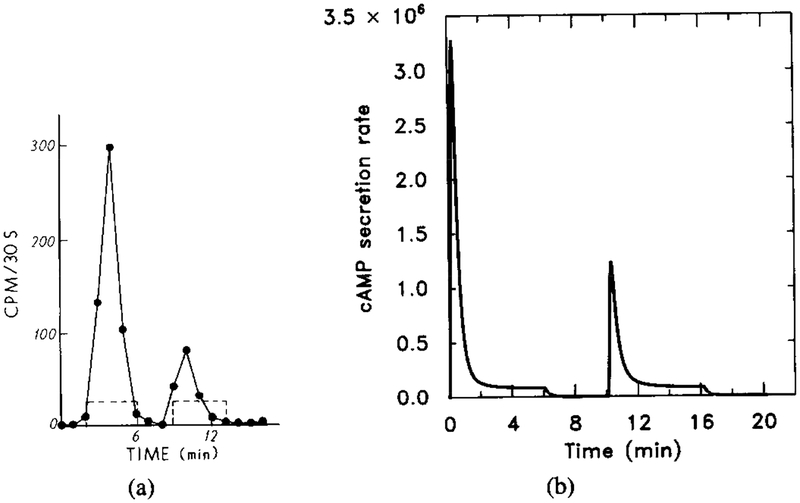
The simulations for a variety of stimuli are satisfactory using the parameter values given in Table 4, provided that k1 is changed as above. This includes the response to a two-step sequential increase (Figure 12) and the two-step short time step stimulus (Figure 13). Experimental results and the simulation response curves are given here.
FIG. 12.
The experimental and model response to a two-step sequential stimulus. Note that after removal of the stimulus the unadapted portion decays very rapidly. The parameter value are the same as in Figure 11. The stimulus sequence is [H] = 10−9 M for t = 0 to t = 10, [H] = 10−6 M for t = 10 to t = 15, and [H] = 0 M for t = 15 to t = 20. (a) The experimentally observed response (adapted from [9]). (b) The dimensional secretion rate of cAMPi in molecules per cell per minute.
FIG. 13.
The experimental and numerical response to short two-step stimuli. The time course of the extracellular cAMP stimulus is 10−8 M (t = 0–6), 0 M (t = 6–10), 10−8 M (t = 10–16), and 0 M (t = 16–20). This experiment probes the time course of deadaptation, because the magnitude of the response to the second stimulus depends upon the degree to which the cells have recovered from the first stimulus. Parameter values are the same in Figure 11. (a) Experimental results (adapted from [11]). (b) The dimensional secretion rate of cAMPi (molecules per cell per minute). The response to the second signal of the same magnitude is much smaller because has not decayed completely. The magnitude of the second response increases with the elapsed time since the preceding signal.
We conclude that the model can explain adaptation at the transduction level, using parameter estimates based on experimental observations in Dd and mammalian systems. In the following section we show that the model can also reproduce the observed oscillations in suspensions.
6. SIMULATION OF SUSPENSION EXPERIMENTS
Thus far we have only dealt with the modeling of perfusion experiments, in which case the extracellular cAMP is a specified function of time. As we have demonstrated elsewhere [32, 33], the dynamics of other experimental configurations can also be described with perhaps changes in one or two parameters, once the input–output behavior of the cells is accurately described by a model. In this section we demonstrate this for the present model by analyzing the dynamics of suspensions. A detailed discussion of suspension experiments is given in [32].
6.1. SUSPENSION EXPERIMENTS AND A MATHEMATICAL MODEL
To describe the suspensions, we only have to append reactions for the extracellular dynamics and equations for the evolution of extracellular cAMP. The additional reactions arise from the presence of the extracellular enzymes.
| (26) |
Here cAMPo denotes extracellular cAMP, mPDE denotes membrane-bound phosphodiesterase, cAMPo–mPDE denotes the complex between cAMP and mPDE on the extracellular membrane, ePDE denotes the extracellular phosphodiesterase in solution, and cAMPo–ePDE denotes the ePDE–cAMPo complex in the extracellular solution. Notice that cAMPo, is different from H and .
The additional differential equations are
| (27) |
Here N denotes the total number of cells, Vo denotes the extracellular volume, and Ac(Vc) denote the area (volume) per cell. In addition, y14 stands for [cAMPo], y15 for [mPDE–cAMPo,], y16 for [ePDE–cAMPo], z8 for free [mPDE], and z9 for the free [ePDE]. In addition, there are two other conservation equations:
| (28) |
The newly introduced variables y15 + y16 are both positive and bounded. In fact, we have
It follows from this that y14 is also bounded.
By scaling the new independent variables and introducing additional nondimensional parameters, we obtain a nondimensionalized system for the ui and vi. Most of the equations are the same as in Section 7. The newly introduced dimensionless parameters and singular variables are listed in Table 12. We use the same scaling for y14 as , u8 = y14/[iPDE]T.
TABLE 12.
Additional Dimensionless Variables and Parameters
| Parameters | Parameters | Variables |
|---|---|---|
The newly introduced singular differential equations are
| (29) |
As before, we set the time derivatives for the singular variables equal to zero, solve the resulting system, and use the results in the equatidns for the nonsingular variables. The result is that the new nonsingular variables satisfy the following system.
| (30) |
Here ρ is the ratio of cell volume to the total volume in an experiment, that is,
Using the parameter values given in the Appendix, we obtain the values for the dimensionless parameters given in Table 13.
TABLE 13.
Estimated Values for the New Dimensionless Parameters
| α0 = 208.0 | γ6 = 2.9 | γ8= 4607 | ρ = 0.14 |
| β0 = 61.0 | γ7 = 225.4 | γ9 = 659.3 |
6.2. NUMERICAL SIMULATION OF SUSPENSION EXPERIMENTS
We have tested the model numerically both for the scaled system and the unscaled system. As is expected from the singular perturbation analysis, the simplified system approximates the original system very well.
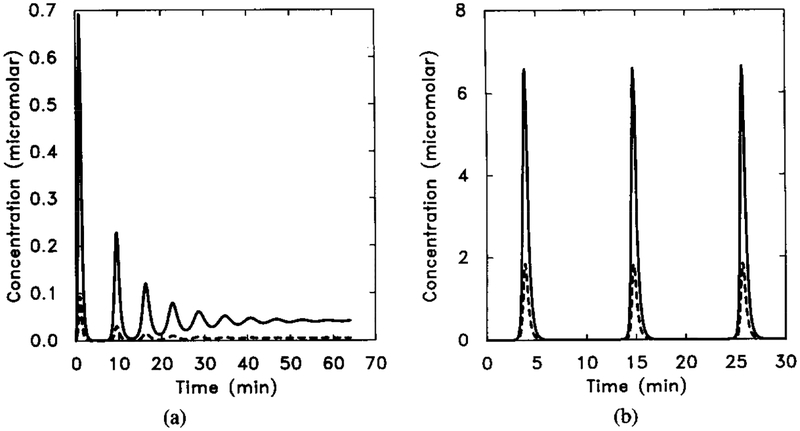
There are three types of qualitatively distinct dynamics in suspensions, depending on the parameter values chosen: (1) adaptation without oscillation, (2) decaying oscillations, and (3) stable oscillations. A typical response curve for each of the last two types is shown in Figure 14.
FIG. 14.
The dimensionless [cAMPi] as a function of time, illustrating decaying oscillations. Parameter values are taken from Tables 8 and 13. The initial stimulus is [H] = 10−8 M. In this figure we scale both γ2 and γ5 by a factor f. Here γ2 = f × 0.048, and γ5 = f × 0.224, with f = 5.0. (b) A stable oscillation for f = 10.0. Shown are the dimensional intracellular cAMP concentration [cAMPi] (solid line) and 10 times the extracellular cAMP concentration [cAMPo] (dashed line).
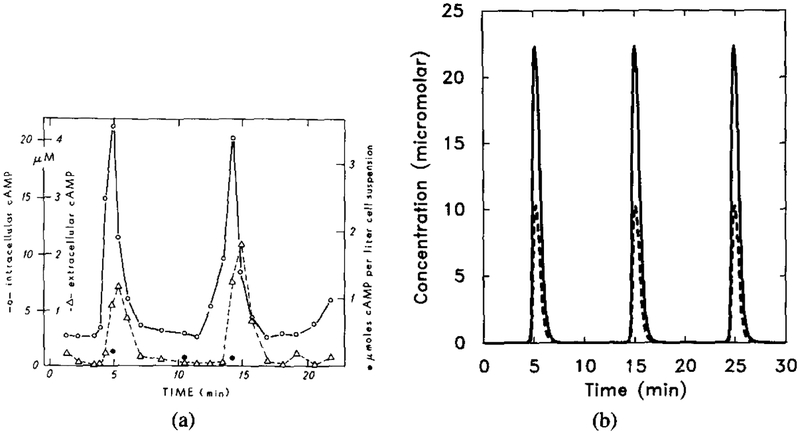
Since there are many parameters involved in the system, a complete demarcation of parameter space according to the type of response is difficult to obtain. However, if we keep certain variables fixed and let only one variable change, we can do a bifurcation analysis. Bifurcation analysis with respect to certain parameters that are known to change in different developmental stages (such as total amount of adenylate cyclase and the cAMP secretion rate) gives insight into how the dynamics change with the developmental stage. The results of this type of analysis were given in [32]. Here we simply illustrate that the experimentally observed oscillations can be reproduced with the model. Figure 15 shows (a) the experimental results and (b) the numerical results. One sees that the latter correspond well with the experimental data in both magnitude and frequency.
FIG. 15.
The experimental results for oscillations in suspensions and the corresponding numerical results. Parameter values are the same as in Figure 14 except f = 25.0. (a) Experimental measurements of intracellular (◯) and extracellular (Δ). Redrawn from Figure 2 of Gerisch and Wick [20]. (b) Dimensional intracellular cAMP concentration [cAMPi] (solid line) and five times the extracellular cAMP concentration [cAMPo] (dashed line).
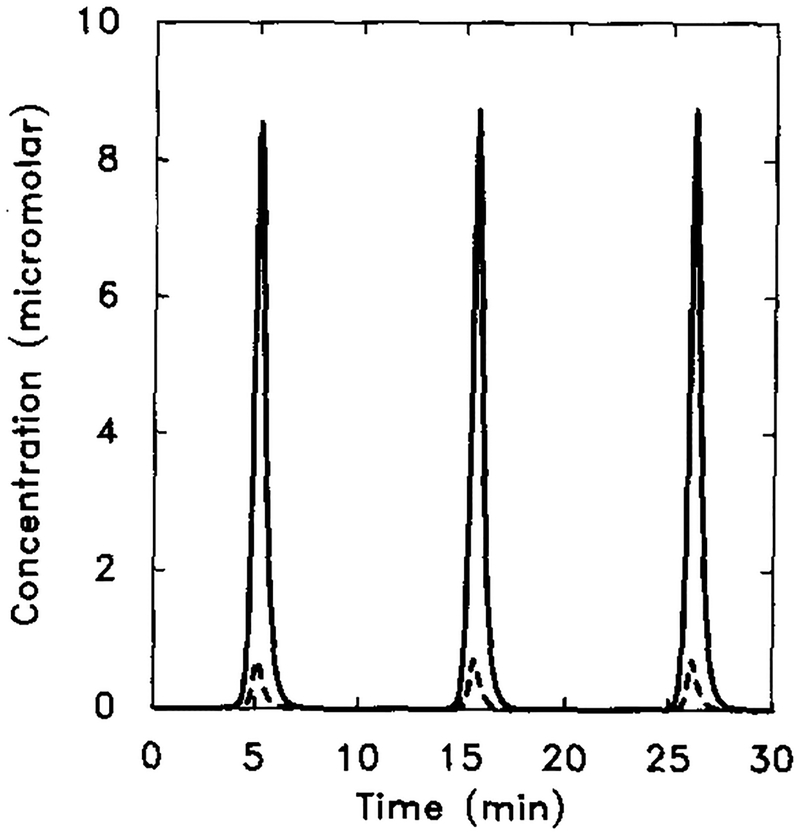
The peak amplitude of the extracellular cAMP is very sensitive to the amount and the turnover rate of adenylate cyclase and to the activity of iPDE and mPDE. Figure 16 shows how a change of the values of mPDE and γ5 changes the magnitude of the response.
FIG. 16.
The magnitude of oscillation is significantly influenced by the parameters reflecting the activities of AC, iPDE, and mPDE. Here γ6 is decreased by a factor of 10 (γ6 = 0.29) and other parameter values are the same as in Figure 15. Shown are the dimensional intracellular cAMP concentration [cAMPi] (solid line) and 10 times the extracellular cAMP concentration [cAMPo] (dashed line).
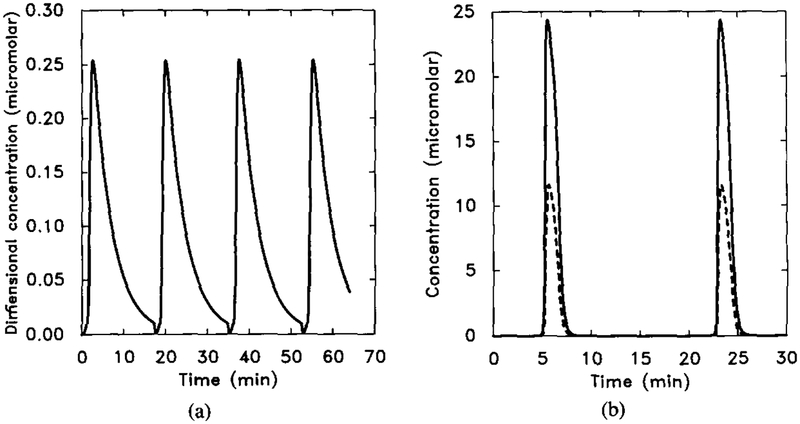
On the other hand, the frequency of the oscillation is very sensitive to β2 ≡ h2[Gi]T/k5 and β5 = h5/k5. Figure 17 shows how the frequency can be changed by proportional changes in β2 and β5, which determine the slowest process in the system (see Appendix for the explanation).
FIG. 17.
An illustration of how changes in β2 and β5 significantly change the oscillation frequency. Here β2 and β5 are divided by a factor of 2. Other parameter values are the same as in Figure 15. Compare with Figure 15. (a) The dimensionless concentration of . (b) Five times the intracellular cAMP concentration [cAMPi] (solid line) and the extracellular cAMP concentration [cAMPo] (dashed line).
7. EXPERIMENTAL TESTS OF THE MODEL
7.1. PROPOSED EXPERIMENTS
In this section we propose several experiments that can be used to test the model, and we describe the predictions made by the model for these experiments.
The effect of cholera toxin on adaptation of the relay response in Dictyostelium discoideum has not yet been reported. However, if we assume that cholera toxin acts on the Gs of Dd in the same way it acts on Gs in other cells, then it will block hydrolysis of activated Gs. When the agonist and antagonist are different, as in many other systems, the result of exposure to cholera toxin is that all of the UC is eventually converted into AC in the presence of a prolonged agonist signal. However, in Dd the agonist and antagonist are the same, and thus both signals arrive at the same time. As a result, in our model most of the HRs complex is split rapidly, and only a small amount of adenylate cyclase is activated in a short time. Thus a small stimulus cannot turn on all the adenylate cyclase in a short time, and a further increase in the stimulus will cause a further increase in the AC activity. An interesting prediction of our model under cholera toxin treatment is the following.
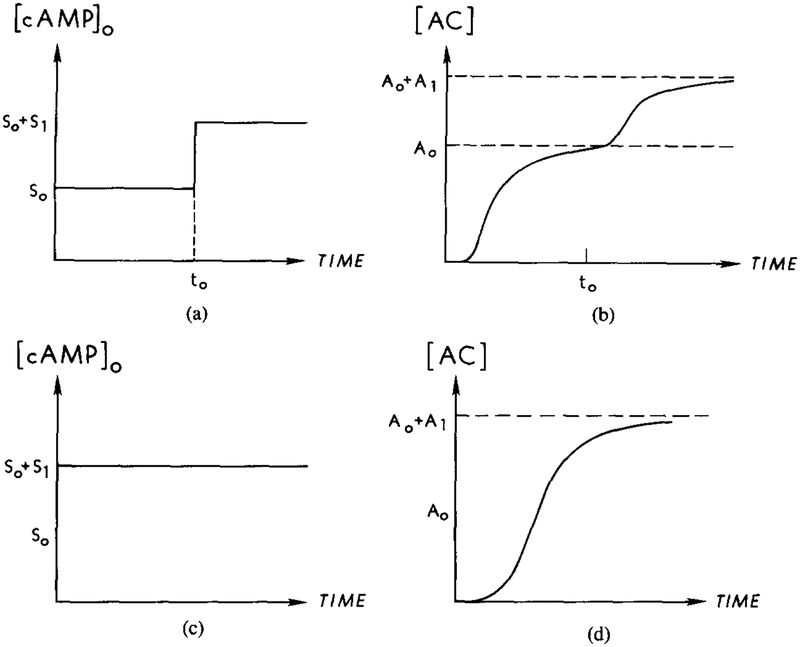
Suppose that the external cAMP concentration is held at S0 until time T0 and that the amount of AC turned on is A0 (see Figure 18). Next increase the external cAMP concentration by S1 and hold it until T1, and suppose that the corresponding increase of AC is A1. Then the model predicts that for an external cAMP concentration of S0 + S1, the corresponding amount of adenylate cyclase that is activated for times of the order of T1 will be A0 + A1, that is, the amount of AC activated is additive in a quasi-steady state. Since adaptation is not complete, the presence of some unadapted HRs will eventually activate all the AC. However, the increase in AC activity due to the residual HRs is slow, and the additivity should be observable on the experimental time scale. This prediction can be used to check our model.
FIG. 18.
The steady-state additivity of cAMP production in the response to an extracellular cAMP signal, predicted for cholera toxin–treated cells. The steady-state concentration should depend only on the final stage of extracellular stimulus and not on the stimulus history. (a) A two-step stimulus of magnitude from S0 to S0 + S1. (b) The corresponding response of activated adenylate cyclase to the stimulus in (a). The steady-state concentration should be from A0 to A0 + A1. (c) A single-step stimulus of magnitude S0 + S1. (d) The corresponding response of activated adenylate cyclase to the stimulus in (c).
Since we do not know whether cholera toxin interacts with Gs in Dd, we propose another experiment to check this model. If we use a nonhydrolyzable substitute such as GTPγS or Gpp[NH]p for GTP, activated AC will not be deactivated, just as in the case of cholera toxin treatment. On the other hand, the signal is also changed in the inhibitory pathway. A prolonged stimulus will result in the complete activation of Gi, and this will turn off further activation of AC. The pseudo-steady-state concentrations of and AC will be proportional to the stimulus level and will not decay.
The essential difference between the response of cholera toxin-treated cells and cells treated with GTPγS is in the response to a second cAMP signal of higher concentration. While the cholera toxin-treated cell should have the property of semiadditivity on a short time scale, the cells treated with GTPγS should have no response to the sequential increase of stimulus. Very little of the second stimulus will pass the receptor level, since most of the Gi is activated by the first signal. The newly generated population of HRs will rapidly be bound with αi-GTPγS and thus will not catalyze the transition from Gs to . When Gpp[NY]p is used instead of GTPγS the time course of the response will be essentially the same, but there will be a slight decrease in the magnitude of the response because the affinity of αi and αs for Gpp[NH]p is not as high.
These two tests are not able to distinguish between our model and a model with direct inhibitory interaction between and . Both predict the same type of response for the two experiments. However, there is an experiment that can rule out the possibility of a direct interaction model, and this hinges on the possibility of measuring the activated concentration.
In the direct interaction inhibition model, the fraction of Gs activated will remain large under a constant stimulus. On the other hand, if adaptation occurs at the receptor level, as in our model, then after an initial burst following a step change in the stimulus, the fraction of Gs will return to a low level fixed by the stimulus, If it is possible to measure the time course of in the membrane, then the two models can be distinguished.
In the next section, we report the detailed predictions made by the model for these experiments.
7.2. NUMERICAL OUTPUTS FOR THE EXPERIMENTS
The first numerical experiment we do concerns the pertussis toxin-treated cells. The effect of pertussis toxin is simulated by letting h2 = 0, which means that Gi cannot be activated. The numerical simulation predicts a near-linear increase in the total amount of cAMP secreted. This differs from the experimental result in [39]. The decrease in the cAMP secretion rate in the experiment results from the phosphorylation of receptors, which is not included in our model.
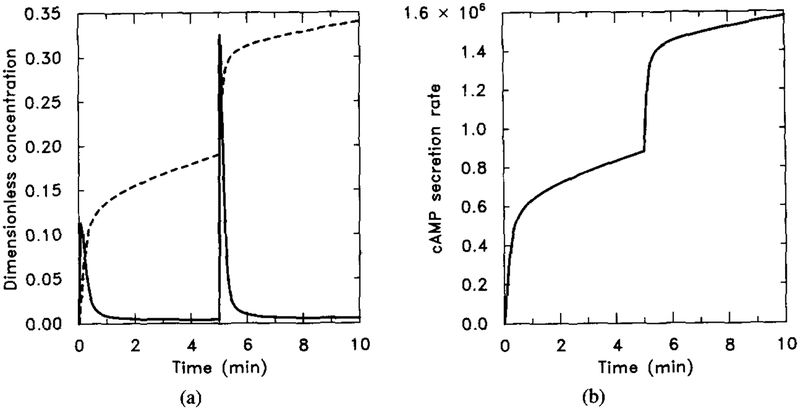
To simulate the effect of treatment with cholera toxin, we let k5 = 0. Notice that here we cannot use the scaled system for the numerical experiment, because in that system k5 is used to scale the time. The numerical output from the nonscaled system (5)–(8) is shown in Figure 19. The figure should be compared with Figure 18 to check the steady-state additivity property in this experiment. Notice that in Figure 18a, adaptation does occur at receptor level, but does not decay.
FIG. 19.
The effect of cholera toxin as predicted by the model. The result should be compared with Figure 18 to see the steady-state additivity. Parameter values are given in Table 4 with k5 = 0 to mimic the effect of cholera toxin. The stimulus is 10−8 M for t ∈ (0, 5) and 10−7 M for t ∈ (5, 10). (a) Dimensionless concentrations of HRs (solid line) and cAMPi/10 (dashed line). (b) Dimensional secretion rate of cAMPi (molecules per cell per minute).
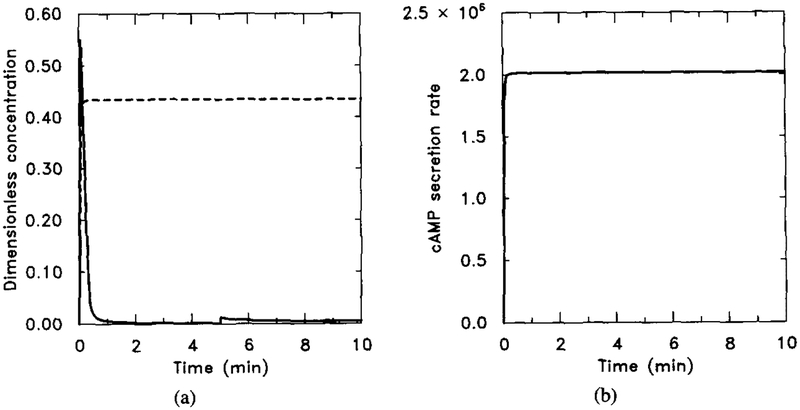
If GTPγS is used instead of GTP, then both and are nonhydrolyzable. We mimic this by letting k5 = h5 = 0. The numerical output is shown in Figure 20. We see here that the first signal (H = 0.1 μM) can turn on almost all the after a certain time. The high level of blocks the response of the system to the second stimulus (H = 1 μM). The small increase in internal cAMP concentration and the increased secretion rate are due to the unadapted portion of HRs, which is very small.
FIG. 20.
Numerical output for the experiment when GTP is replaced by GTPγS. The parameter values are the same as in Figure 19 with h5 = 0 to simulate the fact that αi-GTPγS is also nonhydrolyzable. The stimulus is 10−8 M for t ∈ (0, 5) and 10−7 M for t ∈ (5, 10). (a) Dimensionless concentrations of HRs (solid line) and cAMPi/10 (dashed line). (b) Dimensional secretion rate of cAMPi (molecules per cell per minute). (b) should be compared with (b) in Figure 19.
8. CONCLUSIONS
We have developed a model for adaptation of the relay response in Dictyostelium discoideum and have shown that it can reproduce the experimental results available for perfusion and suspension experiments. As in the Monk-Othmer model, this has been done using the same parameters to model both perfusion and suspension experiments, except for those that are known to vary with developmental age. It was shown in [32], [33] that several modifications to the basic model presented there, such as the inclusion of time delays in the stimulus and adaptation pathways, do not alter the general conclusions reached, and the same conclusion undoubtedly applies here, although we have not checked this in detail. Certain aspects, such as the rise time of the production and secretion of cAMP, could be improved by tuning the parameters, but that is of secondary importance.
As we mentioned in Section 2.2, another possible mechanism for adaptation is based on direct interaction between and . This would require a second Gi protein binding site on adenylate cyclase, such that when it is occupied with the activity of the cyclase is essentially zero. A kinetic scheme for this mechanism is as follows.
| (31) |
Our numerical simulations indicate that an adaptation model based on this mechanism can also reproduce the experimental observations in perfusion experiments. We have not checked this for the suspension experiments, but past experience indicates that it will function properly in that context as well. A model based on direct interaction of with the cyclase is similar in spirit to the Monk-Othmer model, wherein calcium plays the inhibitory role and interacts directly with the cyclase.
At present one cannot discriminate on theoretical grounds between the direct inhibition model described in this section and the model proposed and analyzed in this paper. However, the fact that a –cyclase complex has not been found in other systems favors the latter model. Energetic considerations also favor the latter model, since adaptation at the level of the cyclase entails approximately twice the consumption of GTP in the presence of a constant signal. However, the final determination of a model hinges on identifying the details of the biochemical pathways from extracellular signal to cyclase.
A number of other models for cyclic AMP control and synthesis in Dictyostelium have appeared, and these were reviewed in [32] and [33]. Models involving receptor modification are motivated by the experimental fact that cAMP induces phosphorylation of the cAMP receptors in Dd [24,25] and that this occurs on the same time scale as adaptation. Thus phosphorylation may be involved in adaptation, perhaps by interfering with the activation of a Gs protein. However, as we mentioned earlier, phosphorylation is not sufficient for adaptation, since pertussis toxin treatment blocks adaptation but does not interfere with receptor modification [40, 50]. This suggests that activation of a Gi protein is necessary for adaptation [42]. In this paper we developed a mechanism based on this and showed that it can produce the observed adaptation. We have not incorporated a role for phosphorylation, but this is easily done and would not alter the basic conclusions, since it simply introduces alternative pathways for the intermediates, and the same dynamics are as predicted by the present model can be obtained by retuning the rate constants.
The model presented in this paper concerns only the relay response. However, cyclic AMP stimuli also trigger a chemotactic response, and to model the cellular response more completely we would have to incorporate cyclic GMP and perhaps other species [48]. Such a model is presently under development.
Acknowledgments
This research was supported in part under NIH grant GM29123.
APPENDIX
In this appendix, we estimate the model parameters.
A.1. REACTION KINETIC CONSTANTS
Two classes of cAMP binding sites have been identified in relay competent Dd cells, which are denoted as the A site and B site [50]. The total number of sites is approximately (5–10)×104 per cell [18]. The B sites comprise only about 4% of all binding sites, and it is believed that they are involved in the cGMP and chemotaxis pathways. We take the upper value of 105 receptors per cell for the total binding sites, that is, 9.6 × 10⁴ for A sites. Of the A sites, about 40% are fast dissociation with high affinity (Kd = 60 nM), and about 60% are fast dissociation with low affinity (Kd = 450 nM). It is reasonable to assume that the high-affinity receptors of the A site are Rs and the low affinity ones are Ri, since usually Gi > Gs. The values of the binding and dissociation constants for the two receptor types are estimated as
in [49].
Data on the rate of activation of Gs are reported in terms of the rate constant
Levitzki [29] reported that kon is in the range of 0.5–1.5 min−1 for mammalian cells. Freissmuth et al. [19] reported a higher kon, with a minimum of 2 min−1. The latter estimate is more compatible with the observed rates of cAMP secretion in Dd (the secreted cAMP reaches its peak at about 1.5 min). There is no measurement of kon reported for Dd, so we will take the value of kon = 2.5 min−1 = 0.0167 s−1. Since
the value of kon depends on the stimulus level. From this estimate for kon we have to estimate k2, k−2, and k3. If we assume an intermediate stimulus level of [H] ~ 10−2 μM, we have [HRs]/[Rs]T ~ 0.1, and therefore
The value for k3 is reported as 104 s−1 in [19]. We still cannot obtain both k2 and k−2, and therefore we assume that k−2 ≪ k3. This means that the rate of dissociation of HRsGs is small compared with the rate of production of , and with this assumption we obtain
The analysis for the estimation of h2, h−2, and h3 is very similar to that of h2, h−2, h3 but here there is no reported value of hon. We can, however, use the cAMP secretion to estimate these kinetic constants. A typical value for the peak value of cAMP secretion is tpeak ~ 1.5 min, and we assume that the half-time of the inhibitory signal is
Knowing , we can get an estimate of hon from the dynamics of this pathway. Under the assumption of a pseudo-steady state, we have
If we assume that the stimulus level to yield this value of hon is [HRi]/[Ri]T ~ 0.5, then we can get an estimate for h2, h−2, and h3 in the same way as previously. The result is that
h−2 = 0 s−1, and h3 = 400 s−1.
Next we set k4 and h4. Based on the observation that the rate of production of cAMP is first-order in the receptor concentration, Levitzki argued that Gs is precoupled to the inactivated adenylate cyclase [27]. However, as we noted in the text, there is evidence that suggests that Gs shuttles between HRs and adenylate cyclase. Whichever is correct, it is safe to assume, in the absence of Dd–specific information, that k4 is large, and we use the value k4 = 1 × 10⁴ m2/(μmol·s) for the numerical computations. For the same reasons we can assume that h4 is very large, that is, that the affinity of to HRs is very high, and in the numerical experiments we use k4 = 5 × 10⁵ m2/(μmol·s).
There is uncertainty concerning the rate of hydrolysis of the activated Gs protein as well. Levitzki reports that koff (≡ k5) is in the range of 13–15 min−1 [28], but Casey and Gilman [7] report a value of koff of around 3 min−1. For the numerical computations we use the value k5 = 3.75 min−1 = 0.0625 s−1.
The rate of decay of is the slowest step involved in the oscillations in suspension experiments. Restimulation can only occur after has decayed to a low-level, which means that the period of the oscillations depends strongly on hoff. If we assume that the external cAMP is suddenly withdrawn from the extracellular medium, it will take about 4 half-lives of to degrade ~ 95% of existing . However, extracellular cAMP is degraded only gradually by ePDE and mPDE, and thus the actual time for sufficient degradation of may be severalfold longer than if the signal is abruptly terminated. The observed time period for oscillation is about 10 min [38]. If we assume that the time is 1.5–1.75 times longer and note that
and
we find that
We take a value of
The rate of association between the βγ subunit and the hydrolyzed G proteins is set at
This assumption is based on the known fact that α-GDP has a high affinity for βγ [21].
There is some experimental data that can be used for the estimation of h6. van Haastert and de Wit [49] report that the high-affinity receptors are transformed to low-affinity receptors in the presence of prolonger stimuli. The interpretation of this in the context of our model is that has a much lower affinity for H then does Rs. There is no transformation between the two different binding sites Rs and Ri in our model; the transformation from high affinity to low affinity is due to the reaction
It follows that the coupling of h6 with k1 should yield the same value of the affinity as for the low-affinity sites, which implies that
From this we obtain
The actual value of h6 we used is
Finally, we have to estimate the constants for adenylate cyclase, internal phosphodiesterase, and the secretion rate. It is reported in [29] that the typical value for the turnover number of activated adenylate cyclase is
provided the concentration of ATP is held constant. Under this condition, we have that
Since this process is fast, the selection of l1, l−1, l2 has little effect on the dynamics on the time scale we focus on, provided that the combination of the chosen values of l1, l−1, l2 yields the correct value of lcat. Thus we take l1 = l−1 = 20.2 s−1 and l2 = 202 s−1.
The kinetic constants for iPDE have been estimated from experiments in [32] and [37]. It is reported there that the Michaelis-Menten constants are
and
The individual value for each of the constants involved is unknown, but it is reasonable to assume that the turnover number of iPDE is not very high, since the function of iPDE is to hydrolyze excess cAMP so as to control the internal level of cAMP. For simplicity we take l−3 = 0 s−1 and l4 = 50 s−1, and then we can get
Finally, it is reported in [11] that l5 ranges from 0.34 min−1 to 0.94 min−1. We use the intermediate value
A.2. CELL GEOMETRY AND CHEMICAL CONCENTRATIONS
The typical cell radius for Dd is 11 μm [6, 37]. If a spherical geometry is assumed, then
Concentrations are stated either per unit area or per unit volume. These can be converted to molecules per cell as follows:
Therefore
and
At present there is little information about the concentrations of Gs and Gi. It is commonly claimed that the concentration of G proteins is higher than the concentration of receptors, and one estimate for mammalian cells give a value for Gs of 100,000 per cell [1]. It is believed that in Dd the number of G protein molecules is in the same range as that of receptors [39], and we take them as equal in our model. Thus
The total amount of adenylate cyclase is equal to the concentration of Gs in some mammalian cells [29] (but not others, cf. [1]), and we assume that this is true in Dd as well. Thus we have
and the corresponding concentrations are
and
This assumption is not critical, for we set the overall production rate to match the observed concentrations and secretion rates.
A.3. PARAMETERS IN THE SUSPENSION EXPERIMENTS
The new parameters that must be estimated for the suspension experiments are , KmPDE, , and KePDE, where
| (A1) |
| (A2) |
The values of these parameters have been estimated in [32] and [37].
In the numerical simulations, we used KmPDE = 5.0 μM, , KePDE = 1.3 mM, and .
REFERENCES
- 1.Adawia A, Jasper JR, I’. A Insel, and H. J. Motulsky, Stoichiometry of receptor-Gs-adenylate cyclase interactions, FASEB J 52300–2303 (1991). [DOI] [PubMed] [Google Scholar]
- 2.Arad H, Rosenbusch JP, and Levitzki A, Stimulatory GTP regulatory unit Ns and catalytic unit of adenylate cyclase are tightly associated: mechanistic consequences, Proc. Natl. Acad. Sci. USA 81:6579–6583 (November 1982). [DOI] [PMC free article] [PubMed] [Google Scholar]
- 3.Asano T, Katada T, Gilman A, and Ross E, Activation of the inhibitory GTP-binding protein of adenylate cyclase, Gi, by β-adrenergic receptors in reconstituted phospholipid vesicles, J. Biol. Chem 259(1.5):9351–9354 (1984). [PubMed] [Google Scholar]
- 4.Berridge M, Inositol trisphophate and diacylglycerol: two interacting second messengers, Ann. Rev. Biochem 56:159–193 (1987). [DOI] [PubMed] [Google Scholar]
- 5.Bominaar A, Snaar-Jagalska B, Kesbeke F, and van Haastert P, Signal-transducing G proteins in Dictyosteliun discoideum, in the guanine nucleotide binding proteins Common structural and functional properties (NATO ASI, Vol. 165) Bosch L, et al. eds., Springer-Verlag, Berlin, 1989, pp. 369–375. [Google Scholar]
- 6.Brachet P and Klein C, Inhibition of growth and cellular aggregation of Dictyostelium discoideum by steroid compounds, Exp. Cell Res 93:159–165 (1975). [DOI] [PubMed] [Google Scholar]
- 7.Casey PJ and Gilman AG, G protein involvement in receptor-effector coupling, J. Biol. Chem 263(6):2577–2580 (1988). [PubMed] [Google Scholar]
- 8.Devreotes P, Dictyostelium discoideum: a model system for cell-cell interactions in development, Science 245:1054–1058 (September 1989). [DOI] [PubMed] [Google Scholar]
- 9.Devreotes PN and Steck TL, Cyclic 3’,5’ AMP relay in Dictyostelium discoideum II. Requirements for the initiation and termination of the response, J. Cell Biof 80:300–309 (1979). [DOI] [PMC free article] [PubMed] [Google Scholar]
- 10.Devreotes PN, Derstine PL, and Steck TL, Cyclic 3’,5’ AMP relay in Dictyostelium discoideum I. A technique to monitor responses to controlled stimuli, J. Cell Biol 80:291–299 (1979). [DOI] [PMC free article] [PubMed] [Google Scholar]
- 11.Dinauer MC, MacKay SA, and Devreotes PN, Cyclic 3’,5’ AMP relay in Dictyostelium discoideum III. The relationship of cAMP synthesis and secretion during the cAMP signaling response, J. Cell Biol 86:537–544 (1980). [DOI] [PMC free article] [PubMed] [Google Scholar]
- 12.Dinauer MC, Steck TL, and Devreotes PN, Cyclic 3’,5’ AMP relay in Dictyostelium discoideum IV. Recovery of the cAMP signaling response after adaptation to cAMP, J. Cell Biol 86:545–553 (1980). [DOI] [PMC free article] [PubMed] [Google Scholar]
- 13.Dinauer MC, Steck TL, and Devreotes PN, Cyclic 3’,5’ AMP relay in Dictyostelium discoideum V. Adaptation of the cAMP signaling response during cAMP stimulation, J. Cell Biol 86:554–561 (1980). [DOI] [PMC free article] [PubMed] [Google Scholar]
- 14.Ehlert FJ, The relationship between muscarinic receptor occupancy and adenylate cyclase inhibition in the rabbit myocardium, Mol. Pharmacol 28: 410–421 (1985). [PubMed] [Google Scholar]
- 15.Europe-Finner G and Newell P, Inositol 1,4,5-trisphophate induces GMP formation in Dictyostelium discoideum, Biochem. Biophy. Res. Commun 130(3): 1115–1122 (1985). [DOI] [PubMed] [Google Scholar]
- 16.Europe-Finner G and Newell P, Cyclic AMP stimulates accumulation of inositol trisphosphate in Dictyostelium, J. Cell Sci 87:221–229 (1987). [DOI] [PubMed] [Google Scholar]
- 17.Europe-Finner G, Gammon B, Wood C, and Newell P, Inositol tris- and polyphosphate formation during chemotaxis of Dictyostelium, J. Cell Sci 93: 585–592 (1989). [DOI] [PubMed] [Google Scholar]
- 18.Firtel RA, van Haastert PJM, Kimmel AR, and Devreotes PN, G protein linked signal transduction pathways in development: Dictyostelium as an experimental system, Cell 58:235–239 (July 1989). [DOI] [PubMed] [Google Scholar]
- 19.Freissmuth M, Casey PJ, and Gilman AG, G proteins control diverse pathways of transmembrane signaling, FASEB J 3:2125–2131 (August 1989). [PubMed] [Google Scholar]
- 20.Gerisch G and Wick U, Intracellular oscillations and release of cyclic AMP from Dictyostelium cells, Biochem. Biophys. Res. Commun 65:364–370 (1975). [DOI] [PubMed] [Google Scholar]
- 21.Gilman AG, G proteins: transducers of receptor-gated signals, Ann. Rev. Biochem 56:615–649 (1987). [DOI] [PubMed] [Google Scholar]
- 22.Janssens P and van Haastert P, Molecular basis of transmembrane signal transduction in Dictyostelium discoideum, Microbial. Rev 51(4):396–418 (1987). [DOI] [PMC free article] [PubMed] [Google Scholar]
- 23.Kesbeke F, van Haastart P, and De Wit R, Chemotaxis to cyclic AMP and folic acid is mediated by different G proteins in Dictyostelium discoideum, J. Cell Sci 961669–673 (1990). [Google Scholar]
- 24.Klein P, Knox B, Borlies J, and Devreotes P, Purification of the surface cAMP receptor in Dictyostelium, J. Biol. Chem 261:352–357 (1987). [PubMed] [Google Scholar]
- 25.Klein P, Vaughn R, Borlies J, and Devreotes P, The surface cAMP receptor in Dictyostelium, J. Biol. Cem 262:358–364 (1987). [PubMed] [Google Scholar]
- 26.Levitzki A, Receptors: A Quantitative Approach, Benjamin/Cummings, Menlo Park, Calif, 1984. [Google Scholar]
- 27.Levitzki A, β-adrenergic receptors and their mode of coupling to adenylate cyclase, Physiol. Rev 66(3):819–854 (1986). [DOI] [PubMed] [Google Scholar]
- 28.Levitzki A, From epinephrine to cyclic AMP, Science 24:800–806 (1988). [DOI] [PubMed] [Google Scholar]
- 29.Levitzki A, Transmembrane signaling to adenylate cyclase in mammalian cells Saccharomyces cerevisiae, TIBS 13:298–301 (1988). [DOI] [PubMed] [Google Scholar]
- 30.Limbird LE, Activation and attenuation of adenylate cyclase, Biochem. J 195:1–13 (1981). [DOI] [PMC free article] [PubMed] [Google Scholar]
- 31.Marbach S, Shiloach J, and Levitzki A, Gi affects the agonist-binding properties of β-adrenoceptors in the presence of Gs, Eur. J. Biochem. FEBS, pp. 239–246 (1988). [DOI] [PubMed] [Google Scholar]
- 32.Monk PB and Othmer HG, Cyclic AMP oscillations in suspensions of Dictyostelium discoideum, Phi. Trans. Roy. Sot. Lond 323(1215):185–224 (1989). [DOI] [PubMed] [Google Scholar]
- 33.Monk PB and Othmer HG, Wave propagation in aggregation fields of Dictyostelium discoideum, in Lectures on Mathematics in the Life Sciences, Othmer HG, Ed., Ann. Math. Sot., Providence, R.I., 1989. [Google Scholar]
- 34.Othmer HG and Monk PB, Concentration waves in aggregation fields of a cellular slime mold, in Biomathematics and Related Computational Problems, Ricciardi L, Ed., Kluwer, Dordrecht, 1988, pp. 381–398. [Google Scholar]
- 35.Othmer HG, Monk PB, and Rapp PE, A model for signal relay and adaptation in Dictyostelium discoideum. Part II. Analytical and numerical results, Math. Biosci 77:77–139 (1985). [Google Scholar]
- 36.Rapp PE, Monk PB, and Othmer HG, A model for signal relay and adaptation in Dictyostelium discoideum. Part I. Biological processes and the model network, Math. Biosci 77:35–78 (1985). [Google Scholar]
- 37.Rapp PE, Monk PB, and Othmer HG, Quantitative estimates of kinetic parameters in the calcium cyclic nucleotide network in Dictyostelium discoideum, Tech. Rep, Department of Physiology and Biochemistry, Medical College of Pennsylvania, Philadelphia, 1985. [Google Scholar]
- 38.Roos W, Scheidegger C, and Gerisch G, Adenylate cyclase activity oscillations as signals for cell aggregation in Dictyostelium discoideum, Nature 266:259–260 (1977). [DOI] [PubMed] [Google Scholar]
- 39.Snaar-Jagalska E and van Haastert PJM, Pertussis toxin inhibits cAMP-induced desensitization of adenylate cyclase in Dictyostelium discoideum, Mol. Cell. Biochem 92:177–189 (1990). [DOI] [PubMed] [Google Scholar]
- 40.Snaar-Jagalska BE, Devreotes PN, and Van Haastert PJM, Ligand-induced modification of a surface cAMP receptor of Dictyostelium discoideum does not require its occupancy, J. Biol. Chem 263:897–901 (1988). [PubMed] [Google Scholar]
- 41.Snaar-Jagalska BE, Kesbeke F, and Van Haastert PJM, G-proteins in the signal transduction pathways of Dictyostelium discoideum, Dev. Genet 9:215–226 (1988). [DOI] [PubMed] [Google Scholar]
- 42.Snaar-Jagalska E, Van Es S, Kesbeke F, and van Haastert PJM, Activation of pertussis toxin-sensitive guanine-nucleotide binding regulatory protein during desensitization of Dictyostelium discoideum cells to chemotactic signals, Eur. J. Biochem 195:715–721 (1991). [DOI] [PubMed] [Google Scholar]
- 43.Stryer L, proteins G: a family of signal transducers, Ann. Rev. Cell Biol 2:391 (1986). [DOI] [PubMed] [Google Scholar]
- 44.Stryer L, Biochemistry, 3rd ed, W. H. Freeman, New York, 1988. [Google Scholar]
- 45.Taylor CW, The role of G proteins in transmembrane signalling, Biochem. J 272:1–13 (1990). [DOI] [PMC free article] [PubMed] [Google Scholar]
- 46.Tolkovsky A, Braun S, and Levitzki A, Kinetics of interaction between β-receptors, GTP protein, and catalytic unit of turkey erythrocyte adenylate cycles, Proc. Natl. Acad. Sci. USA 79:213–217 (January 1982). [DOI] [PMC free article] [PubMed] [Google Scholar]
- 47.Tota MR and Schimerlik MI, Partial agonist effects on the interaction between the atria1 muscarinic receptor and the inhibitory guanine nucleotide-binding protein in a reconstituted system, Mol. Phurmucol 37:996–1004 (1990). [PubMed] [Google Scholar]
- 48.van Haastert PJM and Konijn TM, Signal transduction in the cellular slime molds, Mol. Cell. Endocrinol 2611–17 (1983). [DOI] [PubMed] [Google Scholar]
- 49.van Haastert PJM and de Wit RJ, Demonstration of receptor heterogeneity and affinity modulation by nonequilibrium binding experiments, J. Biol. Chem 259(21):13321–13328 (1984). [PubMed] [Google Scholar]
- 50.van Haastert PJM, de Wit RJW, Janssens PMW, Kesbeke F, Snaar-Jagalska BE, Van Lookeren MM, and Konijn TM, Adaptation of Dictyostelium discoideum cells to chemotactic signals, in Molecular Mechanisms of Desensitization to Signal Molecules (NATO ASI Vol. 6), Konijn TM, et al. , Eds., Springer-Verlag, Berlin, 1987, pp. 25–42. [Google Scholar]


