

Abstract
Purpose: Surgery for upper tract urinary stone disease is often reserved for symptomatic patients and those whose stone does not spontaneously pass after a trial of passage. Our objective was to determine whether payer type or race/ethnicity is associated with the timeliness of kidney stone surgery.
Materials and Methods: A population-based cohort study was conducted using the California Office of Statewide Health Planning and Development dataset from 2010 to 2012. We identified patients who were discharged from an emergency department (ED) with a stone diagnosis and who subsequently underwent a stone surgery. Primary outcome was time from ED discharge to urinary stone surgery in days. Secondary outcomes included potential harms resulting from delayed stone surgery.
Results: Over the study period, 15,193 patients met the inclusion criteria. Median time from ED discharge to stone surgery was 28 days. On multivariable analysis patients with Medicaid, Medicare, and self-pay coverage experienced adjusted mean increases of 46%, 42%, and 60% in time to surgery, respectively, when compared with those with private insurance. In addition, patients of Black and Hispanic race/ethnicity, respectively, experienced adjusted mean increases of 36% and 20% in time to surgery relative to their White counterparts. Before a stone surgery, underinsured patients were more likely to revisit an ED three or more times, undergo two or more CT imaging studies, and receive upper urinary tract decompression.
Conclusions: Underinsured and minority patients are more likely to experience a longer time to stone surgery after presenting to an ED and experience potential harm from this delay.
Keywords: kidney stones, urolithiasis, health care disparities, ureteroscopy, SWL, PCNL
Introduction
Upper urinary tract stone disease affects ∼1 in 11 persons in the United States.1,2 Rates of visits to an emergency department (ED) for persons with acute renal colic from urinary stone disease are increasing along with prevalence of upper urinary tract stone disease.3 More than 90% of patients presenting to an ED with symptoms of urinary stone disease are discharged, often with treatment directed at managing symptoms.4,5 This common approach provides patients time to pass the stone and abrogate the need for surgery; with some patients receiving medical expulsive therapy (MET), though the evidence to support of this practice is mixed.5,6 After discharge from an ED, ∼1 in 10 patients will return for persistent or worsening symptoms.7,8
Ultimately, one in four persons presenting with upper tract urinary stone disease will require surgery to remove their stone.9,10 In patients who require surgery, longer wait times can result in harm, as patients may experience persistent pain, and are at increased risk of urinary tract infection, acute kidney injury (AKI), and potentially, chronic kidney disease (CKD).11
Payer type and race/ethnicity have been associated with varying wait times for surgical procedures.12–15 In this study, we sought to evaluate whether payer type and/or race/ethnicity influence the time to surgery for upper tract urinary stone disease. We hypothesized that underinsured and minority patients would experience longer wait times to a definitive stone surgery. We also sought to measure the potential harms of longer wait times, namely repeated visits to an ED, increased utilization of CT imaging studies, and receipt of temporizing procedures to decompress the upper urinary tract (i.e., ureteral stent or nephrostomy tube placement).
Materials and Methods
Study design and population
After obtaining permission from the California Protection of Human Subjects (CPHS) Committee, we utilized data from the California Office of Statewide Health Planning and Development (OSHPD) from 2010 through 2012 (OSHPD ID 140709-03). This study was approved by the CPHS. The study was determined to be institutional review board (IRB) exempt by our local IRB because the data were not collected specifically for the currently proposed research through an intervention or interaction with living individuals and the data are deidentified.
The OSHPD datasets include information on all nonfederal inpatient hospitalizations and surgeries (Patient Discharge Dataset), ambulatory surgeries (Ambulatory Surgery Dataset), and ED visits (Emergency Department Dataset) from the entire state of California.16 Each individual patient is coded with a unique identifier, so that patients can be followed longitudinally within and among datasets.
We identified all patients who were discharged from an ED with an upper urinary tract stone disease diagnosis and who subsequently underwent an upper tract urinary stone surgery. We considered stone surgery to include ureteroscopy (URS), extracorporeal shockwave lithotripsy (SWL), or percutaneous nephrolithotomy (PCNL) (Supplementary Table S1; Supplementary Data are available online at www.liebertpub.com/end). If patients underwent more than one stone surgery, the date of the first stone surgery was used for the analysis.
We excluded persons <18 years or >90 years. We identified three common and relevant comorbidities (diabetes mellitus, hypertension, and coronary artery disease/peripheral vascular disease). The number of relevant comorbidities was counted for each patient when available. Payer type was categorized into five groups, including Medicare (not including supplemental insurance), Medicaid, private insurance, self-pay/indigent program, and all other payer types.16 Race/ethnicity was self-reported.16
Outcomes
The primary outcome was the time from initial ED visit discharge to the date of a definitive stone surgery in days. We measured three secondary outcomes to assess the potential harm resulting from longer wait times to definitive stone surgery. First, we examined presentation to the ED three or more times before surgery. Three or more visits were chosen as a proxy for a symptomatic patient whose definitive care was most likely delayed. Second, we assessed the number of CT imaging studies performed during ED and inpatient encounters before surgery. Finally, we examined receipt of temporizing upper urinary tract decompression procedures (placement of internal ureteral stent or nephrostomy tube) before surgery. We examined these ancillary procedures as they might be performed in symptomatic patients, or in patients who developed urinary tract infections or AKI.
Statistical analysis
Univariate analysis was performed with the χ2 test for categorical variables and the Kruskal–Wallis test for continuous variables. We illustrated time to surgery stratified by payer type, race/ethnicity, and the type of definitive stone surgery using the Kaplan–Meier product limit estimates. We fit fully adjusted accelerated failure time models to identify patient characteristics independently associated with longer times to surgery.17 In addition, to account for facility-level variation in time to surgery, we fit a multivariable mixed-effects linear regression model for time to surgery, with the treating facility designated as the random effect. We fit models including and not including the type of stone surgery (URS, SWL, and PCNL) as a surrogate measure of total stone burden and as the time to surgery varied by surgical approach. We included two measures of urologist density to measure access to definitive stone surgery: (1) the number of urologists per 10,000 persons in a county and (2) the number of urologists per 100 square miles in a county.18
We fit multivariable mixed-effects logistic regression models to identify factors associated with each secondary outcome, again including the treatment facility as the random effect. These included models to identify factors associated with the secondary outcomes. We performed sensitivity analyses of the model exploring the receipt of decompression by creating models with and without a clinical diagnosis of sepsis.
All two-tailed p-values <0.05 were considered statistically significant. We performed all statistical analyses with R 3.5.0 software (www.R-project.org) and created figures using JMP Pro 13 (Cary, NC).
Results
A total of 15,193 patients were discharged from an ED in the state of California during 2010 through 2012 with a diagnosis of urinary stone disease and subsequently underwent a definitive stone surgery. The distribution of patient characteristics including payer type, race/ethnicity, and the type of stone surgeries is presented in Table 1.
Table 1.
Baseline Patient Characteristics
| No. (%) | White | Hispanic | Black | Asian | Other | |
|---|---|---|---|---|---|---|
| Patient demographics | N = 15,193 | N = 9948 | N = 2975 | N = 539 | N = 944 | N = 787 |
| Sex: | ||||||
| Male | 8564 (56.4) | 5912 (59.4) | 1422 (47.8) | 231 (42.9) | 550 (58.3) | 449 (57.1) |
| Female | 6629 (43.6) | 4036 (40.6) | 1553 (52.2) | 308 (57.1) | 394 (41.7) | 338 (42.9) |
| Median age (25th, 75th percentile range) | 51 (39–61) | 53 (42–63) | 45 (34–55) | 49 (39–59) | 50 (41–60) | 50 (38–58) |
| Payer type | ||||||
| Private | 7780 (51.2) | 5111 (51.4) | 1463 (49.2) | 233 (43.2) | 560 (59.3) | 413 (52.5) |
| Medicaid | 1745 (11.6) | 868 (8.7) | 554 (18.6) | 109 (20.2) | 82 (8.7) | 132 (16.8) |
| Medicare | 3150 (20.7) | 2339 (23.5) | 406 (13.6) | 119 (22.1) | 163 (17.3) | 123 (15.6) |
| Self-pay | 705 (4.6) | 361 (3.6) | 241 (8.1) | 27 (5.0) | 39 (4.1) | 37 (4.7) |
| Other | 1813 (11.9) | 1269 (12.8) | 311 (10.5) | 51 (9.5) | 100 (10.6) | 82 (10.4) |
| Urinary stone surgery type | ||||||
| URS | 8599 (56.5) | 5625 (56.5) | 1676 (56.3) | 317 (58.8) | 527 (55.8) | 454 (57.7) |
| SWL | 5644 (37.1) | 3779 (38.0) | 1079 (36.3) | 177 (32.8) | 343 (36.3) | 286 (36.3) |
| PCNL | 930 (6.1) | 544 (5.5) | 220 (7.4) | 45 (8.4) | 74 (7.8) | 47 (6.0) |
| Comorbiditiesa | ||||||
| 0 | 11,729 (77.2) | 7670 (77.1) | 2270 (76.3) | 434 (80.5) | 724 (76.7) | 631 (80.2) |
| 1 | 2646 (17.4) | 1720 (17.3) | 539 (18.1) | 85 (15.8) | 176 (18.6) | 126 (16.0) |
| ≥2 | 818 (5.4) | 558 (5.6) | 166 (5.6) | 20 (3.7) | 44 (4.7) | 30 (3.8) |
The sum of percentages may not equal 100% because of rounding.
Comorbidities include hypertension, coronary artery disease, peripheral vascular disease, and diabetes mellitus.
PCNL = percutaneous nephrolithotomy; SWL = extracorporeal shockwave lithotripsy; URS = ureteroscopy.
The median time from initial ED visit to definitive surgery was 28 days (25th, 75th percentile range 9–93 days). The median time to surgery for patients varied by payer type, race/ethnicity, and type of stone surgery (Fig. 1).
FIG. 1.

The median time from initial emergency department discharge to definitive surgical management of USD in days by payer type (p < 0.001), race/ethnicity (p < 0.001), and surgical approach (p < 0.001). SWL = extracorporeal shockwave lithotripsy; PCNL = percutaneous nephrolithotomy; URS = ureteroscopy.
A fully adjusted accelerated failure time model showed that patients with Medicaid (event time ratio [ETR] 1.46, 95% confidence interval [CI] 1.34–1.58), Medicare (ETR 1.42, 95% CI 1.32–1.53), and self-pay coverage (ETR 1.60, 95% CI 1.41–1.81) experienced significantly longer mean times to surgery when compared with patients with private insurance (Table 2). When compared with White patients, patients of Black (ETR 1.36, 95% CI 1.19–1.56) and Hispanic (ETR 1.20, 1.13–1.29) race/ethnicity experienced significantly longer mean times to stone surgery (Table 2 and Fig. 2).
Table 2.
Multivariable Accelerated Failure Time Model Indicating Factors Independently Associated with the Time to Definitive Stone Surgery
| Variable | Event time ratio | 95% CI | p |
|---|---|---|---|
| Patient age | 0.99 | 0.98–1.00 | <0.001 |
| Male | 0.98 | 0.93–1.03 | 0.146 |
| Urologist density (per 10,000 persons per county) | 1.40 | 0.56–3.46 | 0.419 |
| Urologist density (per county square mileage) | 0.99 | 0.97–1.01 | 0.280 |
| Comorbiditiesa | 0.93 | 0.89–0.98 | 0.002 |
| Payer type | |||
| Private | Reference | Reference | Reference |
| Medicaid | 1.46 | 1.34–1.58 | <0.001 |
| Medicare | 1.42 | 1.32–1.53 | <0.001 |
| Self-pay | 1.60 | 1.41–1.81 | <0.001 |
| Other | 1.02 | 0.94–1.10 | 0.689 |
| Race/ethnicity | |||
| White | Reference | Reference | Reference |
| Hispanic | 1.20 | 1.13–1.29 | <0.001 |
| Black | 1.36 | 1.19–1.56 | <0.001 |
| Asian | 1.02 | 0.92–1.13 | 0.911 |
| Other | 1.27 | 1.13–1.43 | <0.001 |
| Urinary stone surgery type | |||
| URS | 0.85 | 0.77–0.95 | 0.044 |
| SWL | 0.95 | 0.85–1.06 | 0.628 |
| PCNL | 1.45 | 1.43–1.69 | <0.001 |
| Upper urinary tract decompressionb | 1.64 | 1.51–1.78 | <0.001 |
Larger event time ratios reflect longer wait times. Items in bold met statistical significance threshold.
Comorbidities include hypertension, coronary artery disease, peripheral vascular disease, and diabetes mellitus.
Includes all indications for upper urinary tract decompression. Types of decompression included are ureteral stent and percutaneous nephrostomy tube placement.
CI = confidence interval.
FIG. 2.
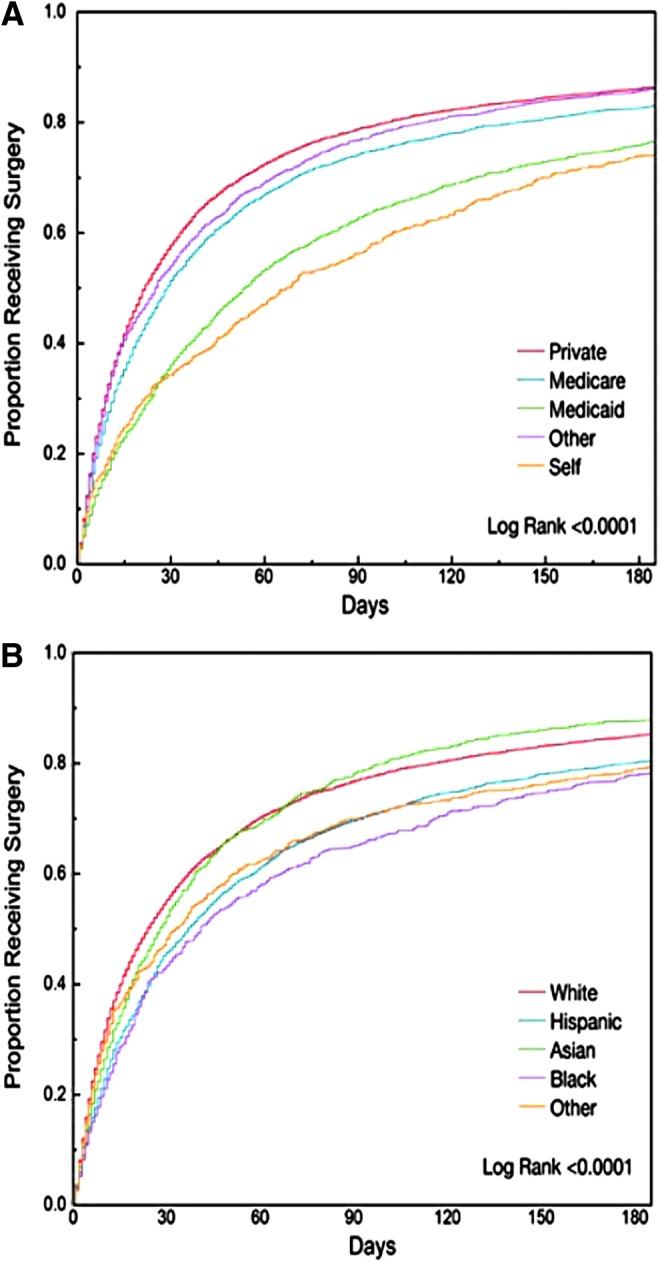
Cumulative incidence curves indicating the proportion of patients who had received definitive stone surgery within 180 days of discharge from an emergency department stratified by payer type (A) and race/ethnicity (B).
We identified variation in time to surgery at the facility level (Supplementary Fig. S1). Disparities in the time to surgery were consistent in multivariable mixed-effects models adjusting for facility-level variation. Patients with Medicaid (25 mean additional days, 95% CI 15–34), Medicare (32 mean additional days, 95% CI 23–40), and self-pay (36 mean additional days, 95% CI 22–51) coverage were associated with significantly longer adjusted mean times to surgery when compared with patients with private insurance (Table 3). In addition, patients of Black (25 mean additional days, 95% CI 10–41) and Hispanic (12 mean additional days, 95% CI 5–20) race/ethnicity experienced significantly longer adjusted mean times to surgery when compared with White patients (Table 3). A sensitivity analysis limiting the cohort to patients who received definitive stone surgery within 180 days of discharge from an ED was not materially different (Supplementary Tables S2 and S3).
Table 3.
Multivariable Mixed-Effects Analysis Adjusting for Facility-Level Variation, Reporting the Mean Increase in Time to Surgery by Patient Characteristics
| Variable | Mean increase in time to surgery (days) | 95% CI | p |
|---|---|---|---|
| Patient age | −0.91 | −1.14 to −0.67 | <0.001 |
| Male | −2.33 | −8.03 to 3.37 | 0.211 |
| Urologist density (per 10,000 persons per county) | 14.57 | −93.02 to 122.51 | 0.396 |
| Urologist density (per county square mileage) | −1.20 | −3.44 to 1.04 | 0.147 |
| Comorbiditiesa | −5.95 | −10.80 to −1.10 | 0.008 |
| Payer type | |||
| Private | Reference | Reference | Reference |
| Medicaid | 24.75 | 15.30 to 34.28 | <0.001 |
| Medicare | 31.68 | 23.16 to 40.20 | <0.001 |
| Self-pay | 36.34 | 22.25 to 50.53 | <0.001 |
| Other | 0.89 | −10.00 to 8.22 | 0.576 |
| Race/ethnicity | |||
| White | Reference | Reference | Reference |
| Hispanic | 12.40 | 4.95 to 19.91 | <0.001 |
| Black | 25.28 | 10.11 to 40.51 | < 0.001 |
| Asian | −3.24 | −14.98 to 8.53 | 0.295 |
| Other | 20.76 | 7.97 to 33.53 | <0.001 |
| Urinary stone surgery type | |||
| URS | −11.85 | −23.79 to 0.09 | 0.026 |
| SWL | −3.16 | −15.19 to 8.84 | 0.303 |
| PCNL | 41.55 | 24.68 to 58.48 | <0.001 |
| Upper urinary tract decompressionb | 60.05 | 50.70 to 69.44 | <0.001 |
Items in bold met statistical significance threshold.
Comorbidities include hypertension, coronary artery disease, peripheral vascular disease, and diabetes mellitus.
Includes all indications for upper urinary tract decompression. Types of decompression included are ureteral stent and percutaneous nephrostomy tube placement.
Secondary outcomes
The proportion of patients with repeated ED visits, additional CT imaging, and upper tract decompression procedures varied by payer type and race/ethnicity (Supplementary Table S4). A total of 1446 patients (9.5%) presented to an ED three or more times before definitive stone surgery. Patients with Medicaid (odds ratio [OR] 2.97, 95% CI 2.53–3.49), Medicare (OR 2.47, 95% CI 2.06–2.96), and self-pay (OR 2.83, 95% CI 2.24–3.56) coverage were significantly more likely to have had three or more ED visits compared with patients with private insurance. Patients of Black race/ethnicity (OR 1.35, 95% CI 1.03–1.76) were significantly more likely to have had three or more ED visits when compared with Whites (Table 4).
Table 4.
Multivariable Logistic Regression Reporting the Odds of Three or More Emergency Department Visits, Two or More CT Imaging Studies, and Upper Urinary Tract Decompression Before Definitive Urinary Stone Surgery
| Three or more ED visits | Two or more CT imaging studies | Upper urinary tract decompression | |||||||
|---|---|---|---|---|---|---|---|---|---|
| Variable | Odds ratio | 95% CI | p | Odds ratio | 95% CI | p | Odds ratio | 95% CI | p |
| Payer type | |||||||||
| Private | Reference | Reference | Reference | Reference | Reference | Reference | Reference | Reference | Reference |
| Medicaid | 2.97 | 2.53–3.49 | <0.001 | 1.79 | 1.32–2.40 | <0.001 | 1.74 | 1.47–2.06 | <0.001 |
| Medicare | 2.47 | 2.06–2.96 | <0.001 | 1.22 | 0.87–1.70 | 0.251 | 1.70 | 1.44–2.01 | <0.001 |
| Self-pay | 2.83 | 2.24–3.56 | <0.001 | 2.15 | 1.43–3.20 | <0.001 | 2.63 | 2.11–3.28 | <0.001 |
| Other | 1.53 | 1.26–1.86 | <0.001 | 1.09 | 0.77–1.50 | 0.641 | 0.75 | 0.60–0.93 | 0.010 |
| Race/ethnicity | |||||||||
| White | Reference | Reference | Reference | Reference | Reference | Reference | Reference | Reference | Reference |
| Hispanic | 0.98 | 0.85–1.14 | 0.797 | 1.03 | 0.78–1.40 | 0.834 | 1.20 | 1.04–1.38 | 0.011 |
| Black | 1.35 | 1.03–1.76 | 0.029 | 0.91 | 0.51–1.40 | 0.763 | 0.96 | 0.72–1.28 | 0.766 |
| Asian | 0.52 | 0.38–0.72 | <0.001 | 0.67 | 0.38–1.20 | 0.182 | 0.79 | 0.61–1.04 | 0.089 |
| Other | 1.11 | 0.86–1.43 | 0.437 | 1.36 | 0.86–2.10 | 0.189 | 0.62 | 0.46–0.83 | 0.002 |
Items in bold met statistical significance threshold.
ED = emergency department.
We identified 980 CT imaging studies performed at ED and inpatient visits after the initial ED discharge. Patients with Medicaid (OR 1.79, 95% CI 1.32–2.40) and self-pay (OR 2.15, 95% CI 1.43–3.20) coverage were significantly more likely to undergo two or more CT scans relative to patients with private insurance (Table 4). Approximately 10% of patients (n = 1511) underwent an upper urinary tract decompression procedure without lithotripsy before a definitive stone surgery. One hundred sixty-nine (11.2%) procedures were associated with a clinical diagnosis of sepsis (Supplementary Table 4). Patients with Medicaid (OR 1.74, 95% CI 1.47–2.06), Medicare (OR 1.70, 95% CI 1.44–2.01), and self-pay coverage (OR 2.63, 95% CI 2.11–3.28) had increased odds of receipt of decompression procedures for all indications when compared with patients with private insurance. Patients of Hispanic race/ethnicity (OR 1.20, 95% CI 1.04–1.38) were also significantly more likely to undergo upper urinary tract decompression for all indications when compared with Whites (Table 4).
Discussion
In this study, we demonstrate significant variation in the time to definitive surgery for upper tract urinary stone disease after an ED discharge in California. Specifically, underinsured patients (persons with Medicaid, Medicare, or self-pay coverage) and patients of Black or Hispanic race/ethnicity experienced a longer time to definitive surgical management. The delays experienced by these groups are concerning as unnecessary delay of a definitive stone surgery can increase the risk of complications, including pyelonephritis, urosepsis, AKI, potentially CKD, as well as substantial pain and loss of productivity.11,19 Disparities in care by payer type and race/ethnicity have been well documented in the management of multiple disease processes and their time to interventions.12–15 Our findings expand on prior reports that underinsured patients presenting to an ED with urinary stone disease were less likely to be admitted to the hospital and undergo immediate definitive stone surgery.20 Our study shows that underinsured and minority patients who present to an ED are also vulnerable to delays in outpatient care of urinary stone disease.
The optimal time for a stone intervention after a trial of spontaneous passage, with or without MET, is not well defined. However, the American Urological Association (AUA) and the Endourological Society guidelines advocate for intervention within 4–6 weeks for patients presenting with a ureteral stone.21 These recommendations are based in part on data that show that 95% of ureteral stones measuring ≤6 mm will pass within 40 days.22
Here, we report that older patients and patients with more comorbidities received definitive stone surgery in a more expedited manner. However, we also report that patients with Medicaid (median of 7.7 weeks) and self-pay (median of 9.7 weeks) coverage experienced delays in the time to surgery that exceeded guideline recommendations. Unfortunately, these underinsured patients are those most at risk of developing complications associated with delayed surgical intervention.23 Given significant differences observed by payer type, we performed a companion analysis restricting the study sample to patients >65 years of age (16% of the sample). We observed no significant differences in time to definitive surgical procedures in the >65 years of age subcohort, suggesting that the differences observed by payer type were driven largely by younger patients.
In addition, delay in a definitive surgical management of urinary stone disease can result in otherwise unnecessary care and temporizing procedures, which themselves carry risk and expense. The AUA guidelines state that recurrent renal colic prompting “repeated visits to the emergency department … are all indications to proceed with surgical intervention.”24 Despite these recommendations, we found that patients with Medicaid, Medicare, or self-pay coverage and patients of Black race/ethnicity were more likely to be seen in an ED three or more times before definitive surgery. Patients with Medicaid or self-pay coverage were also more likely to receive two or more CT imaging studies before a stone surgery. In addition, patients with Medicaid, Medicare, or self-pay coverage and patients of Hispanic race/ethnicity were more likely to undergo upper urinary tract decompression while waiting for a more definitive procedure.
Potential factors that could contribute to the observed inequality by race and ethnicity include cross-cultural miscommunication between the patient and provider,25 lack of trust in the physician or health care system,26 reduced patient willingness to undergo an intervention,27 and reduced access to urologic care.7,28 In a recent retrospective review of acute renal colic management patterns in an ED, only 23% of patients received an ambulatory referral to a urologist, and only 71% of those patients attended a urology appointment. Of those patients not referred to urologic care, only 16% received urologic care through self-referral,29 highlighting the importance of establishing a plan for outpatient urologic care during the ED discharge.
Our study has several notable strengths: in this large population-based study we examined the time to surgery in a populous and diverse state, and were able to measure times to surgery across all payer types. We attempted to control for many potential confounders, including patient-level, facility-level, and surrogate measures of access to urologic care. We also included secondary outcome measures (e.g., repeated visits to an ED, number of CT imaging studies, and upper urinary tract decompression), and we consistently found that underinsured patients were not only more likely to have longer times to definitive stone surgery but were also at higher odds of potential harms associated with these delays.
Our study has limitations common to administrative datasets. We did not have information related to the severity of each patient's stone disease (e.g., stone location, number, type, and size). We are also not able to confirm that the initial ED visit was due to the same stone that was the target of the subsequent surgery. While some patients had long periods between the initial ED presentation and surgery, our results did not materially change when limiting to patients who received surgery within 180 days. Despite the diversity of California, there may be differences in practice patterns and inpatient vs outpatient reimbursement, such that our results may not be generalizable to other states in the United States.
Moreover, despite the large patient sample, California has a lower proportion of Black patients than many other states, and the associations observed by race/ethnicity may vary in different cultural climates. Finally, not all ambulatory surgery centers in California report to California Department of Public Health, and thus would not be reported in the OSHPD database. However, this represents a small number of centers that perform stone surgeries, and therefore would unlikely significantly impact the findings of this study.30
Conclusions
In conclusion, underinsured patients and those of Black or Hispanic race/ethnicity experience a longer time to definitive stone surgery after presenting to an ED with symptomatic upper tract urinary stone disease. Underinsured patients were also more likely to experience potential harm from this delay, with repeated ED visits, repeated CT imaging studies, and more frequent temporizing upper urinary tract decompression before definitive stone surgery. These findings provide rationale for efforts to reduce these disparities and to ensure timely surgical care when necessary for all patients with urinary stone disease.
Supplementary Material
Acknowledgments
This work was supported by the U.S. National Institute of Health/NIDDK K 24 (K24085446) to G.M.C. The contents do not represent the views of the U.S. Department of Veterans Affairs or the U.S. Government.
Abbreviations Used
- AKI
acute kidney injury
- AUA
American Urological Association
- CI
confidence interval
- CKD
chronic kidney disease
- CPHS
California Protection of Human Subjects
- CPT
Common Procedural Terminology
- CT
computed tomography
- ED
emergency department
- ETR
event time ratio
- MET
medical expulsive therapy
- OR
odds ratio
- OSHPD
Office of Statewide Health Planning and Development
- PCNL
percutaneous nephrolithotomy
- SWL
extracorporeal shockwave lithotripsy
- URS
ureteroscopy
Author Disclosure Statement
No competing financial interests exist.
References
- 1. Litwin MS, Saigal CS, Yano EM, et al. Urologic diseases in America Project: Analytical methods and principal findings. J Urol 2005;173:933–937 [DOI] [PubMed] [Google Scholar]
- 2. Scales CD, Smith AC, Hanley JM, Saigal CS; Urologic Diseases in America Project. Prevalence of kidney stones in the United States. Eur Urol 2012;62:160–165 [DOI] [PMC free article] [PubMed] [Google Scholar]
- 3. Ghani KR, Roghmann F, Sammon JD, et al. Emergency department visits in the United States for upper urinary tract stones: Trends in hospitalization and charges. J Urol 2014;191:90–96 [DOI] [PubMed] [Google Scholar]
- 4. Fwu CW, Eggers PW, Kimmel PL, Kusek JW, Kirkali Z. Emergency department visits, use of imaging, and drugs for urolithiasis have increased in the United States. Kidney Int 2013;83:479–486 [DOI] [PMC free article] [PubMed] [Google Scholar]
- 5. Brown J. Diagnostic and treatment patterns for renal colic in US emergency departments. Int Urol Nephrol 2006;38:87–92 [DOI] [PubMed] [Google Scholar]
- 6. Preminger GM, Tiselius HG, Assimos DG, et al. 2007 Guideline for the management of ureteral calculi. J Urol 2007;178:2418–2434 [DOI] [PubMed] [Google Scholar]
- 7. Scales CD, Lin L, Saigal CS, Bennett CJ, Ponce NA, Mangione CM, Litwin MS; NIDDK Urologic Diseases in America Project. Emergency department revisits for patients with kidney stones in California. Acad Emerg Med 2015;22:468–474 [DOI] [PMC free article] [PubMed] [Google Scholar]
- 8. Ganesan V, Loftus CJ, Hinck B, Greene DJ, Nyame YA, Sivalingam S, Monga M. Clinical predictors of 30-day emergency department revisits for patients with ureteral stones. J Urol 2016;196:1467–1470 [DOI] [PubMed] [Google Scholar]
- 9. Portis AJ, Lundquist EL, Portis JL, Glesne RE, Mercer AJ, Lundquist BA, Neises SM. Unsuccessful medical expulsive therapy: A cost to waiting? Urology 2016;87:25–32 [DOI] [PubMed] [Google Scholar]
- 10. Hollingsworth JM, Norton EC, Kaufman SR, Smith RM, Wolf JS, Hollenbeck BK. Medical expulsive therapy versus early endoscopic stone removal for acute renal colic: An instrumental variable analysis. J Urol 2013;190:882–887 [DOI] [PubMed] [Google Scholar]
- 11. Hübner WA, Irby P, Stoller ML. Natural history and current concepts for the treatment of small ureteral calculi. Eur Urol 1993;24:172–176 [DOI] [PubMed] [Google Scholar]
- 12. Bradley EH, Herrin J, Wang Y, et al. Racial and ethnic differences in time to acute reperfusion therapy for patients hospitalized with myocardial infarction. JAMA 2004;292:1563–1572 [DOI] [PubMed] [Google Scholar]
- 13. Bustami RT, Shulkin DB, O'Donnell N, Whitman ED. Variations in time to receiving first surgical treatment for breast cancer as a function of racial/ethnic background: a cohort study. JRSM Open 2014;5:2042533313515863. [DOI] [PMC free article] [PubMed] [Google Scholar]
- 14. Shalowitz DI, Epstein AJ, Buckingham L, Ko EM, Giuntoli RL. Survival implications of time to surgical treatment of endometrial cancers. Am J Obstet Gynecol 2017;216:268.e1–268.e18 [DOI] [PubMed] [Google Scholar]
- 15. Pitman M, Korets R, Kates M, Hruby GW, McKiernan JM. Socioeconomic and clinical factors influence the interval between positive prostate biopsy and radical prostatectomy. Urology 2012;80:1027–1032 [DOI] [PubMed] [Google Scholar]
- 16. Emergency Department (ED) and Ambulatory Surgery (AS) Data Data Dictionary 2010–2014. 2014. Available at: https://oshpd.ca.gov/wp-content/uploads/2018/06/DataDictionary_Public_EDAS.pdf (Accessed August1, 2018)
- 17. Bradburn MJ, Clark TG, Love SB, Altman DG. Survival analysis part II: Multivariate data analysis—An introduction to concepts and methods. Br J Cancer 2003;89:431–436 [DOI] [PMC free article] [PubMed] [Google Scholar]
- 18. Area Health Resource Files 2016–2017. Available at: https://datawarehouse.hrsa.gov (Accessed August1, 2018)
- 19. Saigal CS, Joyce G, Timilsina AR; Urologic Diseases in America Project. Direct and indirect costs of nephrolithiasis in an employed population: Opportunity for disease management? Kidney Int 2005;68:1808–1814 [DOI] [PubMed] [Google Scholar]
- 20. Elder JW, Delgado MK, Chung BI, Pirrotta EA, Wang NE. Variation in the intensity of care for patients with uncomplicated renal colic presenting to U.S. emergency departments. J Emerg Med 2016;51:628–635 [DOI] [PubMed] [Google Scholar]
- 21. Assimos D, Krambeck A, Miller NL, et al. Surgical management of stones: American Urological Association/Endourological Society Guideline, Part II. J Urol 2016;196:1161–1169 [DOI] [PubMed] [Google Scholar]
- 22. Miller OF, Kane CJ. Time to stone passage for observed ureteral calculi: A guide for patient education. J Urol 1999;162:688–690; discussion 690 [DOI] [PubMed] [Google Scholar]
- 23. McWilliams JM. Health consequences of uninsurance among adults in the United States: recent evidence and implications. Milbank Q 2009;87:443–494 [DOI] [PMC free article] [PubMed] [Google Scholar]
- 24. Surgical Management of Stones: American Urological Association/Endourological Society Guideline (Unabridged version). 2016. Available at: https://www.auanet.org/documents/education/clinical-guidance/Surgical-Management-of-Stones.pdf (Accessed July30, 2018)
- 25. Johnson RL, Roter D, Powe NR, Cooper LA. Patient race/ethnicity and quality of patient–physician communication during medical visits. Am J Public Health 2004;94:2084–2090 [DOI] [PMC free article] [PubMed] [Google Scholar]
- 26. Wachterman MW, McCarthy EP, Marcantonio ER, Ersek M. Mistrust, misperceptions, and miscommunication: A qualitative study of preferences about kidney transplantation among African Americans. Transplant Proc 2015;47:240–246 [DOI] [PMC free article] [PubMed] [Google Scholar]
- 27. Ibrahim SA. Racial variations in the utilization of knee and hip joint replacement: An introduction and review of the most recent literature. Curr Orthop Pract 2010;21:126–131 [DOI] [PMC free article] [PubMed] [Google Scholar]
- 28. Cook NL, Ayanian JZ, Orav EJ, Hicks LS. Differences in specialist consultations for cardiovascular disease by race, ethnicity, gender, insurance status, and site of primary care. Circulation 2009;119:2463–2470 [DOI] [PubMed] [Google Scholar]
- 29. Jackson J, Farhi J, Wheeler K, Rueb G, Thom C, Schenkman N. Retrospective review of acute renal colic management in the emergency department and review of guidelines. Urol Pract 2018;5:113–119 [DOI] [PubMed] [Google Scholar]
- 30. California Office of Statewide Health Planning and Development. California Inpatient Data Reporting Manual, Medical Information Reporting for California, 7th ed. 2014.. Available at: www.oshpd.ca.gov/hid/mircal/text_pdfs/manualsguides/ipmanual/rptngreq.pdf (Accessed July25, 2018)
Associated Data
This section collects any data citations, data availability statements, or supplementary materials included in this article.