

Abstract

Multiplexing and quantification of nucleic acids, both have, in their own right, significant and extensive use in biomedical related fields. Currently, the ability to detect several nucleic acid targets in a single-reaction scales linearly with the number of targets; an expensive and time-consuming feat. Here, we propose a new methodology based on multidimensional standard curves that extends the use of real-time PCR data obtained by common qPCR instruments. By applying this novel methodology, we achieve simultaneous single-channel multiplexing and enhanced quantification of multiple targets using only real-time amplification data. This is obtained without the need of fluorescent probes, agarose gels, melting curves or sequencing analysis. Given the importance and demand for tackling challenges in antimicrobial resistance, the proposed method is applied to four of the most prominent carbapenem-resistant genes: blaOXA-48, blaNDM, blaVIM, and blaKPC, which account for 97% of the UK’s reported carbapenemase-producing Enterobacteriaceae.
This work demonstrates simultaneous multiplex qPCR and absolute quantification using standard curves, employing only a single fluorescence channel without post-PCR analysis; such that it can be used with conventional qPCR instruments. This is achieved by extending the quantification framework proposed by Moniri et al.,1 to establish that multidimensional standard curves (MSCs) can also be used for target identification. The proposed method is validated for the detection of the β-lactamase genes blaOXA-48, blaNDM, blaVIM, and blaKPC using bacterial isolates from clinical samples in a single-reaction; without fluorescent probes, agarose gels, melting curves or sequencing analysis. Table 1 summarizes the breakdown of confirmed carbapenemase-producing Enterobacteriaceae (CPE) cases in the U.K. from 2003 to 2015. The chosen drug-resistant genes in this study cover over 97% of the total reported cases. Diagnostic instruments that incorporate our methodology will greatly expand the applicability of emerging molecular technologies.2,3
Table 1. Laboratory Confirmed Cases of Carbapenemase-Producing Enterobacteriaceae from U.K. Laboratories (2003–2015)a.
| carbapenemases | blaOXA-48 | blaNDM | blaVIM | blaKPC | others |
|---|---|---|---|---|---|
| total cases | 1325 | 1129 | 491 | 3260 | 189 |
| percentage (%) | 20.73 | 17.67 | 7.68 | 51.01 | 2.96 |
Data obtained from the Public Health England’s Antimicrobial resistance and healthcare associated infections reference unit.4
Invasive infections with carbapenemase-producing strains are associated with high mortality rates (up to 40–50%) and represent a major public health concern worldwide.5,6 Rapid and accurate screening for carriage of CPE is essential for successful infection prevention and control strategies, as well as bed management.7,8 However, routine laboratory detection of CPE based on carbapenem susceptibility is challenging:9 (i) culture-based methods have limited sensitivity and a long turnaround time; (ii) nucleic acid amplification techniques (NAATs) are often too expensive and require sophisticated equipment to be used as a screening tool in healthcare systems; and (iii) multiplexed NAATs have not been able to meet the demand for high-level multiplexing using available technologies.
There is an unmet clinical need for new molecular tools that can be successfully adopted within existing healthcare settings. The proposed method allows existing technologies to benefit from the advantages of multiplex PCR assays while reducing the complexity of CPE screening, resulting in a time- and cost-effective solution. This is enabled through changing the fundamental approach to current data analytic techniques for the quantification of nucleic acids from unidimensional to multidimensional. Figure 1 compares both (a) the conventional approach versus (b) the proposed method for single-channel multiplexing. In the first, conventional standard curves are constructed but multiple targets cannot be differentiated and quantified without post-PCR processing. In contrast, the proposed method constructs multidimensional standard curves, extracting more information from the amplification curves, allowing for simultaneous quantification and multiplexing in a single channel. This work uses CPE as a clinically relevant case study; however, the authors invite researchers to explore other targets and amplification chemistries in order to expand the capabilities of current state-of-the art technologies.
Figure 1.

Illustration of experimental workflow for single-channel multiplex quantitative PCR using a unidimensional and multidimensional approach. An unknown DNA sample is amplified by multiplex qPCR for targets 1, 2, and 3. Features denoted using dummy variables α, β, and γ are extracted from the amplification curve. It is important to stress that any number of targets and features could have been chosen. (a) Unidimensional analysis. Three conventional standard curves are generated through serial dilution of the known targets using a single feature. Given it is not possible to identify the target based on these standard curves, post-PCR analysis is required for target identification and quantification. (b) Multidimensional analysis. Three multidimensional standard curves are constructed through serial dilution of the known targets using multiple features. The unknown samples can be confidently classified and enhanced quantification can be achieved by combining all the features into a unified feature called M0.1
Experimental Section
Primers and Amplification Reaction Conditions
All oligonucleotides used in this study were synthesized by IDT (Integrated DNA Technologies, Germany), with no additional purification. Primers were previously reported by Monteiro et al.10 (see Table 2). Each amplification reaction was performed in 5 μL of final volume with 2.5 μL of FastStart Essential DNA Green Master 2× concentrated (Roche Diagnostics, Germany), 1 μL of PCR grade water, 0.5 μL of 10× multiplex PCR primer mixture containing the four primer sets (5 μM of each primer), and 1 μL of different concentrations of synthetic DNA or bacterial genomic DNA. PCR amplifications consisted of 10 min at 95 °C, followed by 45 cycles at 95 °C for 20 s, 68 °C for 45 s, and 72 °C for 30 s. In order to validate the proposed method, the results were compared against melting curve analyses. One melting cycle was performed at 95 °C for 10 s, 65 °C for 60 s, and 97 °C for 1 s (continuous reading from 65 to 97 °C). Each experimental condition was run 5–8 times, loading the reactions into Light Cycler 480 Multiwell Plates 96 (Roche Diagnostics, Germany) using a Light Cycler 96 Real-Time PCR System (Roche Diagnostics, Germany). Appropriate negative and positive controls were included in each experiment.
Table 2. Primers Used for Multiplexing qPCR Assaya.
| target | primer | sequence | size |
|---|---|---|---|
| blaOXA-48 | F | TGTTTTTGGTGGCATCGAT | 177 |
| R | GTAAMRATGCTTGGTTCGC | ||
| blaNDM | F | TTGGCCTTGCTGTCCTTG | 82 |
| R | ACACCAGTGACAATATCACCG | ||
| blaVIM | F | GTTTGGTCGCATATCGCAAC | 382 |
| R | AATGCGCAGCACCAGGATAG | ||
| blaKPC | F | TCGCTAAACTCGAACAGG | 785 |
| R | TTACTGCCCGTTGACGCCCAATCC |
Primer sequences were previously reported by Monteiro et al.10 Sequences are given in the 5′ to 3′ direction. Size is given in base pairs and denotes PCR amplification products.
Synthetic DNA and Bacterial Isolates
Four synthetic double-stranded DNA (gBlock Gene fragments) were purchased from IDT and resuspended in TE buffer to 10 ng/μL stock solutions (stored at −20 °C until further use). The concentrations of all DNA stock solutions were determined using a Qubit 3.0 fluorimeter (Life Technologies). The synthetic templates contained the DNA sequence from blaOXA-48, blaNDM, blaVIM, and blaKPC genes required for the multiplex qPCR assay (Table S1). Standard curves were constructed utilizing different DNA concentrations as follows: blaOXA-48 (108–104 copies/reaction), blaNDM (107–101 copies/reaction), blaVIM (108–103 copies/reaction), and blaKPC (108–103 copies/reaction). Pure bacterial cultures from clinical isolates were used in this study, as described in Table 3. One loop of colonies from each pure culture was suspended in 50 μL of digestion buffer at pH 8.0 (Tris-HCl 10 mmol/L, EDTA 1 mmol/L, and 5 U/μL lysozyme) and incubated at 37 °C for 30 min in a dry bath. Subsequently, 0.75 μL of proteinase K at 20 μg/μL (Sigma) was added, and the solution was incubated at 56 °C for 30 min. Afterward, the solution was boiled for 10 min to inactivate proteinase K, the samples were centrifuged at 10000 × g for 5 min and the supernatant was transferred in a new tube and stored at −80 °C before use. Sample 9 was generated by mixing sample 6 and 8 at equal proportions. Non-CPE producers Klebsiella pneumoniae and Escherichia coli were included as control strains.
Table 3. Bacterial Isolates Used in This Study.
| sample ID | bacterial isolate | Carbapenemase genes |
|---|---|---|
| 1 | Klebsiella pneumoniae | blaOXA-48 |
| 2 | Escherichia coli | blaOXA-48 |
| 3 | Citrobacter freundii | blaVIM |
| 4 | Escherichia coli | blaNDM |
| 5 | Klebsiella pneumoniae | blaOXA-48 |
| 6 | Klebsiella pneumoniae | blaNDM |
| 7 | Pseudomonas aeruginosa | blaVIM |
| 8 | Klebsiella pneumoniae | blaKPC |
| 9 | Klebsiella pneumoniae | blaNDM+blaKPC |
| 10 | Klebsiella pneumoniae | nonproducer |
| 11 | Escherichia coli | nonproducer |
Multidimensional Standard Curves
The data analysis for simultaneous quantification and multiplexing is achieved by extending the framework described in Moniri et al.1 This framework provides a generalization of the approach for quantification of nucleic acids using standard curves. The stages of data analysis are as follows: preprocessing, curve-fitting, multiple feature extraction, high-dimensional line fitting, similarity measure, feature weighting, and dimensionality reduction. The major difference with the conventional approach to quantification is that multiple features are extracted from amplification curves. The stages used in this work, also referred to as the instance of framework, are described below and summarized in Table 4.
Table 4. Instance of Framework Proposed in Moniri et al.1.
| data analysis stages | method | ref |
|---|---|---|
| preprocessing | baseline correction | |
| curve fitting | 5-parameter sigmoid | (11) |
| feature extraction | Ct, Cy, and –log10(F0) | (12−14) |
| line fitting | method of least-squares | (15) |
| similarity measure | mahalanobis distance: d | (1,16) |
| feature weights | minimize figure of merit: Q | (1) |
| dimensionality reduction | principal component regression: M0 | (15) |
i. Preprocessing
The only preprocessing common to all features in this instance of framework is background subtraction. This is accomplished using baseline subtraction by removing the mean of the first five fluorescence readings from every amplification curve.
ii. Curve Fitting
The chosen model for curve fitting is the 5-parameter sigmoid (Richards Curve) given by the following:
| 1 |
where x is the cycle number, F(x) is the fluorescence at cycle x, Fb is the background fluorescence, Fmax is the maximum fluorescence, c is the fractional cycle of the inflection point, b is related to the slope of the curve, and d allows for an asymmetric shape (Richard’s coefficient).
The optimization algorithm used to fit the curve to the data is the trust-region method and is based on the interior reflective Newton method.17,18 The lower and upper bounds for the five parameters, [Fb, Fmax, c, b, d], are given as [−0.5, −0.5, 0, 0, 0.7] and [0.5, 0.5, 50, 100, 10], respectively.
iii. Feature Extraction
The features extracted from the amplification curves are: Ct, Cy, and −log10(F0). Therefore, each point in the feature space is a vector in 3-dimensional space, that is, p = [Ct, Cy, −log10(F0)]T where [·]T denotes the transpose operator. Note that, by convention, for the formulas in this paper, vectors are denoted using bold lowercase letters, and matrices are indicated using bold uppercase letters.
In order to compute the cycle-threshold, Ct, first the amplification curve is fit with the 5-parameter sigmoid in eq 1. The fit is then normalized with respect to the maximum fluorescence and Ct is equal to the time where the fit exceeds 0.2 (i.e., 20% of its maximum fluorescence). The second feature, proposed by Guescini et al.,13 referred to as Cy, also uses the 5-parameter sigmoidal curve-fitting and takes Cy as the intersection between the abscissa axis and the tangent of the inflection point from the obtained Richards curve. The final feature, proposed by Rutledge,14 referred to in this paper as F0, fits the sigmoid up to a “cut-off cycle” and takes F0 as the fluorescence at cycle 0.
Each feature has an underlying assumption and, therefore, the combination of the features are expected to increase the amount of information obtained from the amplification curve. For example, the Ct approach assumes the PCR efficiency to be constant between reactions and cycles. The Cy approach allows for different efficiency between reactions but assumes a constant efficiency between cycles. The third feature, F0, allows for different efficiency between reactions but additionally assumes that it decreases from cycle to cycle. The reader may wish to review these papers to understand each feature in greater depth.12−14
iv. Line Fitting
In this work, the line fitting, which is essentially constructing the MSC, is achieved by using the first principal direction in principal component analysis (PCA); or equivalently, the method of least squares.
v. Similarity Measure
The similarity measure used is the Mahalanobis distance, d, as seen in eq 3.18 This is a measure of similarity between a test point, p, and the distribution of training points from a specific MSC.
| 2 |
| 3 |
where q1 and q2 are two distinct points that lie on the MSC and Σ is the covariance matrix of the training data. Note that, under the assumption that the data is normally distributed, the Mahalanobis distance squared follows a χ2 distribution.
vi. Feature Weights
In order to maximize quantification performance, different weights, α, can be assigned to each feature. In order to accomplish this, a simple optimization algorithm can be implemented in order to minimize an error measure. In this study, the error measure used is the figure of merit described in the following subsection. The optimization algorithm is the Nelder–Mead simplex algorithm19,20 with weights initialized to unity, that is, beginning with no assumption on how good features are for quantification. This is a basic algorithm and only 20 iterations are used to find the weights so that there is little computational overhead.
vii. Dimensionality Reduction
In this study, principal component regression is used, that is, M0 = P from eq 2,17 and it is compared with projecting the standard curve onto all three dimensions, i.e. Ct, Cy, and −log10(F0).
Evaluating Standard Curves
Consistent with the current literature on evaluating standard curves, relative error (RE) and average coefficient of variation (CV) are used to measure accuracy and precision, respectively. The CV for each concentration is calculated after normalizing the standard curves such that a fair comparison across standard curves is achieved. The formula for the two measures are given by
| 4 |
where i is the index of a given training point, xi is the true concentration of the ith training data, and x̂i is the estimate of xi using the standard curve.
| 5 |
where j is the index of a given concentration and x̂j is a vector of estimated concentrations for a given concentration indexed by j. The function std(·) and mean(·) perform the sample standard deviation and sample mean of their vector arguments, respectively. Borrowed from Statistics, this paper also uses the leave-one-out cross validation (LOOCV) error as a measure for stability and overall predictive performance.15 Stability refers to the predictive performance when training points are removed. The equation for calculating the LOOCV is given as
| 6 |
where N is the number of training points, i is the index of a given training point, zi is a vector of the true concentration for all training points except the ith training point and ẑi is the estimate of zi generated by the standard curve without the ith training point. In order for the optimization algorithm for computing α to simultaneously minimize the three aforementioned measures, it is convenient to introduce a figure of merit, Q, to capture all of the desired properties. Therefore, Q is defined as the product between all three errors and can be used to heuristically used to compare the performance across quantification methods. The average Q across all training data points is the error measure that the optimization algorithm will minimize.
| 7 |
Statistical Analysis
For sample classification, outliers were determined using a χ2 distribution with two degrees of freedom and a statistical significance was assumed with a p-value < 0.01. For assessing the significance between methods in absolute quantification, p-values were calculated using a paired, two-sided Wilcoxon signed rank test. Statistically significant difference was considered as *p-value < 0.05, **p-value < 0.01, ***p-value < 0.001, and ****p-value < 0.0001.
Results and Discussion
In this study, it is shown that simultaneous enhanced quantification and multiplexing of blaOXA-48, blaNDM, blaVIM, and blaKPC β-lactamase genes in bacterial isolates can be achieved by using multidimensional standard curves constructed using fluorescent amplification curves in qPCR. This section is broken into two parts: (i) target discrimination using multidimensional analysis and (ii) enhanced quantification. First, it is proven that single-channel multiplexing can be achieved. Once this has been established, the framework described in Moniri et al.1 can be applied for robust and enhanced quantification.
Target Discrimination using Multidimensional Analysis
Given that it is nontrivial that several targets can be multiplexed and differentiated using only fluorescent amplification data in a single channel, it is helpful to visualize an example. Figure 2 shows four amplification curves and their respective derived melting curves specific for blaOXA-48, blaNDM, blaVIM, and blaKPC genes. The four curves have been chosen to have similar Ct (within 1.2 cycles). Using only this information, that is, the conventional way of thinking, post-PCR processing such as melting curve analysis is needed to differentiate the targets. The same argument applies when solely observing Cy or F0. This is an expected result given that these parameters are used for quantification and were not intended for target identification.
Figure 2.

Experimentally obtained amplification and melting curves by single-channel multiplex quantitative PCR for (a) blaOXA-48, (b) blaNDM, (c) blaVIM, and (d) blaKPC genes. Extracted features (Ct, Cy, and F0) are shown on the respective plots. Each plot has been generated by amplifying standard synthetic DNA containing the target of interest. Background subtraction has been performed on all amplification curves and all samples contain SYBR Green I dye.
Moniri et al.1 shows that considering multiple features contains sufficient information gain in order to discriminate outliers from a specific target using a MSC. However, this raises the question: does the outlier lie on its own MSC? If so, can we take advantage of this property and build several multidimensional standard curves in order to discriminate multiple specific targets?
To explore this new concept, MSCs are constructed using a single primer mix for the four target genes using Ct, Cy, and −log10(F0), as shown in Figure 3. It is visually observed that the four standards are sufficiently distant in multidimensional space, also termed the feature space, in order to distinguish them. That is, an unknown DNA sample can be potentially classified as one of the specific targets (or an outlier) solely using the extracted features from amplification curves in a single channel.
Figure 3.
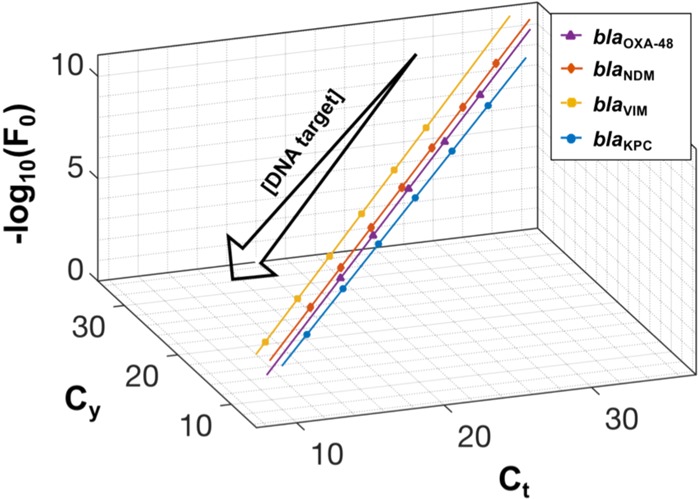
Multidimensional standard curves for detection of four carbapenemase genes: blaOXA-48 (purple line), blaNDM (red line), blaVIM (yellow line), and blaKPC (blue line). They were constructed using Ct, Cy, and −log10(F0) features extracted from real-time amplification curves derived from amplifying 10-fold dilutions of synthetic DNA. From bottom left to top right, target concentrations range between: 108–104 copies/reaction for blaOXA-48; 107–101 copies/reaction for blaNDM; 108–103 copies/reaction for blaVIM; and 108–103 copies/reaction for blaKPC. Each concentration was repeated 5–8 times, and the resulting average values are projected onto the standard curves. The computed features and curve-fitting parameters for each MSC is presented in Table S2.
In order to demonstrate the proposed method for multiplexing, 11 samples (bacterial isolates) given in Table 3 were tested against the multidimensional standards. The specificity of all results was validated using a melting curve analysis (Figure S1). As expected, samples 1–9 provided a positive outcome whereas samples 10 and 11 (control strains) showed no amplification. The similarity measure used to classify the unknown samples is the Mahalanobis distance using a p-value of 0.01 as the threshold to determine if the sample is an outlier. The results from testing can be succinctly captured within a bar chart shown in Figure 4. There are two main observations: (i) the mean of the test samples (bacterial isolates), which have a single resistance (samples 1–8), are correctly classified with a p-value < 0.01; (ii) the target with multiple resistances (sample 9) is considered as an outlier for all of the targets. Although multiple resistances are not currently common for CPE in the U.K. (accounting for less than 1.3% of confirmed cases),4 there is room to explore extending MSCs for other applications that require detecting multiple targets in a single reaction. However, this is outside the scope of this study.
Figure 4.
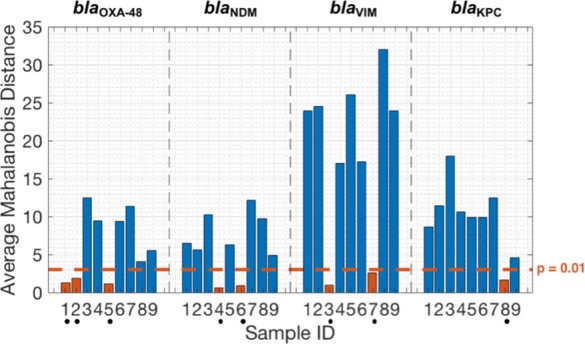
Average Mahalanobis distance between multidimensional standard curves and sample test points (bacterial isolates) used for target identification. Dots below sample ID indicate that the test sample is classified to the standard of interest with a p-value < 0.01.
In addition to observing the average Mahalanobis distance, it is important to visualize the data in order to confirm that the Mahalanobis distance is a suitable similarity measure. Figure 5 shows the Mahalanobis space for the four standards. This visualization is constructed by projecting all data points onto an arbitrary hyperplane orthogonal to each multidimensional standard curve, as described in Moniri et al.1 When the training data points in the feature space are approximately normally distributed, then the distribution of the training data points in the Mahalanobis space is approximately circular, as seen in Figure 5. It can also be observed that the training points (synthetic DNA) from each standard curve are clustered together (i.e., not considered outliers) in its respective Mahalanobis space; however, they are considered outliers for other MSCs. This corroborates the fact that there is sufficient information in the three chosen features to distinguish the four standard curves.
Figure 5.

Multidimensional analysis using the feature space for identification of unknown samples. (a–d) All data points, including the replicates for each concentration for the four MSCs (training standard points) and nine unknown samples (test points), have been projected onto arbitrary hyperplanes orthogonal to each MSC. (e–h) The previous plots are magnified to visualize the location of the samples relative to each standard of interest. The blue dots represent the data points for each standard of interest (5–8 replicates per each concentration) and the black circle around them corresponds to a p-value of 0.01. Samples 1–8 are correctly classified with a p-value < 0.01, whereas sample 9 is considered an outlier for all standards. Please see Table S3 for details on the extracted features and sigmoidal curve fittings and Table S4 for the estimated quantification of samples using all methods.
Enhanced Quantification
Given that multiplexing has been established for this case study, quantification can be trivially obtained using any conventional method such as the gold standard cycle threshold, Ct. However, as shown in Moniri et al.,1 enhanced quantification can be achieved using a feature, M0, that combines all of the features. This is enabled through weighting each feature by optimizing an objective function and then applying a dimensionality reduction technique in order to create a quantification curve for M0. The objective function in this study is a figure of merit, Q, that combines accuracy, precision, stability, and overall predictive power, as described in the Experimental Section. Figure 6 shows the average figure of merit (with standard deviation and p-values) for each target using the three chosen features (Ct, Cy, and −log10(F0)) and M0. Please see Figure S2 for the quantification curves and details for the figure of merit. It can be observed from Figure 6 that quantification using M0 performs as good, or better than any single feature, for any of the targets. This is expected given the nature of the multidimensional framework as M0 is constructed using a linear combination of the other features in order to minimize the average figure of merit. It is important to stress that any figure of merit could be selected. For blaOXA-48, blaVIM, and blaKPC, the average figure of merit of M0 was reduced by 26.5%, 41.1%, and 12.9% compared with the best single feature, Cy, with all p-values < 0.05. Furthermore, for blaNDM, the optimization algorithm showed that M0 converged to Ct and that the p-value between Ct and Cy was not significant. Therefore, in this case, it is acceptable to use either Ct, Cy, or M0. However, M0 provides an automated solution for quantification that is robust in the sense that it will always be the best performing method.
Figure 6.

Figure of merit comparing conventional features with M0 for absolute quantification. F0 denotes −log10(F0). Bar plots represent the average figure of merit for each feature and the error bars indicate the standard deviation. Please see Figure S2 for details.
Conclusion
There has been a long-standing goal to meet the demand of methods for high-level multiplexing and enhanced quantification. Any advancements in this area would have a substantial positive impact on healthcare and patient outcomes. Alongside these challenges, there is a growing concern around antimicrobial resistance; the past 10 years has seen an explosion in molecular methods and instruments for rapid screening of drug resistant genes.21 Here, we propose a novel method that allows for simultaneous single channel multiplexing and enhanced quantification using existing technologies; without increase in complexity or cost over using conventional singleplex qPCR reactions for detecting multiple targets. This method has been validated for the detection of four of the most prominent carbapenem-resistant genes: blaOXA-48, blaNDM, blaVIM, and blaKPC.
Methods for multiplexing and quantifying typically involve using fluorescent probes, melting curve analysis, agarose gels or sequencing, all of which are time-consuming or expensive processes. In the past few years there have been attempts to achieve simultaneous multiplexing and quantification in a single channel. For instance, single channel multiplexing has been achieved without melting curve analysis by altering cycling conditions and reading fluorescence at different temperatures.22 This resulted in sufficient information gain in order to discriminate two targets. However, this method still uses a unidimensional approach to data analytics and increasing the number of targets is not trivial. By extracting multiple features from existing data, our methodology represents an opportunity to evolve existing approaches in order to significantly increase the number of targets.
In order to implement our methodology, we require: (i) to build multiple multidimensional standard curves. This is generally a one-time procedure; however, MSCs may be affected by variations between experiments (such as changing reagent batches or instruments). Therefore, as with conventional standard curves, MSCs may have to be eventually recalibrated; (ii) to design multiplex assays such that MSCs for each target are sufficiently distant in the feature space. This can be achieved by tuning reaction conditions or primer design. For example, by altering annealing temperature, amplicon length, introducing mismatches or primer mix concentration; and (iii) to perform data processing (such as multifeature extraction) which is negligible given the power of computers today.
In addition, given the nature of the multidimensional framework, absolute quantification is enhanced through the use of M0 by optimizing a figure of merit combining accuracy, precision, stability and overall predictive power. The authors invite researchers in this area to adopt M0, as an alternative to conventional standard curves for absolute quantification, as it guarantees improved performance by combining the benefits of all the features it is derived from. This property results in M0 offering a robust method of quantification in the sense that it provides the best quantification performance across targets. Furthermore, the capabilities of MSCs extend beyond quantification and allow for outlier detection and target identification.
Given the novelty of this work, there are many future directions and questions that can be addressed. In this paper we have applied the proposed method to the rapid screening of the four most prominent carbapenemase genes in the U.K. In future studies, it would be interesting to explore: other targets in order to develop new multiplexing panels associated with the most significant healthcare challenges; or more targets through incorporating additional MSCs into the feature space and/or using multiple fluorescent channels. It is also important to stress that the focus of this work was not on optimizing the chemistry or data analytics for this specific set of targets. Thus, there is room to investigate whether the chemistry and the instance of framework can be optimized in order to maximize the separation of MSCs in the feature space for carbapenem-resistant genes.
In conclusion, this work has shown that is possible to simultaneously quantify and multiplex several targets in a single channel. This is achieved by changing the way we analyze amplification data obtained from existing technologies. We hope that by sharing these ideas, researchers and practitioners can implement and advance this work in order to provide novel and affordable tools that can be easily adopted by healthcare systems.
Acknowledgments
We would like to acknowledge the Imperial Confidence in Concepts - Joint Translational Fund, the Wellcome Trust ISSF (PS3111EESA to P.G. and J.R.M.), the EPSRC Pathways to Impact (PSE394EESA to P.G. and J.R.M.) and the EPSRC Global Challenge Research Fund (EP/P510798/1 to P.G. and J.R.M.) for supporting this work. The research was also partially funded by the National Institute for Health Research Health Protection Research Unit (NIHR HPRU) in Healthcare Associated Infection and Antimicrobial Resistance at Imperial College London in partnership with Public Health England (PHE; HPRU-2012-10047 to A.H.). The views expressed are those of the author(s) and not necessarily those of the NHS, the NIHR, the Department of Health or Public Health England.
Supporting Information Available
The Supporting Information is available free of charge on the ACS Publications website at DOI: 10.1021/acs.analchem.8b04412.
Synthetic DNA sequences, extended numerical values of features and sigmoidal fittings of standards and samples, melting analysis of standards and samples, standard curves generated utilizing different features, and quantification of samples using different methods (PDF).
Author Contributions
The manuscript was written through contributions of all authors. All authors have given approval to the final version of the manuscript.
Author Contributions
‡ These authors contributed equally.
The authors declare no competing financial interest.
Supplementary Material
References
- Moniri A.; Rodriguez-Manzano J.; Georgiou P. bioRxiv 2018, na. [Google Scholar]
- Moser N.; Rodriguez-Manzano J.; Lande T. S.; Georgiou P. IEEE Trans. Biomed. Circuits Syst. 2018, 12, 1–12. 10.1109/TBCAS.2017.2789161. [DOI] [PubMed] [Google Scholar]
- Moser N.; Rodriguez-Manzano J.; Yu L.-S.; Kalofonou M.; de Mateo S.; Li X.; Lande T. S.; Toumazou C.; Georgiou P.. 2017 IEEE International Symposium on Circuits and Systems (ISCAS); IEEE, 2017; p 1.
- Carbapenemase-Producing Enterobacteriaceae: Laboratory Confirmed Cases; United Kingdom, 2016.
- van Duin D.; Doi Y. Virulence 2017, 8 (4), 460–469. 10.1080/21505594.2016.1222343. [DOI] [PMC free article] [PubMed] [Google Scholar]
- Otter J. A.; Burgess P.; Davies F.; Mookerjee S.; Singleton J.; Gilchrist M.; Parsons D.; Brannigan E. T.; Robotham J.; Holmes A. H. Clin. Microbiol. Infect. 2017, 23 (3), 188–196. 10.1016/j.cmi.2016.10.005. [DOI] [PubMed] [Google Scholar]
- Otter J. A.; Doumith M.; Davies F. J.; Mookerjee S.; Dyakova E.; Gilchrist M.; Brannigan E. T.; Bamford K. B.; Galletly T.; Donaldson H.; Aanensen D. M.; Ellington M. J.; Hill R. R.; Turton J. F.; Hopkins K. L.; Woodford N.; Holmes A. H. Sci. Rep. 2017, 7, na. 10.1038/s41598-017-12637-4. [DOI] [PMC free article] [PubMed] [Google Scholar]
- Carmeli Y.; Akova M.; Cornaglia G.; Daikos G.; Garau J.; Harbarth S.; M Rossolini G.; Souli M.; Giamarellou H. Clin. Microbiol. Infect. 2010, 16, 102–111. 10.1111/j.1469-0691.2009.03115.x. [DOI] [PubMed] [Google Scholar]
- Viau R.; Frank K. M.; Jacobs M. R.; Wilson B.; Kaye K.; Donskey C. J.; Perez F.; Endimiani A.; Bonomo R. A. Clin. Microbiol. Rev. 2016, 29 (1), 1–27. 10.1128/CMR.00108-14. [DOI] [PMC free article] [PubMed] [Google Scholar]
- Monteiro J.; Widen R.; C C Pignatari A.; Kubasek C.; Silbert S. J. Antimicrob. Chemother. 2012, 67, 906–909. 10.1093/jac/dkr563. [DOI] [PubMed] [Google Scholar]
- Spiess A.-N.; Feig C.; Ritz C. BMC Bioinf. 2008, 9, 221–232. 10.1186/1471-2105-9-221. [DOI] [PMC free article] [PubMed] [Google Scholar]
- Wittwer C. T.; Herrmann M. G.; Moss A. A.; Rasmussen R. P. BioTechniques 1997, 22, 130–138. 10.2144/97221bi01. [DOI] [PubMed] [Google Scholar]
- Guescini M.; Sisti D.; Rocchi M.; Stocchi L.; Stocchi V. BMC Bioinf. 2008, 9, 326–337. 10.1186/1471-2105-9-326. [DOI] [PMC free article] [PubMed] [Google Scholar]
- Rutledge R. Nucleic Acids Res. 2004, 32, 178. [DOI] [PMC free article] [PubMed] [Google Scholar]
- Hastie T; Tibshirani F. J.. The Elements of Statistical Learning; Springer-Verlag: New York, 2009. [Google Scholar]
- Maesschalck R. De; Jouan-Rimbaud D.; Massart D. L. Chemom. Intell. Lab. Syst. 2000, 50 (1), 1–18. 10.1016/S0169-7439(99)00047-7. [DOI] [Google Scholar]
- Coleman T. F.; Li Y. SIAM J. Optim. 1996, 6 (2), 418–445. 10.1137/0806023. [DOI] [Google Scholar]
- Coleman T. F.; Li Y. Math. Program. 1994, 67 (1–3), 189–224. 10.1007/BF01582221. [DOI] [Google Scholar]
- Nelder J. A.; Mead R. Comput. J. 1965, 7 (4), 308–313. 10.1093/comjnl/7.4.308. [DOI] [Google Scholar]
- Lagarias J. C.; Reeds J. A.; Wright M. H.; Wright P. E. SIAM J. Optim. 1998, 9 (1), 112–147. 10.1137/S1052623496303470. [DOI] [Google Scholar]
- Osei Sekyere J.; Govinden U.; Essack S. Y. J. Appl. Microbiol. 2015, 119 (5), 1219–1233. 10.1111/jam.12918. [DOI] [PubMed] [Google Scholar]
- Lee Y. J.; Kim D.; Lee K.; Chun J. Y. Sci. Rep. 2015, 4, 7439–7444. 10.1038/srep07439. [DOI] [PMC free article] [PubMed] [Google Scholar]
Associated Data
This section collects any data citations, data availability statements, or supplementary materials included in this article.