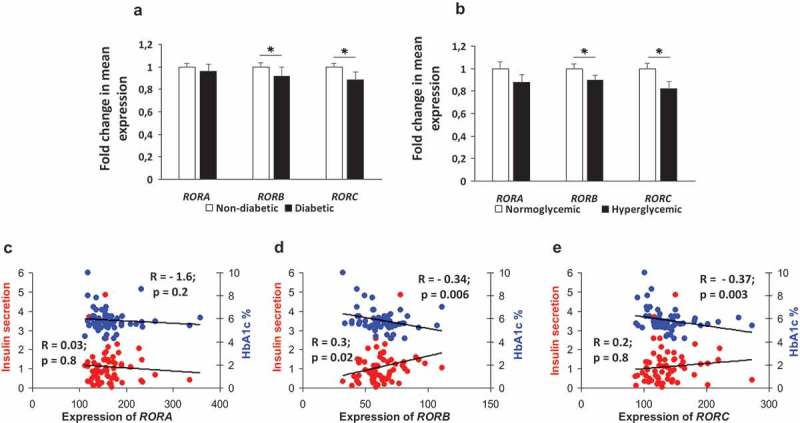
Figure 2.

Expression profile of ROR genes in diabetics versus non-diabetics and hyperglycemics versus normo-glycemics. Fold change in mean expression of ROR genes in diabetic (n = 10) versus nondiabetic (n = 67) donors (a). RORB and RORC showed a significant expression reduction. Fold changes in mean expression genes in 20 donors with hyperglycemia versus 30 donors with normoglycemia (b). RORB and RORC showed a significant expression reduction. Correlation of expression of RORA (c), RORB (d) and RORC (e) with stimulated insulin secretion (ng/islet/hr) measured at 16.7 mM glucose (n= 65) and HbA1c levels (n = 64). Bars represent mean ± SEM, * denotes P<0.05.
