Abstract
In diabetes, there are two major physiological aberrations: (i) Loss of insulin signaling due to absence of insulin (type 1 diabetes) or insulin resistance (type 2 diabetes) and (ii) increased blood glucose levels. The retina has a high proclivity to damage following diabetes, and much of the pathology seen in diabetic retinopathy has been ascribed to hyperglycemia and downstream cascades activated by increased blood glucose. However, less attention has been focused on the direct role of insulin on retinal physiology, likely due to the fact that uptake of glucose in retinal cells is not insulin-dependent. The retinal pigment epithelium (RPE) is instrumental in maintaining the structural and functional integrity of the retina. Recent studies have suggested that RPE dysfunction is a precursor of, and contributes to, the development of diabetic retinopathy. To evaluate the role of insulin on RPE cell function directly, we generated a RPE specific insulin receptor (IR) knockout (RPEIRKO) mouse using the Cre-loxP system. Using this mouse, we sought to determine the impact of insulin-mediated signaling in the RPE on retinal function under physiological control conditions as well as in streptozotocin (STZ)induced diabetes. We demonstrate that loss of RPE-specific IR expression resulted in lower a- and bwave electroretinogram amplitudes in diabetic mice as compared to diabetic mice that expressed IR on the RPE. Interestingly, RPEIRKO mice did not exhibit significant differences in the amplitude of the RPEdependent electroretinogram c-wave as compared to diabetic controls. However, loss of IR-mediated signaling in the RPE reduced levels of reactive oxygen species and the expression of pro-inflammatory cytokines in the retina of diabetic mice. These results imply that IR-mediated signaling in the RPE regulates photoreceptor function and may play a role in the generation of oxidative stress and inflammation in the retina in diabetes.
Keywords: diabetic retinopathy, insulin, retinal pigment epithelium, photoreceptor, oxidative stress
1. Introduction:
The physiological effects of insulin are many and varied, as it acts at both transcriptional (Oliver et al., 1991) and post-translational (Haussinger and Lang, 1992; Siegel and Civan, 1976) levels. The insulin receptor (IR) is a receptor tyrosine kinase which activates downstream signaling upon ligand binding to the IRα subunit of the receptor. In response to activation, the receptor undergoes a structural change which leads to autophosphorylation of the tyrosine kinase domain within the IRβ subunits. The IR (both IRα and IRβ subunits) is widely expressed in the human retina, with immunostaining localized to the nerve fiber layer, ganglion cells, Müller glia, outer nuclear layer, inner segments of rods and cones, the outer limiting membrane and the retinal pigment epithelium (Naeser, 1997). The IR is also expressed in the cornea, smooth muscle of the ciliary epithelium and the lens capsule. IR-mediated signaling within the RPE is dependent upon insulin concentration (Rains and Jain, 2011). At low concentrations (e.g. 10nM), the IR undergoes autophosphorylation, which results in the binding and phosphorylation of insulin receptor substrate-1 (IRS-1). The recruitment and binding of additional scaffolding proteins leads to downstream signaling. However, the ensuing signal transduction cascade depends on the temporal and spatial activation of IR. Glucose transport through the insulin-stimulated GLUT4 glucose transporter is initiated by the recruitment of the oncogene/signal transduction scaffolding protein, Cbl, to the IR while metabolic and mitogenic actions are mediated by PI3K activation downstream of IR, and cell proliferation and differentiation is mediated by ERK/MAPK activation [reviewed in(Rains and Jain, 2011)], see Figure 11. In comparison, high concentrations of insulin (e.g. ≥10μM) potentiate activation of the epithelial growth factor receptor (EGFR) in fibroblasts (Chong et al., 2004) as well as degradation of IRS-1 via ubiquitination and proteasome degradation of this protein (Lee et al., 2000). Interestingly, at least one report demonstrates reduced IR levels in the rods and cones of the diabetic retina, but the basis for this reduction remains unclear (Naeser, 1997).
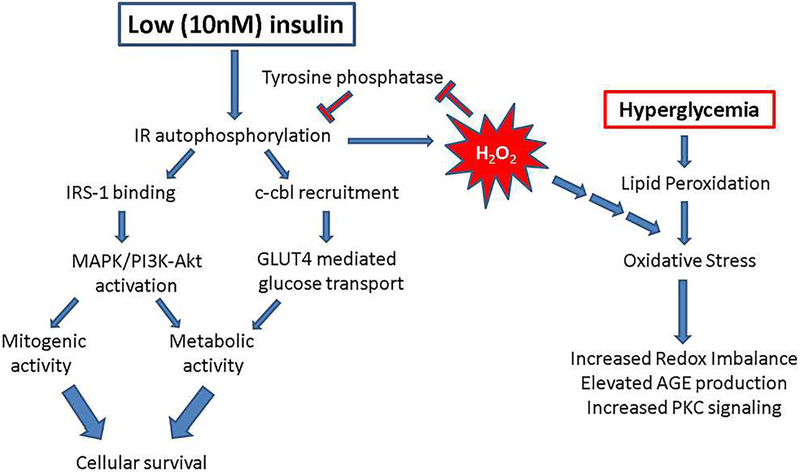
Figure 11. Proposed signal transduction cascades for IR-mediated signaling in RPE cells.
Under physiological (low, 10nM) insulin concentrations, insulin binding to its cognate receptor induces autophosphorylation of the beta subunit of the receptor, binding of scaffolding proteins such as IRS-1 or c-cbl, and downstream mitogenic and metabolic signaling via MAPK, PI3K and Glut4-mediated glucose transport. Simultaneously, low levels of insulin induce an acute spike in hydrogen peroxide which leads to inhibition of tyrosine phosphatase activity and feeds forward to further potentiate cellular survival and proliferation. However, the hydrogen peroxide can also contribute to the exacerbation of already elevated levels of oxidative stress in a hyperglycemic environment. In our RPEIRKO mice, we found that the loss of IR-mediated signaling both leads to reduced photoreceptor function, and a decrease in oxidative stress. We propose that these processes can occur due to the release of tyrosine phosphatase inhibition, causing a reduction in paracrine signaling to photoreceptors that ensures their proper function. Alternately, the reduction in generation of hydrogen peroxide reduces oxidative stress in the hyperglycemic environment.
Herein we sought to determine the role of endogenous insulin action on retinal function and the development of early RPE dysfunction in a mouse model of diabetic retinopathy. To address this question, we generated conditional knockout mice with reduced IR levels in the RPE and assessed electroretinography, retinal and RPE histology, and induction of retinal oxidative stress and inflammation in both control and diabetic animals.
2. Methods:
2.1. Ethical Approval:
This study was carried out in compliance with the ARVO Statement for the Use of Animals in Ophthalmic and Vision Research, , and all animal procedures were approved by the Institutional Animal Care and Use Committees of the Louis Stokes Cleveland VA Medical Center (protocol #10–053-MS-15–010) and the Cleveland Clinic (protocol 2018–1944).
2.2. Mice:
The insulin receptor (IR) was conditionally inactivated in the RPE by breeding mice expressing a floxed IR gene (IRflox/flox, The Jackson Laboratory, B6.129S4(FVB)-Insrtm1Khn/J Stock no. 006955) with the Best1-cre mouse (a kind gift from Joshua Duniaef, University of Pennsylvania). IRflox/flox;Best1-cre (RPEIRKO) mice were crossed with IRflox/flox mice to maintain the conditional knockout line, and the Best1-cre line was maintained by crossing with B6 wildtypes. For each group, both male and female 6–8 week old littermates were randomly assigned to diabetic (STZ) or non-diabetic control (CNTL) groups. Diabetes was induced by three sequential daily intraperitoneal injections of a freshly prepared solution of STZ in 0.1 M citrate buffer (pH 4.4) at 55 mg/kg body weight as previously described (Sugimoto et al., 2013). Diabetic mice were maintained with subcutaneous saline and .01 units insulin (0–0.2 units of neutral protamine Hagedorn (NPH) Humulin N, Eli Lilly and Co., Indianapolis, IN) as needed posthyperglycemia through 4 weeks of diabetes (determined by non-fasting glucose levels >450mg/dl, apparent dehydration, and grooming status) to prevent ketosis without preventing hyperglycemia and glucosuria. CNTL mice received citrate buffer only and did not receive insulin. Using this STZ dosing scheme, 80% of injected mice become diabetic and survive to their determined endpoint.
2.3. Genotyping:
The IRflox and Best1-cre alleles were identified by genotyping with the following primers: B1C: oIMR7338, CTAGGCCACAGAATTGAAAGATCT and oIMR733, GTAGGTGGAAATTCTAGCATCATCC. IR flox: Insr_03, GATGTGCACCCCATGTCTG; Insr_04, TCTATCAACCGTGCCTAGAG and Insr_05 CTGAATAGCTGAGACCACAG.
2.4. Electroretinography:
After dark adaptation overnight, mice were anesthetized with 65mg/kg sodium pentobarbitol. The cornea was anesthetized with 1% proparacaine HCl eye drops and the pupil was dilated with 2.5% phenylephrine HCl, 1% tropicamide, and 1% cyclopentolate HCl. Mice were placed on a water-circulating temperature-regulated heating pad throughout the recording session.
Two stimulation-recording systems and protocols were performed in this study. We first measured the conventional ERG obtained in response to strobe flash stimuli. Following dark adaptation, ERGs were recorded using a stainless-steel electrode in contact with the corneal surface via 1% methylcellulose. Needle electrodes were used for reference (placed in the cheek) and ground (in the tail) leads. Darkadapted responses were presented within an LKC ganzfeld and recorded using flash intensities ranging from −3.6 to 2.1 log cd s/m2. Flash stimuli were presented with increasing intensity and duration of the inter-stimulus-interval (4 s for low-intensity flashes to 90 s for the highest-intensity stimuli) while the number of successive responses averaged together decreased (20 for low-intensity flashes to 2 for the highest intensity stimuli. The ERGs were differentially amplified (0.3–1,500 Hz), averaged, and stored using a UTAS E-3000 signal averaging system (LKC Technologies, Gaithersburg, MD). The amplitude of the a-wave was measured 6.6 ms after flash onset from the pre-stimulus baseline. The amplitude of the b-wave was measured from the maximum response to the value of the a-wave at 6.6ms. Immediately following the dark-adapted ERG session, a steady 20 cd/m2 adapting field was presented in the ganzfeld bowl. After 7 min of light adaptation, cone ERGs were recorded in response to strobe-flash stimuli (−1 to 2 log cd.s/m2) superimposed on the adapting field. The amplitude of the ERG was measured from the pre-stimulus baseline to the positive peak of the waveform.
The leading edge of the a-wave obtained in response to a flash stimulus of 1.4 log cd s/m2 from the scotopic ERG traces was analyzed to examine the activity of rod photoreceptor cells. We utilized a modified form of the Lamb-Pugh model of rod phototransduction, Eq. 1 (Hood and Birch, 1994; Lamb and Pugh, 1992; Pugh and Lamb, 1993):
| (1) |
P3 signifies the massed response of rod photoreceptor cells and corresponds to Granit’s PIII component (Granit, 1933). The amplitude of P3 is expressed as a function of flash energy (i) and time (t) after flash onset. S is a sensitivity parameter and is a measure of phototransduction gain (Hood and Birch, 1994). RmP3 is the maximum a-wave response and td is a brief delay. Fitting of the leading edge of the a-wave to Eq. 1 was performed on KaleidaGraph 4 software (Synergy Software, Reading, PA).
To measure ERG components generated by the RPE, we used a previously established protocol adapted for mouse recording (Wu et al., 2004a) performed on a separate day from strobe flash ERGs. Briefly, responses were obtained from the cornea of the test eye with a Ag/Ag Cl wire electrode covered by an unpulled 1-mm-diameter borosilicate capillary tube with filament (BF100-50-10; Sutter Instrument, Novato, CA). The capillary was filled with Hank’s buffered salt solution (HBSS) to make contact between the electrode and the cornea. A similar electrode was placed in contact with the other eye, which was shielded from light stimulation, and served as a reference lead. Responses were differentially amplified at dc-100 Hz; gain = x1,000 (DP-301, Warner Instruments, Hamden, CT), digitized at 20 Hz, and displayed using LabScribe Data Recording Software (iWorx; Dover, NH). After the initial setup for each mouse was complete, the stability of the recording was verified for several minutes to stimulus presentation. White light stimuli were derived from an optical channel using a Leica microscope illuminator and delivered to the test eye with a 1-cm-diameter fiber-optic bundle. The unmodified stimulus luminance was 4.4 log cd/m2. For the mouse, this luminance corresponds to 6.8 log photoisomerizations per rod/s, based on the assumption that 1 photopic cd/m2 equals 1.4 scotopic cd/m2 for the tungsten halogen light source(Wyszecki and Stiles, 1980) and that 1 scotopic cd/m2 is equivalent to 100 photoisomerizations per rod/s(Hetling and Pepperberg, 1999). A neural density filter (Oriel Instruments, Stratford, CT) was utilized to reduce the stimulus luminance to 2.4 log cd/m2. A Uniblitz shutter system was used to control stimulus duration at 7 min. The amplitude of the c-wave was measured from the prestimulus baseline to the peak of the c-wave. Mice were tested at baseline, 2 and 4 weeks of diabetes.
2.5. Histology and Light Microscopy:
Enucleated eyes were fixed in 0.1 M sodium cacodylate buffer (pH 7.4) containing 2% formaldehyde and 2.5% glutaraldehyde. The tissues were then osmicated, dehydrated though a graded ethanol series, and embedded in epoxy resin (Embed-812/DER73 Epon kit; Electron Microscope Services, Hatfield, PA, USA). Semi-thin sections (0.8 μm) were cut along the horizontal meridian through the optic nerve and stained with 1% toluidine blue O for evaluation. Low magnification photo-micrographs were taken of sections traversing the optic nerve. The distance from the outer limiting membrane (OLM) to the inner limiting membrane (ILM) was measured in three sections per animal and averaged for a minimum of three animals per group using ImageJ software. Higher magnification photo-micrographs were taken 250 μm from the optic nerve, and the length of the outer segment (OS), inner segment (IS), and outer nuclear layer (ONL) was measured in three equidistant areas per section per animal. Thickness of RPE was also measured at 3100x magnifications from three sections of each mouse.
2.6. Flatmounts:
Eyes were enucleated, punctured with a needle and incubated in 4% PFA for 1 hour. Retina and choroid/RPE were dissected and placed in PBS. Each was blocked overnight in 5% normal goat serum +1% bovine serum albumin in 0.5% TritonX-100 in PBS. Primary antibodies were incubated in block without Triton for 1 hour at 37C, wash 3×5min in PBS and secondary antibodies were incubated at 37C for 45min. Tissues were washed 4×5min in PBS followed by counterstaining with DAPI (1:10,000) and flat-mounting on slides. Primary antibodies used were mouse anti-cre (Millipore, 1:500); rabbit antiIRβ (Santa Cruz, 1:100). Rhodamine-conjugated phalloidin was used to label F-actin (Cytoskeleton Inc., 1:200).
2.7. Western blots:
Eyes were enucleated, and retina and RPE/choroid were dissected on ice-cold PBS and immediately flash frozen on dry ice. Retinas were lysed at 4°C for 10 min using TritonX-100 in Lysis Buffer [20 mM Hepes (pH 7.4), 150 mM NaCl, 1.5mM MgCl2, 2mM EGTA (pH 8)] with phosphatase and protease inhibitors. RPE was lysed using the same Lysis buffer for 30 min at 4°C and all tissues were followed by sonication and centrifugation at 14,000 rpm at 4°C for 10 min.
2.8. Oxidative stress:
Reactive oxygen species was measured in cryosections by dihydroethidium (DHE) staining. Eyes were dissected and frozen in OCT embedding buffer within 15 minutes of enucleation. Fresh frozen retinal cryosections spanning the optic nerve were incubated with DHE (ThermoFisher, 1:5000) for 20 minutes followed by counterstaining with DAPI (1:10,000).
2.9. qPCR:
Gene expression of inflammatory and oxidative stress markers was measured by quantitative PCR on dissected retinal tissue. Markers included ICAM-1 (Intercellular Adhesion Molecule 1), Nos2(Nitric oxide synthase 2), Cox2 (Cyclooxygenase-2), TNFα (Tumor Necrosis Factor alpha), IL-1β (Interleukin −1 beta) (see supplemental Table 1 for primer sequences), HIF1α (Hypoxia Inducible Factor-1 alpha) (QT01039542, Qiagen) and VEGF (Vascular Endothelial Growth Factor) (QT00160769, Qiagen). Actin or 18S was used as a control (see supplemental Table 1).
2.10. Statistical Analysis:
For all analyses (except relative amplitude comparisons), data were compiled as average ±SEM or SD as indicated, and statistics were performed using non-repeated measures, one way or two-way ANOVA (analysis of variance) with Tukey post-hoc analysis on graphing software (GraphPad Prism 6; GraphPad, Inc., La Jolla, CA, USA). Using this test, we measured differences in the mean between each group for one-way ANOVA and also between the means for each group at each time point for the two-way ANOVA. Statistical significance was determined by achieving a p value for both the ANOVA and multiple comparisons test below 0.05. To normalize the amplitude of the b-wave and c-wave to that of the mean control response, the amplitude of each individual animal was compared to the average a-wave response and calculated as the relative amplitude. Relative amplitudes were then averaged and compared to the control average. Statistical significance for the relative amplitude was measured by unpaired Student’s t-test and values of P ≤ 0.05 were considered significant. At least three animals per condition (CNTL and STZ) per time point were used for all experiments.
3. Results:
3.1. Insulin receptor levels are reduced in the RPE of RPEIRKO (IRflox/flox;Best1-cre) mice.
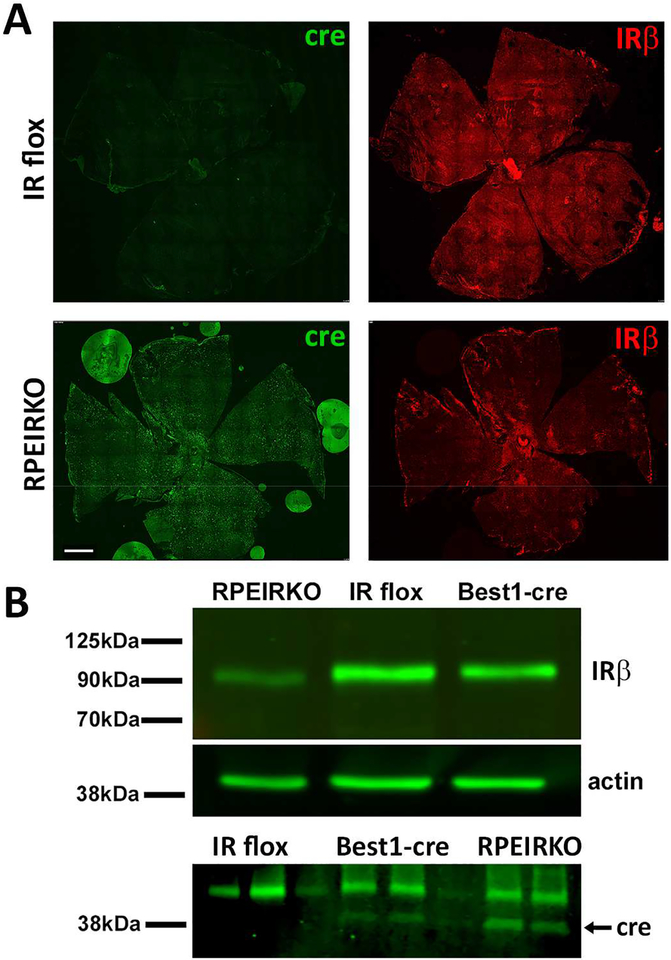
RPEIRKO mice were generated by breeding IRflox/flox mice with Best1-cre mice that exhibit mosaic expression of cre recombinase in RPE cells (Iacovelli et al., 2011). Figure 1A compares the expression of cre recombinase and IRβ in RPE/choriod flatmounts from adult IR flox and RPEIKRO mice. In the IRflox/flox Cre-negative (IR flox) mouse, IRβ expression is found throughout the RPE. In comparison, IRβ is reduced throughout the RPE of RPEIRKO mice. Figure 1B (top) further demonstrates the substantial, but incomplete, loss of IRβ levels in RPE lysates from RPEIRKO mice, but not Best1-cre or IR flox mice. Figure 1B (bottom) illustrates the expression of cre recombinase in RPE lysates from Best1-cre and RPEIRKO mice, but not IR flox mice.
Figure 1. Loss of IR expression in the RPE of RPEIRKO mice.
(A) RPE/choroid flatmounts were prepared from non-diabetic IR flox and RPEIRKO mice at 6 weeks of age. Tissue was stained with mouse anti-Cre antibody (green), rabbit anti-IRβ antibody (red) and counterstained with DAPI. Scale bar = 500μm. (B) RPE lysates were prepared from IR flox, Best1-Cre and RPEIRKO mice. Western blotting was performed using anti-IRβ, anti-actin (top) and anti-cre recombinase (bottom) antibodies.
3.2. Diabetic RPEIRKO mice display hyperglycemia, increased retinal glucose content and reduced serum insulin levels but normal retinal insulin concentration.
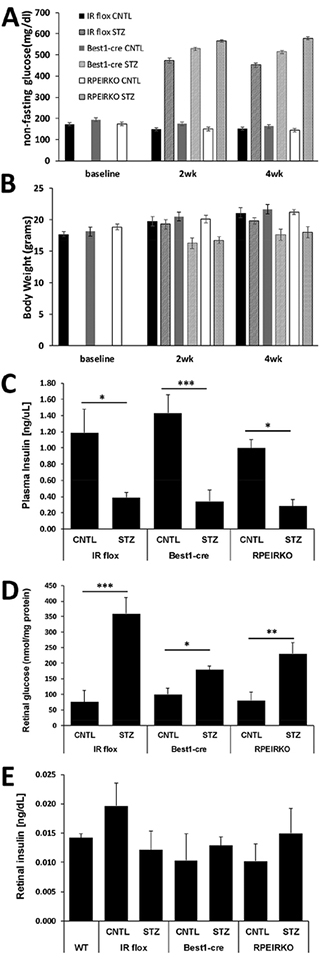
Diabetes was induced in control and RPEIRKO mice at 6–8 weeks of age by three daily injections with 20mg/kg STZ. Blood glucose was measured 2 days following the last injection, and mice with blood glucose concentration ≥250mg/dl were considered diabetic. Mice that received STZ injections but did not exhibit elevated blood glucose concentrations were excluded from the study. Figure 2A demonstrates the non-fasting blood glucose measurements at baseline, 2 and 4 weeks following STZ injections. Blood glucose levels were significantly increased in IR flox, Best1-Cre and RPEIRKO mice treated with STZ at both 2 weeks and 4 weeks. Body weights of mice were measured at baseline and 2 weeks and 4 weeks post STZ injections. Diabetic mice were slightly underweight compared to non-diabetic littermates (Figure 2B). Plasma insulin levels were decreased in all STZ-injected mice compared to their respective control group (2wks, Figure 2C). Retinal glucose levels were significantly increased in all STZ-injected groups compared to their control counterparts (4wks, Figure 2D). However, retinal insulin levels were unchanged (Figure 2E, 2wks).
Figure 2. Diabetic RPEIRKO mice exhibit reduced plasma insulin and elevated blood and retinal glucose concentrations.
(A) Systemic non-fasting blood glucose concentration. (B) Body weight of each cohort of mice measured at the time of each electroretinogram session (2 weeks and 4 weeks). (C) Plasma insulin levels measured by ELISA after 4 weeks of diabetes. (D) Retinal glucose levels measured by hexokinase assay at 4 weeks of diabetes. (E) Retinal insulin levels relative to protein concentration at 2 weeks of diabetes. Data points indicate the mean ± SEM. At each time point, n≥3 for each group. *p≤0.05, **p≤0.001, ***p≤0.0001 by one-way ANOVA with Tukey’s post hoc analysis.
3.3. All genotypes/treatment of mice display normal retinal histology.
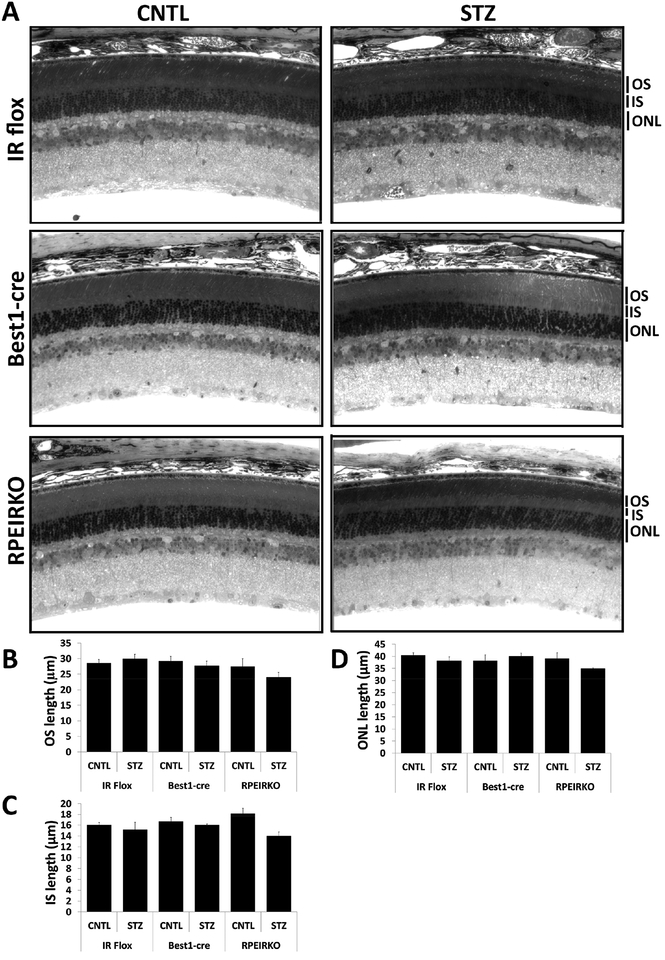
Despite previous reports that Best1-cre mice begin to exhibit abnormalities in RPE cells that continuously express cre recombinase between 1 and 4 months of age (He et al., 2014), we found no structural changes between the Best1-cre mice and either the IR flox or RPEIRKO groups at baseline (8 weeks of age). Representative images of control mice are displayed in the left column of Figure 3A. The right column of figure 3A depicts representative sections from IR flox, Best1-cre and RPEIRKO mice following 4 weeks of diabetes. Analysis of outer segment (OS) length, inner segment (IS) length and outer nuclear layer (ONL) thickness revealed no significant differences between diabetic and non-diabetic mice (of any genotype). Lack of insulin signaling in the RPE does not appear to have an obvious deleterious effect on retinal histology under physiological or diabetic conditions.
Figure 3. IR flox, Best1-cre and RPEIRKO mice display normal retinal histology under normal physiological conditions and following 4 weeks of diabetes.
(A) Representative light micrographs from semi-thin sections through the optic nerve of control and diabetic IR flox, Best1-cre and RPEIRKO mice 4 weeks following onset of diabetes, stained with toluidine blue O. OS, outer segment layer; IS, inner segment layer; ONL, outer nuclear layer. All images were taken at 40x magnification. Scale bar=20 μm. Thickness of the OS (B), IS (C) and ONL (D) was measured from three locations in each image and at least three images per mouse (n≥3 for each group). Data was compiled and analyzed by one-way ANOVA with Tukey post-hoc test.
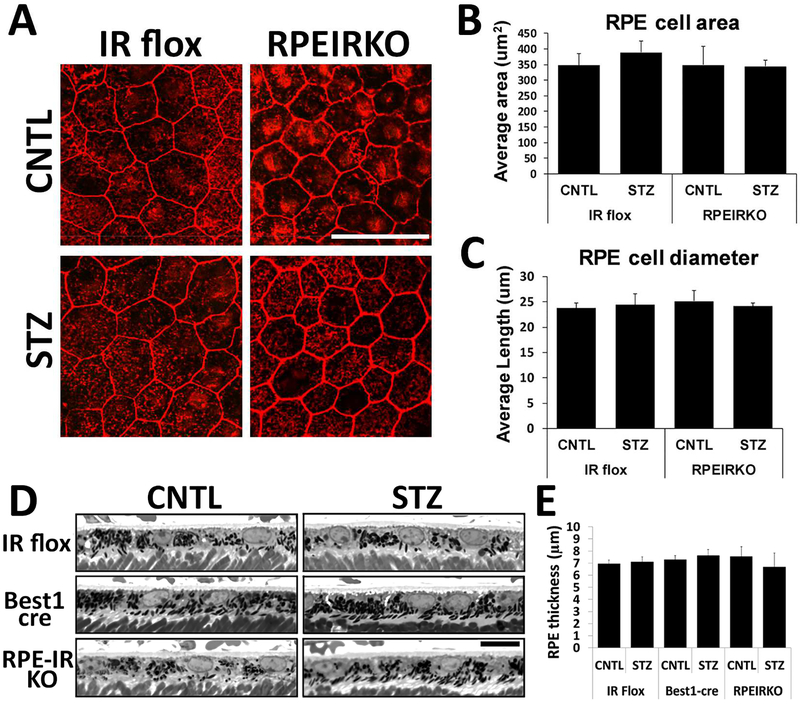
We further assessed RPE morphology by analyzing these cells in semi-thin sections and RPE flatmounts. Figure 4A shows representative images from IR flox and RPEIRKO RPE flatmounts stained with phalloidin (Scale bar=50μm). Using these images, we measured area and diameter of 20 cells from randomly selected areas of each flatmount. The RPE area and diameter was similar in control IR flox and RPEIRKO mice and no significant changes were observed in diabetic IR flox or RPEIRKO animals (Figure 4B–C). We further assessed RPE thickness in semi-thin sections of mice from each treatment/genotype at 4 weeks of diabetes (Figure 4D, scale bar = 10μm). No significant differences were identified between thickness of each genotype or treatment. These data demonstrate that RPE morphology is not significantly altered through 4 weeks of diabetes.
Figure 4. Diabetes does not affect diameter or area of RPE cells in IR flox and RPEIRKO mice.
(A) Representative flat mount images from IR flox and RPEIRKO mice at 2 weeks of diabetes stained with phalloidin. At least 20 cells per flatmount were analyzed by Image J software for RPE cell area (B) and diameter (C). (D) High magnification images from semi-thin sections of each mouse genotype/treatment at 4weeks following onset of diabetes. Scale bar = 10μm. Images were analyzed for RPE thickness with Image J software (E). Statistical significance was determined by one-way ANOVA with Tukey post hoc test. n≥3 for each group.
3.4. Diabetic RPEIKRO mice display reduced a- and b- wave amplitudes compared to diabetic controls.
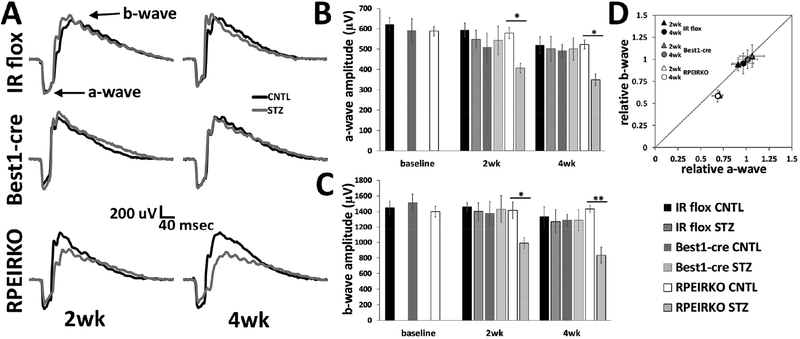
To determine if a reduction of IR in the RPE affected the light-evoked responses of the retina, or the RPE itself, we performed strobe flash and direct current coupled electroretinography (dc-ERG) at 8 weeks of age (baseline) and at 2 and 4 weeks following the onset of diabetes. Figure 5 depicts our findings from strobe flash ERGs. Fig. 5A shows representative traces in response to a 1.4 log cd.s/m2 flash at both 2 and 4 weeks following onset of diabetes in each group and genotype. No differences were found in awave or b-wave amplitudes between genotypes (IR flox, Best1-cre and RPEIRKO) in control non-diabetic mice. Diabetic IR flox mice and Best1-cre mice exhibited minimal reduction in a- and b-wave amplitudes as compared to controls (Figure 5B and C respectively) at these time points. While diabetes-induced reductions in a- and b-wave amplitudes varied by strain, these data match findings from wildtype mice at 8 weeks of diabetes, demonstrating only small reductions to the a- and b-wave (Samuels et al., 2017). Despite the minimal reduction observed in the diabetic IR flox and Best1-cre mice, diabetic RPEIRKO mice exhibit significantly lower a- and b-wave amplitudes (Figure 5B and C, respectively) compared to RPEIRKO controls at 2 and 4 weeks of diabetes. A two-way ANOVA comparing the a-wave amplitudes revealed a significant reduction in the a-wave [F (5, 104), =3.979, DF =5, p =0.0024] and the b-wave [F (5, 104), =4.511, DF =5, p =0.0009] between RPEIRKO CNTL and RPEIRKO STZ groups. No significant difference was found between the 2 and 4 week time points or between means for the IR Flox or Best1cre groups.
Figure 5. Diabetes induces reductions in the a- and b-wave of RPEIRKO but not IR flox or Best1-cre mice.
(A) Representative strobe flash ERG responses recorded in response to a 1.4 log cd.s/m2 white flash stimulus at 2 and 4 weeks of diabetes for each group. (B) Amplitude of the a-wave in response to the 1.4 log cd.s/m2 stimulus. (C) Amplitude of the b-wave in response to the 1.4 cd.s/m2 stimulus. (D) Relative changes of the b-wave plotted as a function of the relative normalized amplitude of the a-wave. The diagonal line indicates an equivalent reduction in the a- and b-wave. n≥6 mice per group. Data represent mean ± SEM. Statistical analysis was performed using a one-way ANOVA for each time point followed by post hoc Tukey’s test. * p≤ 0.05, ** p≤ 0.001.
When b-wave amplitudes are normalized to the a-wave, it is apparent that the reduction to each component is equivalent, as the relative a-wave and b-wave values plotted against one another fall along a diagonal line (Figure 5D). Therefore, the reduction in the a-wave amplitude accounts for the reduction observed in the b-wave. This a-wave reduction demonstrates a functional change in the photoreceptor response. When modeled with a modified Lamb-Pugh equation, the sensitivity of phototransduction and timing of the response was not different between genotypes or treatments (Table 1 and 2, S and td, respectively). However, in the RPEIRKO mice, at both 2 and 4 weeks of diabetes (Table 1 and 2), the massed response of the rod photoreceptors, RmP3, was significantly lower in the RPEIRKO STZ mice compared to RPEIRKO CNTL (*p=0.0174 at 2wks, *p=0.046 at 4wks). Moreover, at 2wks, RmP3 was also significantly lower in the RPEIRKO STZ mice compared to IR flox STZ (**p=0.0015) and Best1-cre STZ (*p=0.0128) mice.
Table 1:
Lamb Pugh parameters of the a-wave in response to a 1.4 log cd.s/m2 flash stimulus at 2 weeks of diabetes.
| RmP3 (uV) | S (msec−2(cd.s/m2)−1) | td (msec) | ||
|---|---|---|---|---|
| IR flox | CNTL | −580.02 ± 113.22 | 0.030 ± 0.007 | 2.53 ± 0.17 |
| STZ | −714.76 ± 167.76 | 0.023 ± 0.003 | 2.66 ± 0.25 | |
| Best1-cre | CNTL | −579.57 ± 223.07 | 0.026 ± 0.013 | 2.53 ± 0.20 |
| STZ | −644.60 ± 167.94 | 0.023 ± 0.009 | 2.62 ± 0.25 | |
| RPEIRKO | CNTL | −611.36± 125.38 | 0.029 ± 0.008 | 2.44 ± 0.17 |
| STZ | −444.77 ± 93.08*,#,† | 0.026 ± 0.008 | 2.63 ± 0.20 | |
p<0.05, RPEIRKO STZ vs RPEIRKO CNTL;
p<0.05 RPEIRKO STZ vs BEST1-cre STZ;
p<0.001 RPEIRKO STZ vs IR flox STZ.
Table 2:
Lamb Pugh parameters of the a-wave in response to a 1.4 log cd.s/m2 flash stimulus at 4 weeks of diabetes.
| RmP3 (uV) | S (msec−2(cd.s/m2)−1) | td (msec) | ||
|---|---|---|---|---|
| IR flox | CNTL | −547.74 ± 183.82 | 0.032 ± 0.010 | 2.48 ± 0.16 |
| STZ | −537.67 ± 251.41 | 0.030 ± 0.010 | 2.50 ± 0.16 | |
| Best1-cre | CNTL | −539.26 ± 79.71 | 0.028 ± 0.007 | 2.53 ± 0.16 |
| STZ | −545.38 ± 157.52 | 0.028 ± 0.017 | 2.42 ± 0.55 | |
| RPEIRKO | CNTL | −573.91 ± 57.50 | 0.024 ± 0.007 | 2.50 ± 0.13 |
| STZ | −355.67 ± 24.10* | 0.034 ± 0.016 | 2.50 ± 0.25 | |
p<0.05 RPEIRKO STZ vs RPEIRKO CNTL.
While analyzing the strobe flash ERG tracings, we noticed that the b-wave appeared to be noticeably slower in the diabetic RPEIRKO mice. We measured the peak latency of the b-wave in response to the 1.4 log cd.s/m2 stimulus in each strain, at both time points, and found that the b-wave peak latency was significantly increased in the diabetic Best1-cre (46.26±2.29msec CNTL; 55.14 ±3.13msec STZ, *p=0.037) and RPEIRKO mice (46.84±1.11msec CNTL; 53.87±1.85msec STZ, *p=0.045) at 2 weeks of diabetes, and in the RPEIRKO mice (45.22±1.35msec CNTL; 57.21±3.84msec STZ, *p=0.053) at 4 weeks of diabetes. For each group, n≥6 mice. Statistical analysis was performed for each time point by one-way ANOVA followed by post hoc Tukey’s test.
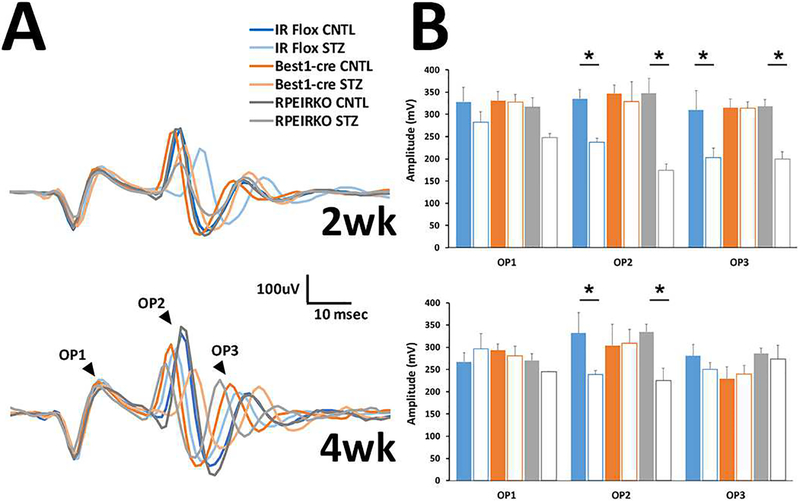
We next evaluated the oscillatory potentials from each genotype/group to determine if these wavelets were affected by diabetes and/or the loss of IR-mediated signaling from the RPE. Figure 6A illustrates representative OPs filtered from the strobe-flash responses to the 1.4 log cd.s/m2 stimulus a 2 weeks (top) and 4 weeks (bottom). Amplitude of the waveforms was measured from the trough preceding the labeled peaks to the maximum peak of each OP (Figure 6B). As is commonly found in diabetes, a significant reduction in OP amplitude was found by Two-way ANOVA. For OP2 [F (5, 61), =5.186, DF =5, p =0.0005], and for OP3 [F (5, 61), =3.604, DF =5, p =0.0064]. Similarly, a significant difference was found in implicit time of the OPs by two-way ANOVA. Table 3 provides the implicit time for the trough and peak of each OP for each genotype/treatment at 2 weeks, and Table 4 provides average times for the 4 week time point. For the timing of the troughs, OP1 [F (5, 61), =3.242 DF =5, p =0.0116]; OP2 [F (5, 61), =11.27, DF =5, p <0.0001]; OP3 [F (5, 61), =7.757, DF =5, p <0.0001]. And for the timing of the peaks OP1 (not significant); OP2 [F (5, 61), =11.10, DF =5, p <0.0001]; OP3 [F (5, 61), =6.003, DF =5, p <0.0001].
Figure 6. Diabetes elicits changes to the oscillatory potentials of diabetic mice.
(A) Representative filtered OPs from ERG waveforms recorded in response to a 1.4 log cd.s/m2 stimulus at 2 (top) and 4 (bottom) weeks of diabetes. (B) Average amplitude for OP1–3 at each time point. n≥3 for each group. Data represent mean ± SEM. *p<0.05.
Table 3:
Analysis of OP1–3 implicit times in response to a 1.4 log cd.s/m2 flash stimulus at 2 weeks of diabetes.
| 2wk OPs | Trough Td (msec) | Peak Td (msec) | |
|---|---|---|---|
| OP1 | |||
| IR flox | CNTL | 5.824 ± 0.000 | 10.192 ± 0.208 |
| STZ | 6.656 ± 0.000 | 10.816 ± 0.000 | |
| Best1-cre | CNTL | 6.101 ± 0.175 | 10.677 ± 0.139 |
| STZ | 6.101 ± 0.175 | 10.539 ± 0.277 | |
| RPEIRKO | CNTL | 5.943 ± 0.081 | 10.341 ± 0.114 |
| STZ | 6.286 ± 0.146 | 10.724 ± 0.167 | |
| OP2 | |||
| IR flox | CNTL | 19.136 ± 0.760 | 23.088 ± 0.624 |
| STZ | 24.683 ± 0.555* | 28.565 ± 0.734* | |
| Best1-cre | CNTL | 19.829 ± 0.334 | 23.851 ± 0.278 |
| STZ | 19.829 ± 0.668 | 23.851 ± 0.515 | |
| RPEIRKO | CNTL | 19.909 ± 0.254 | 23.474 ± 0.278 |
| STZ | 21.262 ± 0.574*,#,† | 25.237 ± 0.519*,#,† | |
| OP3 | |||
| IR flox | CNTL | 28.080 ± 0.398 | 33.696 ± 0.990 |
| STZ | 33.280 ± 0.832* | 39.381 ± 0.734* | |
| Best1-cre | CNTL | 29.536 ± 0.411 | 34.112 ± 0.526 |
| STZ | 29.536 ± 0.515 | 35.221 ± 0.511 | |
| RPEIRKO | CNTL | 28.288 ± 0.289 | 34.350 ± 0.307 |
| STZ | 30.507 ± 0.500*,† | 36.700 ± 0.713*,† | |
p<0.05 STZ vs CNTL for respective gentoypes.;
p<0.05 RPEIRKO STZ vs BEST1-cre STZ;
p<0.001 RPEIRKO STZ vs IR flox STZ.
Table 4:
Analysis of OP1–3 implicit times in response to a 1.4 log cd.s/m2 flash stimulus at 4 weeks of diabetes.
| 4wk OPs | Trough Td (msec) | Peak Td (msec) | |
|---|---|---|---|
| OP1 | |||
| IR flox | CNTL | 5.962 ± 0.139 | 10.539 ± 0.175 |
| STZ | 6.323 ± 0.204 | 10.650 ± 0.408 | |
| Best1-cre | CNTL | 6.032 ± 0.208 | 10.192 ± 0.208 |
| STZ | 6.490 ± 0.167 | 10.816 ± 0.000 | |
| RPEIRKO | CNTL | 6.240 ± 0.157 | 10.712 ± 0.245 |
| STZ | 5.824 ± 0.000 | 9.707 ± 0.277 | |
| OP2 | |||
| IR flox | CNTL | 20.245 ± 0.277 | 23.851 ± 0.351 |
| STZ | 21.133 ± 1.135 | 25.126 ± 1.245 | |
| Best1-cre | CNTL | 18.720 ± 0.537 | 22.464 ± 0.588 |
| STZ | 18.720 ± 0.408 | 22.464 ± 0.424 | |
| RPEIRKO | CNTL | 21.632 ± 0.416 | 24.960 ± 0.497 |
| STZ | 18.304 ± 0.480*,† | 22.187 ± 0.555*,† | |
| OP3 | |||
| IR flox | CNTL | 28.843 ± 0.351 | 34.667 ± 0.464 |
| STZ | 29.952 ± 1.488 | 35.942 ± 1.245 | |
| Best1-cre | CNTL | 31.117 ± 0.523 | 37.107 ± 0.787 |
| STZ | 31.117 ± 0.424 | 37.107 ± 0.546 | |
| RPEIRKO | CNTL | 29.952 ± 0.445 | 36.088 ± 0.647 |
| STZ | 26.900 ± 0.277*,#,† | 32.171 ± 0.100*,#,† | |
For each OP, p<0.05, RPEIRKO STZ vs RPEIRKO CNTL;
p<0.05 RPEIRKO STZ vs BEST1-cre STZ;
p<0.001 RPEIRKO STZ vs IR flox STZ.
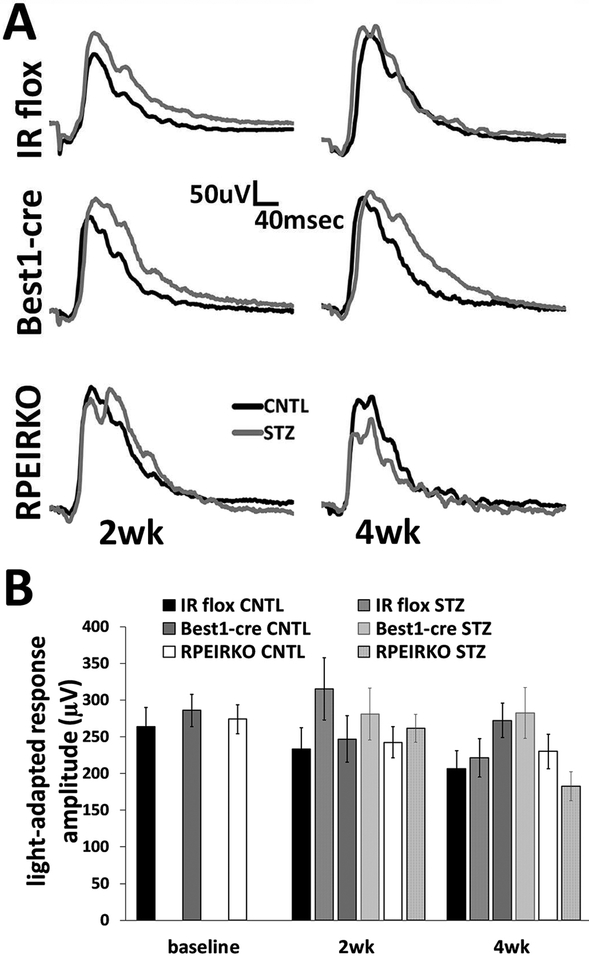
Last, we evaluated the light-adapted responses of each genotype/group to identify potential functional defect in the cone photoreceptors. Figure 7 depicts representative traces in response to a 1.4 log cd.s/m2 stimulus at both 2 and 4 weeks following onset of diabetes. No significant differences were identified in the maximal light-adapted response between any of the groups (Figure 7B).
Figure 7. Diabetes does not affect the light adapted responses of control or RPEIRKO mice.
(A) Representative ERG waveforms recorded in response to a 1.4 log cd.s/m2 stimulus superimposed on a steady light adapting field after 2 and 4 weeks of diabetes. (B) Average amplitude of the light adapted response for each group. n≥6 for each group. Data represent mean ± SEM.
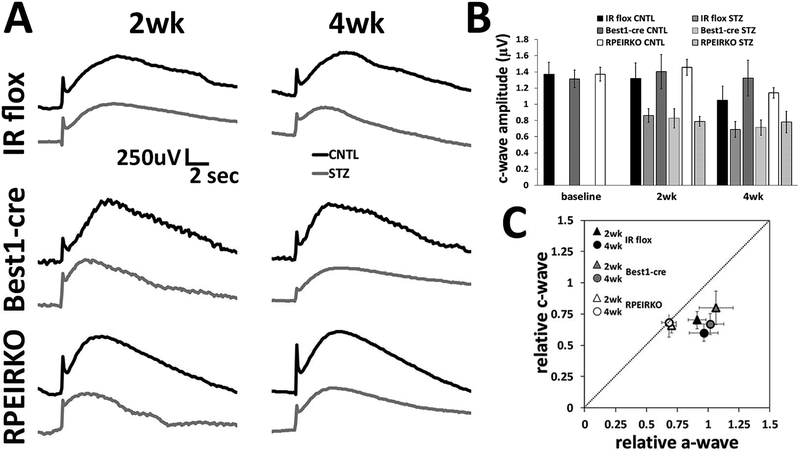
The light-evoked responses of the RPE can be captured by use of the dc-ERG. We measured the amplitude of the c-wave component of the dc-ERG in response to a 2.4 log cd/m2 light stimulus. We previously reported that reductions in the dc-ERG components are observed prior to reductions to the strobe flash ERG in mouse models of type 1 or type 2 diabetes (Samuels et al., 2015). Interestingly, diabetic RPEIRKO mice exhibited similar levels of RPE dysfunction as mice with normal IR expression. Both control strains of mice, IR flox and Best1-cre, as well as the conditional knockout mice displayed similar reductions to the c-wave component of the dc-ERG as a result of diabetes (Figure 8A–B). When the reductions in the a-wave and c-wave for the diabetic mice of each cohort were normalized to the control groups and then plotted against each other, the data points for the IR flox and Best1-cre mice fell below the diagonal line which denotes an equivalent change (Figure 8C). This indicates that the cwave was reduced while a-waves remained unchanged, indicating that the c-wave reduction is not secondary to a loss of photoreceptor function (Samuels et al., 2010). In comparison, the data points for the diabetic RPEIRKO mice fall along the diagonal line, indicating an equivalent reduction in photoreceptor and RPE function. (Figure 8C). These data demonstrate that the changes in RPE and photoreceptor-dependent ERG are not equivalently affected by loss of insulin-mediated signaling. Without IR-mediated signaling from the RPE, the photoreceptors are more severely affected by diabetes. Therefore, these data suggest that IR-mediated signaling may protect the photoreceptors from diabetes-induced pathology; however, RPE cells are susceptible to diabetes-induced dysfunction regardless of the presence of IR-mediated signaling.
Figure 8. Diabetes induces reductions in the RPE-dependent c-wave regardless of IR-mediated signaling in the RPE.
(A) Representative c-wave recordings at 2 and 4 weeks of diabetes for each group. Control (CNTL) mice are represented by black traces and STZ-injected diabetic mice by gray traces. (B) Amplitude of the c-wave at each time point. (C) The relative amplitude of the c-wave plotted as a function of the relative a-wave amplitude. n≥5 for each group at each time point.
3.5. Diabetic RPEIRKO mice display reduced levels of oxidative stress and markers of inflammation compared to diabetic controls.
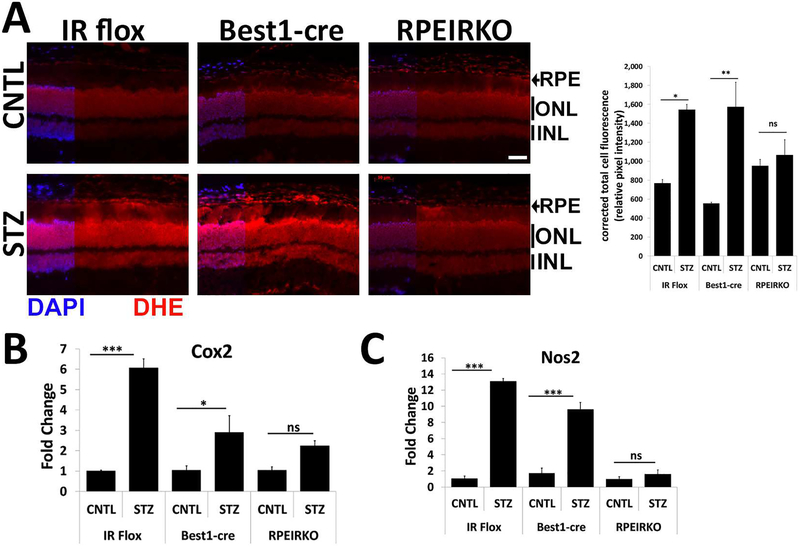
In addition to changes in ERG timing and amplitudes, the earliest indicators of pathology in the retina associated with diabetes include the presence of oxidative stress and inflammation. Moreover, the presence of these pathological markers is associated with increased risk of diabetic retinopathy and diabetic macular edema (Kowluru and Chan, 2007). Therefore, we investigated whether reduction of IR-mediated signaling in the RPE altered levels of oxidative stress in the retina by measuring changes in dihydroethidium (DHE) staining in fresh frozen sections (Chan et al., 2013), and levels of Cox2 and Nos2 by qPCR of dissected retinal tissues (Samuels et al., 2017). Figure 9A depicts representative images of retinal sections from CNTL and STZ mice of each genotype following 4 weeks of diabetes stained with DHE. Upon interaction with superoxides, DHE produces a red fluorescence. In IR flox and Best1-cre mice, STZ induced a significant increase in DHE levels measured by quantifying corrected total cell fluorescence with Image J software. However, diabetic RPEIRKO mice did not exhibit an increase in DHE, indicating that there was not an increase in superoxide production. Similarly, retinal levels of enzymes responsible for generation of inflammation and reactive oxygen species, Cox2 and Nos2, were significantly increased in diabetic IR flox and Best1-cre mice at 4 weeks of diabetes, but were not elevated in diabetic RPEIRKO mice (Fig. 9B and C, respectively).
Figure 9. RPEIRKO mice do not exhibit diabetes-induced increases in oxidative stress.
(A) Freshly dissected eye cups from CNTL and STZ IR Flox, Best1-Cre, and RPEIRKO mice after 4 weeks of diabetes were frozen and mounted in OCT medium prior to cryosectioning. Cryosections were stained with Dihydroethidium-594 and counterstained with DAPI. Scale bar = 50μm. Relative Fluorescence was calculated by corrected total cell fluorescence using Image J software. At 4 weeks of diabetes, retinas from CNTL and STZ IR flox, Best1-cre and RPEIRKO mice were collected and used for mRNA extraction. mRNA levels Cox2 (B) and Nos2 (C) were assessed by real time quantitative PCR using actin or 18S rRNA as the internal control. n≥3 for each group. Data represent mean ± SEM. *p≤0.05, **p≤0.001, ***p≤0.0001 by one-way ANOVA followed by post hoc Tukey’s test.
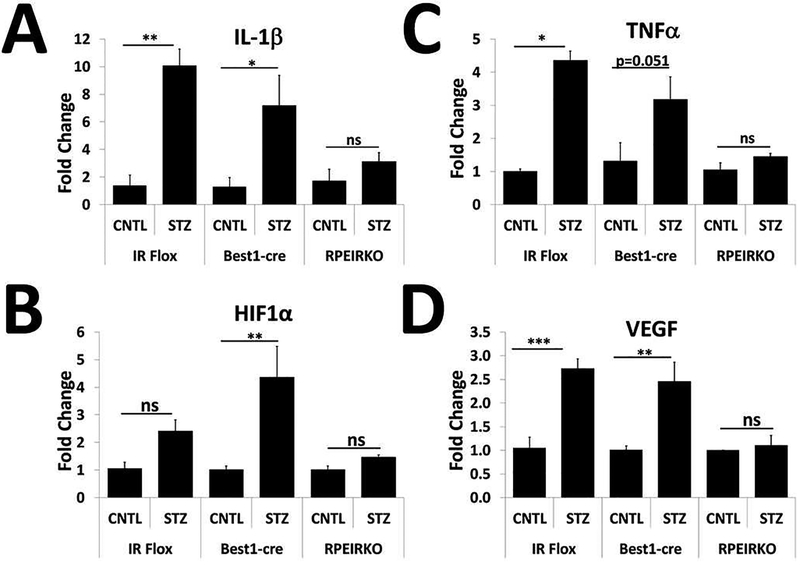
We similarly assessed levels of the pro-inflammatory cytokines IL-1β and TNFα from CNTL and STZ retinas of each group of mice after 4 weeks of diabetes (Figure 10 A–B). We found that diabetic IR flox and Best1-cre, but not RPEIRKO mice exhibited significant increases in these genes. We also measured levels of HIF-1α and VEGF in CNTL and STZ retinas to determine if IR-mediated signaling in the RPE contributed to the development of pro-angiogenic factors (Figure 10 C–D). As with the pro-inflammatory molecules, we found that HIF1α was significantly increased in the diabetic Best1-cre mice (with a trend for increase in diabetic IR flox mice) but not RPEIRKO mice. VEGF was also significantly increased in both diabetic IR flox and Best1-cre mice, but not in diabetic RPEIRKO mice.
Figure 10. RPEIRKO mice do not exhibit diabetes-induced increases in pro-inflammatory and proangiogenic molecules.
At 4 weeks of diabetes, retinas from diabetic (STZ) IR flox, Best1-cre and RPEIRKO mice, as well as from non-diabetic control (CNTL) animals of each cohort were collected and used for mRNA extraction. mRNA levels of IL-1β (A), TNFα (B), HIF1α (C), and VEGF (D) were assessed by real time quantitative PCR using actin or 18S rRNA as the internal control. n≥3 mice per group. Data represent mean ± SEM. *p≤0.05, **p≤0.001, ***p≤0.0001 by one-way ANOVA followed by post hoc Tukey’s test.
4. Discussion:
Insulin is a known pro-survival factor, acting through PI3K, Akt and the 70 kDa ribosomal protein S6 kinase, p70S6K, to protect and/or rescue the retina from apoptosis or stress such as light damage (Barber et al., 2001; Meyer-Franke et al., 1995; Wu et al., 2004b). Loss of the IR in rod photoreceptors leads to reduced phosphoinsoitide-3-kinase (PI3K) and Akt signaling and an increased sensitivity to light induced photoreceptor degeneration (Rajala et al., 2008).
In this study, we provide evidence that loss of IR-mediated signaling specifically in the RPE worsened rod photoreceptor abnormalities in diabetic mice (a-wave amplitudes, Fig 5) without affecting baseline photoreceptor function. While the reduction of IR signaling in the RPE did not have an effect on the light-evoked responses of the RPE under control or diabetic conditions (c-wave amplitude, Fig. 8), it did reduce the extent of retinal oxidative stress and expression of pro-inflammatory and pro-angiogenic molecules in the diabetic retina (Fig 9, 10).
We and others have shown that the development of retinal oxidative stress and inflammation due to diabetes is often uncoupled from functional ERG defects in mouse models of diabetes (Lee et al., 2014; Samuels et al., 2012; Samuels et al., 2017; Zheng et al., 2007). Therefore, it is reasonable that diabetic RPEIRKO mice exhibited reduced levels of oxidative stress and pro-inflammatory cytokine expression while still exhibiting similar RPE dysfunction (c-wave reductions, Fig. 8) and worse photoreceptor function (a- and b- wave amplitudes, Fig. 5) compared to control diabetics. Together, these data combined with our findings in the RPEIRKO mouse suggest that insulin signaling in the RPE may provide a paracrine signal to the retina for maintenance of photoreceptor function and survival, but is also at least in part responsible for the generation of oxidative stress.
Diabetic patients and animal models of diabetes display higher levels of oxidative stress than normal patients or animal models (Jain, 1989; Jain et al., 1990; Rains and Jain, 2011). Hyperglycemia itself has been shown to contribute to oxidative stress by lipid peroxidation (Jain et al., 1990). However, the amount of oxidative stress in an environment can be controlled by the presence and amount of insulin. At low, physiological levels (10nM) insulin stimulation generally induces an acute increase in hydrogen peroxide production (see Figure 11). This increase in hydrogen peroxide creates a positive feedback loop within the insulin signaling cascade by inhibition of tyrosine phosphatase activity, leading to increased tyrosine phosphorylation of the IR and its substrates (Mahadev et al., 2004). This signaling cascade can further induce oxidative stress by further exacerbating the redox imbalance and leading to increased production of advanced glycation end products, activation of the mitochondrial electron transport chain and Protein kinase C-mediated signaling (Rains and Jain, 2011).
In our model, as IR-mediated signaling in the RPE has been reduced, the feedback loop to generate additional reactive oxygen species should be suppressed. Because IGF also acts through IR, loss of IGF-mediated signaling may also contribute to the reduction in photoreceptor function in RPEIRKO mice. It has been shown that conditional inactivation of the IR in rod photoreceptors leads to an accelerated decay of the light-evoked response to flash stimuli, and decreased flash sensitivity in a normal environment (Woodruff et al., 2015). Therefore, despite the reduction in oxidative stress in the RPEIRKO mouse, the loss of a paracrine insulin-mediated signal from the RPE could result in reduced photoreceptor function. Alternatively, prior to the induction of chronic inflammation, the acute presence of pro-inflammatory cytokines such as IL-1β and TNFα could serve as an important signal in the retina to induce a protective response for the photoreceptors. When it is lost due to IR deletion, this signal and its downstream benefits may also be lost.
Our studies demonstrate that targeting insulin-mediated signaling in the RPE is an important step in reducing the oxidative environment in the STZ mouse model of diabetes. These data support the hypothesis that IR-mediated signaling in the RPE contributes to diabetic retinopathy and diabetic macular edema (Sugimoto et al., 2013). Transient worsening may occur due to deleterious insulinmediated signal transduction which initiates additional oxidative stress and inflammation. However, insulin has also been shown to be necessary for photoreceptor survival and activity (Ivanovic et al., 2011; Punzo et al., 2009; Rajala et al., 2008; Rajala et al., 2016; Yu et al., 2004). In the near future, it will be critical to identify the IR ligands that mediate these effects. With that information, it will be important to identify therapeutic strategies that will maintain retinal function while suppressing oxidative stress and inflammation.
Supplementary Material
Highlights:
Insulin signaling in the RPE is required for maintenance of the light-evoked responses of photoreceptors during diabetes.
Diabetes-induced defects in the RPE-dependent c-wave component of the electroretinogram, occur with or without IR-mediated signaling in the RPE.
Loss of insulin signaling in the RPE protects the diabetic retina against oxidative stress and inflammation.
Acknowledgements:
We thank Onkar Sawant for technical assistance and Brian Perkins and Neal Peachey for critical evaluation of the manuscript.
Support: This work was supported by a VA Merit Award I01-BX002754 from the United States Department of Veterans Affairs from Biomedical Laboratory Research and Development to ISS, NIH R01EY026181, RO1EY027083, P30EY025585 to BAA and an unrestricted grant from the Research to Prevent Blindness to the Department of Ophthalmology, Cleveland Clinic Lerner College of Medicine at Case Western Reserve University.
Footnotes
Publisher's Disclaimer: This is a PDF file of an unedited manuscript that has been accepted for publication. As a service to our customers we are providing this early version of the manuscript. The manuscript will undergo copyediting, typesetting, and review of the resulting proof before it is published in its final citable form. Please note that during the production process errors may be discovered which could affect the content, and all legal disclaimers that apply to the journal pertain.
References
- Barber AJ, Nakamura M, Wolpert EB, Reiter CE, Seigel GM, Antonetti DA, Gardner TW, 2001. Insulin rescues retinal neurons from apoptosis by a phosphatidylinositol 3-kinase/Akt-mediated mechanism that reduces the activation of caspase-3. The Journal of biological chemistry 276, 32814–32821. [DOI] [PubMed] [Google Scholar]
- Chan EC, van Wijngaarden P, Liu GS, Jiang F, Peshavariya H, Dusting GJ, 2013. Involvement of Nox2 NADPH oxidase in retinal neovascularization. Investigative ophthalmology & visual science 54, 7061–7067. [DOI] [PubMed] [Google Scholar]
- Chong MP, Barritt GJ, Crouch MF, 2004. Insulin potentiates EGFR activation and signaling in fibroblasts. Biochemical and biophysical research communications 322, 535–541. [DOI] [PubMed] [Google Scholar]
- Granit R, 1933. The components of the retinal action potential in mammals and their relation to the discharge in the optic nerve. The Journal of physiology 77, 207–239. [DOI] [PMC free article] [PubMed] [Google Scholar]
- Haussinger D, Lang F, 1992. Cell volume and hormone action. Trends in pharmacological sciences 13, 371–373. [DOI] [PubMed] [Google Scholar]
- He L, Marioutina M, Dunaief JL, Marneros AG, 2014. Age- and gene-dosage-dependent creinduced abnormalities in the retinal pigment epithelium. The American journal of pathology 184, 1660–1667. [DOI] [PMC free article] [PubMed] [Google Scholar]
- Hetling JR, Pepperberg DR, 1999. Sensitivity and kinetics of mouse rod flash responses determined in vivo from paired-flash electroretinograms. The Journal of physiology 516 (Pt 2), 593–609. [DOI] [PMC free article] [PubMed] [Google Scholar]
- Hood DC, Birch DG, 1994. Rod phototransduction in retinitis pigmentosa: estimation and interpretation of parameters derived from the rod a-wave. Investigative ophthalmology & visual science 35, 2948–2961. [PubMed] [Google Scholar]
- Iacovelli J, Zhao C, Wolkow N, Veldman P, Gollomp K, Ojha P, Lukinova N, King A, Feiner L, Esumi N, Zack DJ, Pierce EA, Vollrath D, Dunaief JL, 2011. Generation of Cre transgenic mice with postnatal RPE-specific ocular expression. Investigative ophthalmology & visual science 52, 1378–1383. [DOI] [PMC free article] [PubMed] [Google Scholar]
- Ivanovic I, Anderson RE, Le YZ, Fliesler SJ, Sherry DM, Rajala RV, 2011. Deletion of the p85alpha regulatory subunit of phosphoinositide 3-kinase in cone photoreceptor cells results in cone photoreceptor degeneration. Investigative ophthalmology & visual science 52, 3775–3783. [DOI] [PMC free article] [PubMed] [Google Scholar]
- Jain SK, 1989. Hyperglycemia can cause membrane lipid peroxidation and osmotic fragility in human red blood cells. The Journal of biological chemistry 264, 21340–21345. [PubMed] [Google Scholar]
- Jain SK, Levine SN, Duett J, Hollier B, 1990. Elevated lipid peroxidation levels in red blood cells of streptozotocin-treated diabetic rats. Metabolism: clinical and experimental 39, 971–975. [DOI] [PubMed] [Google Scholar]
- Kowluru RA, Chan PS, 2007. Oxidative stress and diabetic retinopathy. Experimental diabetes research 2007, 43603. [DOI] [PMC free article] [PubMed] [Google Scholar]
- Lamb TD, Pugh EN Jr., 1992. A quantitative account of the activation steps involved in phototransduction in amphibian photoreceptors. The Journal of physiology 449, 719–758. [DOI] [PMC free article] [PubMed] [Google Scholar]
- Lee AV, Gooch JL, Oesterreich S, Guler RL, Yee D, 2000. Insulin-like growth factor I-induced degradation of insulin receptor substrate 1 is mediated by the 26S proteasome and blocked by phosphatidylinositol 3’-kinase inhibition. Molecular and cellular biology 20, 1489–1496. [DOI] [PMC free article] [PubMed] [Google Scholar]
- Lee CA, Li G, Patel MD, Petrash JM, Benetz BA, Veenstra A, Amengual J, von Lintig J, Burant CJ, Tang J, Kern TS, 2014. Diabetes-induced impairment in visual function in mice: contributions of p38 MAPK, rage, leukocytes, and aldose reductase. Investigative ophthalmology & visual science 55, 2904–2910. [DOI] [PMC free article] [PubMed] [Google Scholar]
- Mahadev K, Motoshima H, Wu X, Ruddy JM, Arnold RS, Cheng G, Lambeth JD, Goldstein BJ, 2004. The NAD(P)H oxidase homolog Nox4 modulates insulin-stimulated generation of H2O2 and plays an integral role in insulin signal transduction. Molecular and cellular biology 24, 1844–1854. [DOI] [PMC free article] [PubMed] [Google Scholar]
- Meyer-Franke A, Kaplan MR, Pfrieger FW, Barres BA, 1995. Characterization of the signaling interactions that promote the survival and growth of developing retinal ganglion cells in culture. Neuron 15, 805–819. [DOI] [PubMed] [Google Scholar]
- Naeser P, 1997. Insulin receptors in human ocular tissues. Immunohistochemical demonstration in normal and diabetic eyes. Upsala journal of medical sciences 102, 35–40. [DOI] [PubMed] [Google Scholar]
- Oliver FJ, de la Rubia G, Feener EP, Lee ME, Loeken MR, Shiba T, Quertermous T, King GL, 1991. Stimulation of endothelin-1 gene expression by insulin in endothelial cells. The Journal of biological chemistry 266, 23251–23256. [PubMed] [Google Scholar]
- Pugh EN Jr., Lamb TD, 1993. Amplification and kinetics of the activation steps in phototransduction. Biochimica et biophysica acta 1141, 111–149. [DOI] [PubMed] [Google Scholar]
- Punzo C, Kornacker K, Cepko CL, 2009. Stimulation of the insulin/mTOR pathway delays cone death in a mouse model of retinitis pigmentosa. Nature neuroscience 12, 44–52. [DOI] [PMC free article] [PubMed] [Google Scholar]
- Rains JL, Jain SK, 2011. Oxidative stress, insulin signaling, and diabetes. Free radical biology & medicine 50, 567–575. [DOI] [PMC free article] [PubMed] [Google Scholar]
- Rajala A, Tanito M, Le YZ, Kahn CR, Rajala RV, 2008. Loss of neuroprotective survival signal in mice lacking insulin receptor gene in rod photoreceptor cells. The Journal of biological chemistry 283, 19781–19792. [DOI] [PMC free article] [PubMed] [Google Scholar]
- Rajala RV, Kanan Y, Anderson RE, 2016. Photoreceptor Neuroprotection: Regulation of Akt Activation Through Serine/Threonine Phosphatases, PHLPP and PHLPPL. Advances in experimental medicine and biology 854, 419–424. [DOI] [PubMed] [Google Scholar]
- Samuels IS, Bell BA, Pereira A, Saxon J, Peachey NS, 2015. Early retinal pigment epithelium dysfunction is concomitant with hyperglycemia in mouse models of type 1 and type 2 diabetes. Journal of neurophysiology 113, 1085–1099. [DOI] [PMC free article] [PubMed] [Google Scholar]
- Samuels IS, Lee CA, Petrash JM, Peachey NS, Kern TS, 2012. Exclusion of aldose reductase as a mediator of ERG deficits in a mouse model of diabetic eye disease. Visual neuroscience 29, 267–274. [DOI] [PMC free article] [PubMed] [Google Scholar]
- Samuels IS, Portillo JC, Miao Y, Kern TS, Subauste CS, 2017. Loss of CD40 attenuates experimental diabetes-induced retinal inflammation but does not protect mice from electroretinogram defects. Visual neuroscience 34, E009. [DOI] [PMC free article] [PubMed] [Google Scholar]
- Samuels IS, Sturgill GM, Grossman GH, Rayborn ME, Hollyfield JG, Peachey NS, 2010. Lightevoked responses of the retinal pigment epithelium: changes accompanying photoreceptor loss in the mouse. Journal of neurophysiology 104, 391–402. [DOI] [PMC free article] [PubMed] [Google Scholar]
- Siegel B, Civan MM, 1976. Aldosterone and insulin effects on driving force of Na+ pump in toad bladder. The American journal of physiology 230, 1603–1608. [DOI] [PubMed] [Google Scholar]
- Sugimoto M, Cutler A, Shen B, Moss SE, Iyengar SK, Klein R, Folkman J, Anand-Apte B, 2013. Inhibition of EGF signaling protects the diabetic retina from insulin-induced vascular leakage. The American journal of pathology 183, 987–995. [DOI] [PMC free article] [PubMed] [Google Scholar]
- Woodruff ML, Rajala A, Fain GL, Rajala RV, 2015. Effect of knocking down the insulin receptor on mouse rod responses. Scientific reports 5, 7858. [DOI] [PMC free article] [PubMed] [Google Scholar]
- Wu J, Peachey NS, Marmorstein AD, 2004a. Light-evoked responses of the mouse retinal pigment epithelium. Journal of neurophysiology 91, 1134–1142. [DOI] [PMC free article] [PubMed] [Google Scholar]
- Wu X, Reiter CE, Antonetti DA, Kimball SR, Jefferson LS, Gardner TW, 2004b. Insulin promotes rat retinal neuronal cell survival in a p70S6K-dependent manner. The Journal of biological chemistry 279, 9167–9175. [DOI] [PubMed] [Google Scholar]
- Wyszecki G, Stiles WS, 1980. High-level trichromatic color matching and the pigment-bleaching hypothesis. Vision research 20, 23–37. [DOI] [PubMed] [Google Scholar]
- Yu X, Rajala RV, McGinnis JF, Li F, Anderson RE, Yan X, Li S, Elias RV, Knapp RR, Zhou X, Cao W, 2004. Involvement of insulin/phosphoinositide 3-kinase/Akt signal pathway in 17 betaestradiol-mediated neuroprotection. The Journal of biological chemistry 279, 13086–13094. [DOI] [PubMed] [Google Scholar]
- Zheng L, Du Y, Miller C, Gubitosi-Klug RA, Ball S, Berkowitz BA, Kern TS, 2007. Critical role of inducible nitric oxide synthase in degeneration of retinal capillaries in mice with streptozotocin-induced diabetes. Diabetologia 50, 1987–1996. [DOI] [PubMed] [Google Scholar]
Associated Data
This section collects any data citations, data availability statements, or supplementary materials included in this article.


