Abstract
Objectives
Teriflunomide, a disease‐modifying treatment approved for multiple sclerosis (MS), inhibits reversibly dihydroorotate dehydrogenase, an enzyme involved in de novo pyrimidine biosynthesis and down‐regulates proliferation of activated lymphocytes. We aimed to study the impact of this drug in the lymphocyte profiles of MS patients.
Methods
Fifty‐five patients with relapsing‐remitting MS who initiated teriflunomide treatment were included in the study. We studied peripheral blood mononuclear cells obtained before and 6 months after treatment initiation and explored effector, memory, and regulatory cells by flow cytometry. Wilcoxon matched pair tests were used to assess differences between basal and 6 months after treatment results. P‐values were corrected with Bonferroni test.
Results
When explored T and B cell subsets, we observed a decrease in the percentages of terminally differentiated CD4+ T cells (P = 0.001) and plasmablasts (P < 0.0001) after 6 months of treatment. These results were confirmed with the total cell number. When studied immunomodulatory cells, we observed a clear increase of monocytes expressing programmed death‐ligand 1 (PD‐L1) (P = 0.005), which correlated negatively with all effector CD8+ T cell subsets. We also observed an increase in the percentage of CD8+ T cells (P = 0.028) and monocytes (P = 0.04) producing IL‐10.
Conclusions
Teriflunomide induces a specific reduction in effector T and B cells that have shown to play a role in MS course and an increase in immunomodulatory cells. Particularly, this drug induces the expression of PD‐L1, a molecule involved in tolerance to autoantigens, which can contribute to inhibit the abnormal immune response taking place in MS.
Introduction
Teriflunomide (Aubagio®) is an oral immunomodulatory disease‐modifying therapy recently approved for the treatment of patients with relapsing‐remitting multiple sclerosis (RRMS).1 Its efficacy and safety have been demonstrated in several phase III clinical trials including TEMSO,2, 3 TOWER,4 and TENERE.5 It produces a significant reduction in the relapse rate, disability progression, and the appearance of new lesions in magnetic resonance imaging when compared with placebo.
Teriflunomide induces a reversible inhibition of dihydroorotate dehydrogenase (DHODH), a mitochondrial enzyme specifically required for de novo pyrimidine biosynthesis and particularly active in proliferating cells such as a lymphocytes.6 Although its therapeutic mode of action is not fully elucidated yet, it has been proposed that this drug produce a selective reduction of proliferating T and B cells.1
Inhibition of adhesion molecules, cytokines, protein tyrosine kinases, nuclear factor‐kB (NF‐kB) activation, and cyclooxygenase 2 activity have also been demonstrated in some in vitro studies, suggesting that teriflunomide may also impact signal transduction, migration, and inflammatory processes.7, 8
However, the effect of teriflunomide on the immune cell profile is not fully understood. The main goal of this study was to identify if teriflunomide induces specific changes in blood immune cells of multiple sclerosis (MS) patients to further understand the effect of the drug in the abnormal inflammatory response taking place in MS.
Methods
Patients
We studied 55 patients diagnosed with RRMS who consecutively initiated treatment with teriflunomide at the MS unit of Ramon y Cajal University Hospital and Clínico San Carlos Hospital (Madrid, Spain).
This study was approved by the ethics committees of both hospitals. Each patient signed a written consent before entry. Baseline characteristics of the patients included in the study are shown in Table 1.
Table 1.
Baseline characteristics of study population (n = 55)
| Clinical and epidemiological variables | Results |
|---|---|
| Age at baseline (years) (M ± SE) | 44.7 ± 1.3 |
| Sex (male/female) | 14/41 |
| Disease duration (months) (M ± SE) | 155.1 ± 25.5 |
| EDSS score at baseline (M ± SE) | 2.4 ± 0.3 |
| Relapses in the 2 years before treatment (M ± SE) | 0.8 ± 0.1 |
| Previous treatments | 13 N; 35 FL; 7 SL |
| Number of previous treatments | 13(N); 27(1); 7(2);8(≥3) |
| Washout period (months) (M ± SE) | 8.5 ± 2.3 |
FL: prior treatment with first line drugs; M ± SE, Mean±Standard error; N, no previous disease‐modifying treatment; SL, prior treatment with second‐line drugs; (1): Prior treatment with one disease‐modifying drug; (2): prior treatment with two disease‐modifying drugs; (≥3): prior treatment with three or more drugs.
Samples
Samples were collected immediately before initiating treatment with teriflunomide and 6 months after. Heparinized whole blood was collected and peripheral blood mononuclear cells (PBMC) were obtained within 2 h by Ficoll density gradient centrifugation (Fresenius Kabi, Norway) and cryopreserved in aliquots of 5–6 x 10⁶cells until studied. Blood absolute leukocyte counts were also examined at baseline and 6 months after in fresh blood samples.
Monoclonal antibodies
The following monoclonal antibodies were used in the study: CD8‐FITC, CD27‐FITC, Interferon (IFN)‐gamma‐FITC, CD24‐PE, CD80‐PE, CD197‐PE (CCR7‐PE), CD3‐PerCP, CD38‐PE‐Cy5.5, CD19‐PE‐Cy7, CD25‐PE‐Cy7, programmed death‐ligand 1 (PD‐L1)‐PE‐Cy7, TNF‐alpha‐PerCP‐Cy5.5, CD45RO‐APC, CD56‐APC, HLA‐DR‐APC, CD4‐APC‐H7, CD8‐APC‐H7, CD14‐APC‐H7, CD3‐BV421, CD69‐BV421, CD127‐BV421, CD45‐V500 (all from BD Biosciences, San Diego, CA); interleukin (IL)‐10‐PE (Biolegend, San Diego, CA), and IL‐17‐APC (R&D Systems, Minneapolis, MN).
Labeling of surface antigens
Aliquots of 106 PBMC were resuspended in RPMI 1640 medium (Thermofisher Scientific, Waltham, MA), stained with the appropriate amounts of monoclonal antibodies during 30 min at 4°C in the dark, washed twice with PBS and analyzed.
In vitro stimulation and intracellular cytokine staining
Aliquots of 106 PBMC were resuspended in 1 mL of Complete Medium with 50 ng/mL Phorbol 12‐myristate 13‐acetate (PMA) (Sigma‐Aldrich, St. Louis, MO) and 750 ng/mL Ionomycin (Sigma‐Aldrich) in presence of 2 μg/mL Brefeldin A (GolgiPlug, BD Biosciences) and 2.1 μmol/L Monensin (GolgiStop, BD Biosciences) in polypropylene tubes, and incubated for 4 h at 37°C in 5% CO2. To identify IL‐10‐producing B cells, PBMC were preincubated with 3 μg/mL of CpG oligonucleotide (InvivoGen, San Diego, CA) during 20 h at 37°C with 5% CO2 prior to stimulation. After incubation, PBMC were washed with PBS and stained for 30 min at 4°C in the dark with appropriate amounts of monoclonal antibodies recognizing the surface antigens. Then, cells were washed with PBS, fixed, and permeabilized for 20 min at 4°C in the dark with Cytofix/Cytoperm Kit (BD Biosciences), washed twice with Perm/Wash solution (BD Biosciences), and stained intracellularly 30 min at 4°C in the dark with monoclonal antibodies recognizing the following cytokines: IFN‐gamma, TNF‐alpha, IL‐17, and IL‐10. After two washes, PBMC were analyzed in a FACSCanto II flow cytometer (BD Biosciences).
Flow cytometry
Cells were always analyzed within a maximum period of 1 h after staining. Mean autofluorescence values were set using appropriate negative isotype controls. Data analysis was performed using FACSDiva Software V.8.0 (BD Biosciences). A gate including lymphocytes and monocytes and excluding debris and apoptotic cells was established; a minimum amount of 30.000 events were analyzed. Gating strategy to identify the different leukocyte populations is shown in Figure S1 (S1). In addition, we followed the strategy detailed below to identify the different subpopulations. CD4+ and CD8+ T cells were classified as: naïve (CCR7+ CD45RO−); central memory (CM) (CCR7+ CD45RO+); effector memory (EM) (CCR7− CD45RO+); terminally differentiated (TD) (CCR7− CD45RO−). Regulatory CD4 T cells (Treg) were defined as CD3+ CD4+ CD25hi CD127low. B cells were classified as: memory (CD19+ CD27dim CD38dim), plasmablasts (CD19+ CD27hi CD38hi); and regulatory B cells were classified as CD19+ CD27‐ CD24hi CD38hi cells (Breg) or CD19+ IL‐10+ cells. PD‐L1 was explored in monocytes by studying its coexpression with CD14 in PBMC. Costimulatory and activation markers expression were analyzed on monocytes (CD80, HLA‐DR), and on CD4+ and CD8+ T cells (CD69, HLA‐DR).
For intracellular cytokine staining, nonstimulated PBMC and appropriate isotype controls were used. We explored intracellular production of IFN‐gamma and TNF‐alpha, IL‐17 and IL‐10 by CD4+ and CD8+ T cells. Intracellular IL‐10 production was also assessed in CD19+ B cells and monocytes.
Proliferation assay
Aliquots of 106 PBMC were incubated in the presence or absence of 4 μg of anti‐PD‐L1 neutralizing antibody (e‐Biosciences, San Diego, CA) during 4 h at 37°C with 5% CO2. Then cells were stimulated with 1 μg/mL of purified anti‐CD3 antibody (BD Biosciences) during 72 h. CD4+ T cell proliferation was quantified using the BD Pharmingen BrdU flow kit (BD Biosciences). Briefly, cells were incubated with 3 mmol/L BrdU during 18 h, washed in saline, and stained with the appropriate amount of monoclonal antibodies for identifying CD4+ T cell subsets, as described above. After washing, cells were fixed and permeabilized, incubated with 30 μg of DNase, stained with an anti‐BrdU‐FITC antibody, and analyzed by flow cytometry.
Statistical analysis
Statistical analyses were made using GraphPad Prism 6.0 software (GraphPad Prism Inc, La Jolla, CA). Wilcoxon matched pair tests were used to assess differences between basal and 6 months after treatment results. Mann–Whitney test was used to compare different groups of patients. P‐values were corrected using Bonferroni method. Correlations were assessed by a Spearman test. P‐values below 0.05 were considered as significant.
Results
Fifty‐five patients (14 male and 41 female) treated with teriflunomide for at least 6 months were included in the study. Baseline characteristics are shown in Table 1.
Age at treatment initiation was 44.7 ± 1.3 (Mean ± standard error) years and disease duration was 155.1 ± 25.5 months. Annualized relapse rate in the previous 12 months was 0.8 ± 0.1 and the EDSS score at baseline was 2.4 ± 0.3. Thirteen patients were treatment naïve, 35 previously received first‐line drugs (interferon‐β, glatiramer acetate, or dimethyl fumarate), and seven second‐line drugs (natalizumab, fingolimod, or azathioprine). Twenty‐seven patients were previously treated with only one disease‐modifying drug; seven with two, and eight with three or more. Patients who received previous treatments underwent a minimum washout period of a month before initiating teriflunomide treatment (Median = 3.0 months, 25%–75% IQR: 1.0–6.0 months).
Effector and immunomodulatory subsets
We explored the changes induced by teriflunomide in blood mononuclear cell counts after 6 months of treatment. Patients experienced a discrete decrease in the absolute lymphocyte counts (1908 ± 89.9 vs. 1754 ± 10.1; P < 0.0001). No patient developed lymphopenia during follow‐up. We further addressed the impact of this drug on the percentages of different leukocyte subsets (Table 2 and Fig. 1). To avoid inconclusive results, we applied Bonferroni correction to all comparisons.
Table 2.
Teriflunomide induced changes in leukocyte blood subsets
| Percentages | Absolute numbers | ||||||
|---|---|---|---|---|---|---|---|
| Total patients (n = 55) | Basal (M ± SE) | 6 months (M ± SE) | P | Basal (M ± SE) | 6 months (M ± SE) | P | |
| Effector and memory subsets | CD4+T cells | 34.8 ± 1.4 | 38.6 ± 1.5 | NS | |||
| Naïve | 21.2 ± 1.3 | 20.4 ± 1.3 | NS | ||||
| Central memory | 9.2 ± 0.4 | 9.9 ± 0.5 | NS | ||||
| Effector memory | 6.3 ± 0.3 | 6.5 ± 0.4 | NS | ||||
| Terminally differentiated | 2.1 ± 0.1 | 1.7 ± 0.1 | 0.001 | 50.2 ± 4.8 | 42.3 ± 4.7 | P < 0.0001 | |
| CD8+T cells | 14.2 ± 0.7 | 13.3 ± 0.9 | NS | ||||
| Naïve | 5.3 ± 0.4 | 5.0 ± 0.5 | NS | ||||
| Central memory | 0.5 ± 0.05 | 0.6 ± 0.1 | NS | ||||
| Effector memory | 2.4 ± 0.2 | 2.5 ± 0.3 | NS | ||||
| Terminally differentiated | 5.9 ± 0.7 | 5.2 ± 0.5 | NS | ||||
| NKT cells | 4.2 ± 0.5 | 4.1 ± 0.5 | NS | ||||
| NK cells | 10.1 ± 0.7 | 9.1 ± 0.8 | NS | ||||
| CD19+ B cells | 10.1 ± 0.7 | 10.5 ± 0.9 | NS | ||||
| Memory B cells | 2.3 ± 0.2 | 2.4 ± 0.2 | NS | ||||
| Plasmablasts | 0.1 ± 0.01 | 0.05 ± 0.005 | <0.0001 | 2.7 ± 0.3 | 1.2 ± 0.1 | P < 0.0001 | |
| Monocytes | 18.3 ± 1.1 | 20.1 ± 1.4 | NS | ||||
| Immunomodulatory subsets | Treg | 1.3 ± 0.1 | 1.2 ± 0.1 | NS | |||
| Breg | 0.1 ± 0.01 | 0.1 ± 0.01 | NS | ||||
| CD56bright | 0.99 ± 0.1 | 1.15 ± 0.1 | NS | ||||
| PD‐L1+ Monocytes | 0.3 ± 0.04 | 0.6 ± 0.1 | 0.005 | 21.5 ± 2.5 | 33.8 ± 5.4 | P = 0.01 | |
| CD4+ IL‐10+ | 0.2 ± 0.02 | 0.2 ± 0.02 | NS | ||||
| CD8+ IL‐10+ | 0.13 ± 0.01 | 0.19 ± 0.02 | 0.028 | 3.2 ± 0.3 | 4.0 ± 0.5 | NS | |
| CD19+ IL‐10+ | 0.08 ± 0.01 | 0.09 ± 0.01 | NS | ||||
| IL‐10+ Monocytes | 0.04 ± 0.01 | 0.07 ± 0.01 | 0.044 | 3.7 ± 0.7 | 5.3 ± 1.1 | NS | |
Values are expressed as percentages of total peripheral blood mononuclear cells and as absolute numbers (cells/μl). P‐values were corrected using Bonferroni method. Bmem, memory B cells; Breg, CD27‐ regulatory B cells; IL, interleukin; M ± SEM, Mean ± Standard error of mean; NK, natural killer cells; NKT, natural killer T cells; NS, not significant; PB, plasmablasts; PD‐L1, programmed death‐ligand 1; Treg, regulatory T cells.
Figure 1.
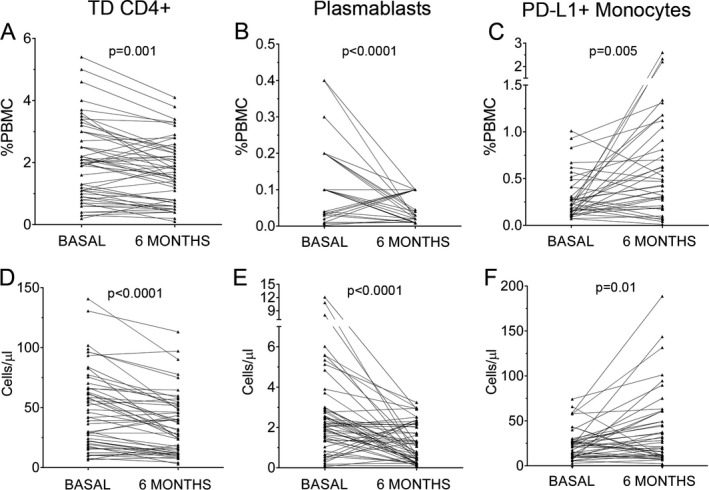
Percentages (A, B, C) and absolute cell counts (D, E, F) of terminally differentiated (TD) CD4+ T cells (A, D), plasmablasts (B, E) and PD‐L1+ monocytes (C, F) obtained before (basal) and at 6 months of teriflunomide treatment (n = 55). Percentages are referred to total peripheral blood mononuclear cells (PBMC).
We first explored naïve, memory, and effector CD4+ and CD8+ T cell subsets. Teriflunomide induced a clear decrease on TD CD4+ T cells after 6 months of treatment (P = 0.001). In addition, we explored the percentages of effector and memory B cell subsets. The only difference observed after 6 months of teriflunomide treatment was a consistent decrease of plasmablasts (P < 0.0001). Representative dot plots are shown in Figure 2.
Figure 2.
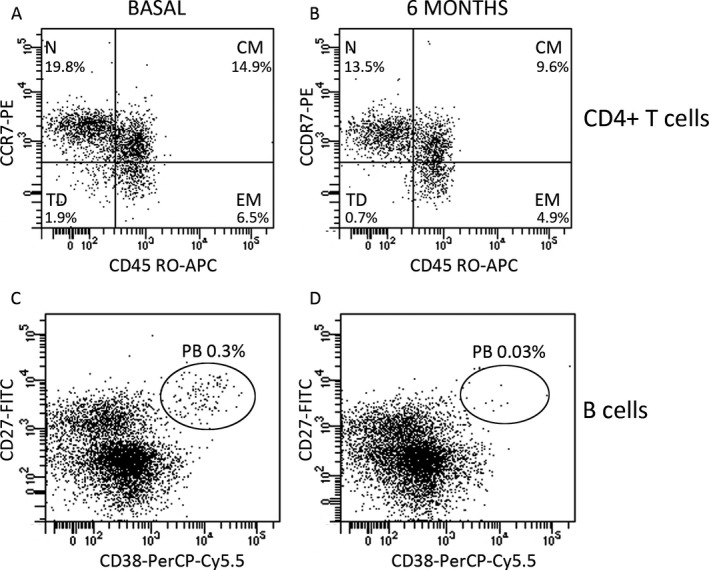
Dot plots showing CD4+ T cells (A and B) and B cells (C and D) at basal state (A and C) and after 6 months of treatment (B and D). Plots are gated on CD4 T cells (A and B) and B cells (C and D). Naïve (N), central memory (CM), effector memory (EM) and terminally differentiated cells (TD) were studied according to their differential membrane expression of CD197 (CCR7) and CD45RO. Plasmablasts (PB) were studied according to their differential membrane expression of CD27 and CD38. Percentages showed in the plots are referred to total peripheral blood mononuclear cells.
When evaluated IFN‐gamma, TNF‐alpha and IL‐17 intracellular cytokine production by CD4 and CD8+ T cells, we did not find significant differences between basal and 6 months samples (data not shown).
We next studied the effect of teriflunomide in the regulatory subsets (Table 2). We found a discrete increase of monocytes (P = 0.044) and of CD8+ T cells (P = 0.028) producing IL‐10 (Fig. 3).
Figure 3.
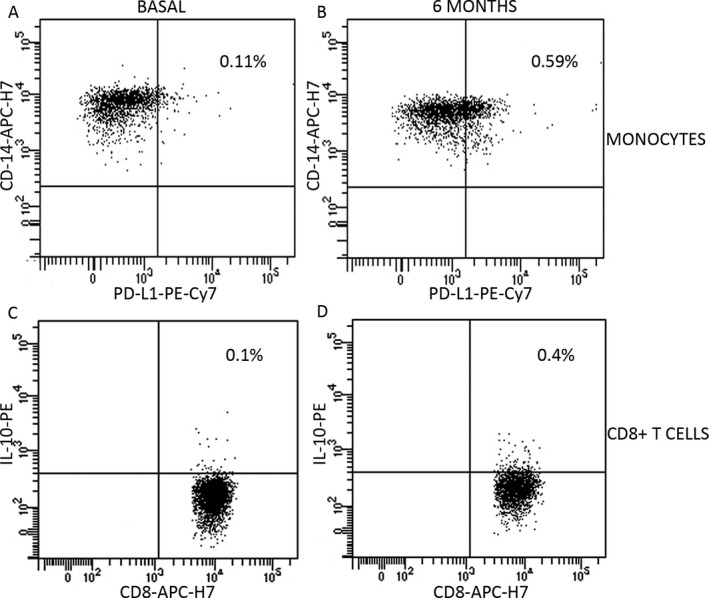
Dot plots showing membrane expression of PD‐L1 on monocytes (A and B) and intracellular expression of IL‐10 on CD8+ T cells (C and D) at basal state (A and C) and after 6 months of treatment (B and D). A and B plots are gated on monocytes (CD14+ cells); C and D plots are gated on CD8+ T cells. Percentages are referred to total peripheral blood mononuclear cells.
We additionally explored monocytes expressing PD‐L1+, which have shown to modulate adaptive immune responses.9, 10 We observed a clear increase after 6 months of treatment (P = 0.005, Figs. 1 and 3).
We next studied if previous treatments could introduce a bias in our results by analyzing differences in basal values of the different leukocyte subsets between naïve (n = 13) and previously treated patients (n = 42). We did not find any significant differences (data not shown). We also analyzed differences between basal and 6 month samples excluding the seven patients receiving second‐line drugs prior to teriflunomide. The results did not change substantially. TD CD4+ T cells, and plasmablasts decreased during teriflunomide treatment and PD‐L1+ monocytes increased (P < 0.001 in all cases).
We explored if significant data also corresponded with variations in the total cell numbers. Our results confirmed the decrease of TD CD4+ T cells (50.2 ± 4.8 cells/mL vs. 42.3 ± 4.7 cells/mL; P < 0.0001) and plasmablasts (2.7 ± 0.3 cells/mL vs. 1.2 ± 0.1 cells/mL; P < 0.0001). We also confirmed the increase of PD‐L1+ monocytes (21.5 ± 2.5 cells/mL vs. 33.8 ± 5.4 cells/mL; P = 0.01). Results are shown in Table 2 and Figure 1.
Effect in costimulatory and activation markers and on CD4+ T cell proliferation
To deepen into the effect of teriflunomide in immune cells, we also explored costimulatory and activation molecules in monocytes and T lymphocytes of seven of the studied patients, before and after 6 months of teriflunomide treatment. No differences were observed in CD80 and HLA‐DR expression by monocytes or in HLA‐DR expression in T cells, but a clear decrease in mean fluorescence intensity (MFI) of CD69 was found in CD4+ T cells after treatment (P = 0.03, Fig. 4).
Figure 4.
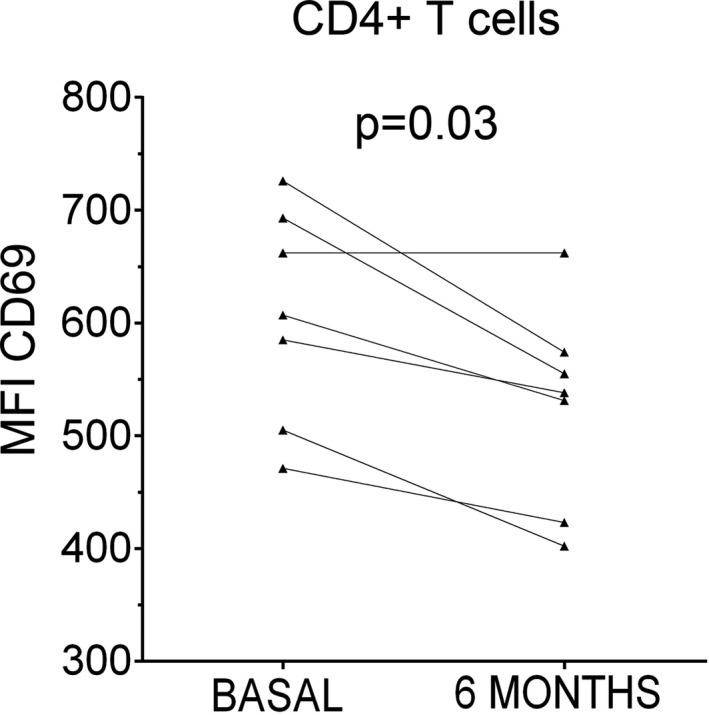
Expression of CD69 on CD4+ T cells. We observed that CD69 expression on CD4+ T cells measured as the mean fluorescence intensity (MFI) is reduced after 6 months of teriflunomide treatment (6 months) when compared with results of samples obtained before treatment (basal) (n = 7).
As PD‐L1 acts as an immunomodulatory receptor, we investigated if this molecule could have an influence in the reduction of TD CD4+ T cells. We studied this in PBMC of seven MS patients obtained prior to initiating teriflunomide treatment. Cells were stimulated with anti‐CD3, in the presence or absence of a neutralizing anti‐PD‐L1 antibody. Proliferation of the different T cell subsets was explored. We found higher percentages of proliferating TD CD4+ T cells when incubated with anti‐PD‐L1 antibody (Median = 30.3; 25%–75% IQR: 15.4–43.0) than in control samples (Median = 21.4; 25%–75% IQR: 14.1–35.6; P = 0.03).
Association between immunomodulatory and effector populations
We explored the putative correlation between immunomodulatory and effector subsets after 6 months of treatment. There was a positive correlation within the percentage of CD8+ IL‐10+ T cells and those of CD4+ IL‐10+ T cells (r = 0.44, P = 0.01) and CD19+ IL‐10+ B cells (r = 0.53, P < 0.0001). We also found modest negative correlations between PD‐L1+ monocytes and the effector CD8+ T cells. The ratios (r) were: −0.37 for CM cells (P = 0.01), −0.39 for EM ones (P = 0.01), and −0.36 for TD subset (P = 0.02). Results are shown in Figure 5.
Figure 5.
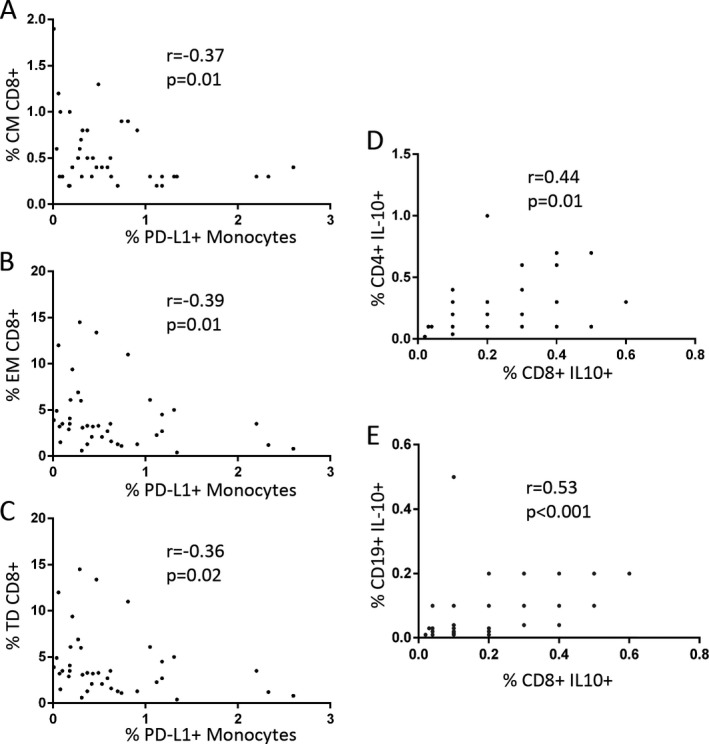
PD‐L1+ monocytes show negative correlation with central memory (CM, A), effector memory (EM, B) and terminally differentiated (TD, C) CD8+ T cells. CD8+ IL10+ T cells correlate positively with CD4+ IL10+ T cells (D) and CD19+ IL10+ B cells (E).
Discussion
Teriflunomide is an inhibitor of DHODH that ameliorates multiple sclerosis course by reducing activation‐induced proliferation of lymphocytes, which is highly dependent on the de novo pyrimidine synthesis.6 It is the active metabolite of leflunomide, a disease‐modifying antirheumatic drug. However, the changes in the different immune cell subsets induced by this treatment have not been totally identified yet. Most works were made with leflunomide in vitro and in animal models. This molecule causes cell cycle arrest in early S phase without inducing apoptosis,11 impedes formation of the immune synapses,12 and decreases the release of Th1 cytokines.13, 14 In vitro studies also showed that teriflunomide inhibits lymphocyte proliferation, without inducing cytotoxicity and significantly decreased the release of proinflammatory cytokines from activated monocytes.8
Less is known on teriflunomide‐induced changes in lymphocyte profiles of MS patients. In a small cohort of seven RRMS patients, it was described a reduction in the number of total, mature and regulatory B cells.15
In this work we deepened into the mechanism of action of teriflunomide by studying a wider array of leukocytes including different T, B, and monocyte subsets in a cohort of 55 RRMS treated with teriflunomide. We explored changes induced by this treatment by comparing results obtained in basal and 6 month samples. First we observed that teriflunomide treatment induces a significant decrease in the percentages and total cell counts of TD CD4+ T cells and in plasmablasts. Terminally differentiated T cells are home to peripheral tissue where they pursue their effector functions such as secretion of proinflammatory cytokines.16 In addition, the percentage of plasmablasts, a highly differentiated, antibody secreting B cell subset, is elevated in the blood of MS patients since the first clinical presentation of the disease and correlates with disease activity.17 The decrease of both effector cell subsets under teriflunomide treatment may contribute to the beneficial effect of the drug.
We did not find changes in Th1 and Th17 cytokines upon teriflunomide treatment. The main effect of this drug is observed in TD CD4+ T cells, which represent normally less than 10% of total CD4+ T cells. This may be a reason by which these differences are not appreciated. However, TD cells are important, since they are the main cells migrating to inflamed tissues upon inflammation.16
Other data indicating the effect of teriflunomide in T cell activation is the decrease induced by this treatment in the expression of CD69, which is up‐regulated by CD4+ T cells upon activation.18
When studied immunomodulatory populations, we observed an increase in the percentages of CD8+ T cells and monocytes producing IL‐10 after 6 months of treatment. Our results agree with in vitro results obtained with leflunomide, an analog of this drug, which showed an increase in IL‐10 production by T lymphocytes.13 Interestingly, the values of CD8+ IL‐10+ T cells correlated in 6 month samples with that of monocytes and CD19+ cells producing IL‐10, which suggests that this drug can induce a bias toward a tolerogenic response.
In addition, we observed an increase in monocytes expressing PD‐L1+. PD‐L1 is a ligand of PD‐1, a cell surface receptor with an important role in down‐regulating the immune system and promoting self‐tolerance by suppressing T cell inflammatory activity.9 The interaction between PD‐1/PD‐L1 induce inhibition of T cell proliferation, cytokine production, and cytolytic activity.10 PD‐1‐deficient animals develop diverse autoimmune conditions19, 20 and its blockade in experimental autoimmune encephalomyelitis model increase disease severity.21, 22 PD‐1/PD‐L1 axis represents a checkpoint to control immune responses and its up‐regulation in monocytes can be important to modulate the abnormal response in MS.
In our series, PD‐L1 overexpression could contribute to down‐modulate TD CD4+ T cells. When incubated PBMC of our patients with anti‐PD‐L1 neutralizing antibodies, we observed an increase in the proliferation of these cells.
In junction, our results support previous data describing that MS may associate with defective T regulatory responses and that up‐regulation of these cell subsets may associate with a more benign disease course.23, 24
The main limitation of our study was the low number of treatment naïve patients (n = 13). Patients were consecutively recruited, thus reflecting real life data in our setting. However, we ruled out the putative effects of prior treatments by excluding patients treated with second‐line drugs from the analysis and by comparing basal data of patients receiving or not receiving previous treatments. These analyses showed that our data did not change substantially with prior treatments, probably due to the washout period.
In summary, we observed that teriflunomide induces a shift in the abnormal response taking place in MS. It targets specifically terminally differentiated cells and induces a regulatory status in the innate immune response. These data contribute to ascertain the mechanism of action of this drug.
Author Contributions
SM, NV, and ATV collected and stored blood samples and performed the experiments. SM wrote the manuscript draft. ERM, and ER supervised flow cytometry studies. RAL, RA, SSM, LCF, EM and JCAC visited MS patients and collected clinical data. All authors read and approved the final manuscript. LMV designed and supervised the study and corrected the manuscript.
Conflict of Interest
None declared.
Supporting information
Figure S1. Representative gating strategy for flow cytometry analysis.
Acknowledgments
Authors acknowledge MA Fernández de Pablos and S Ortega for their excellent technical support and A Muriel for his help with the statistical analyses. This work was supported by grants FIS‐PI15/00513 and RD16/0015/0001 from the Instituto de Salud Carlos III. Ministerio de Economía y Competitividad, Spain and FEDER funds.
Funding information
This work was supported by grants FIS‐PI15/00513 and RD16/0015/0001 from the Instituto de Salud Carlos III. Ministerio de Economía y Competitividad, Spain and FEDER funds.
Funding Statement
This work was funded by Instituto de Salud Carlos III grants FIS‐PI15/00513 and RD16/0015/0001; Ministerio de Economía y Competitividad grant .
References
- 1. Bar‐Or A. Teriflunomide (Aubagio®) for the treatment of multiple sclerosis. Exp Neurol 2014;262:57–65. [DOI] [PubMed] [Google Scholar]
- 2. Miller AE, O'Connor P, Wolinsky JS, et al. Teriflunomide Multiple Sclerosis Trial Group . Pre‐specified subgroup analyses of a placebo‐controlled phase III trail (TEMSO) of oral teriflunomide in relapsing multiple sclerosis. Mult Scler 2012;18:1625–1632. [DOI] [PMC free article] [PubMed] [Google Scholar]
- 3. Wolinsky JS, Narayana PA, Nelson F, et al. Magnetic resonance imaging outcomes from fase III trials of teriflunomide. Mult Scler 2013;19:1310–1319. [DOI] [PubMed] [Google Scholar]
- 4. Confavreux C, O'Connor P, Comi G, et al. Oral teriflunomide for patients with relapsing multiple sclerosis (TOWER): a randomised, double‐blind, placebo‐controlled, phase 3 trial. Lancet Neurol 2014;13:247–256. [DOI] [PubMed] [Google Scholar]
- 5. Vermersch P, Czlonkowska A, Grimaldi LM, et al. Teriflunomide versus subcutaneous interferon beta‐1a in patients with relapsing multiple sclerosis: a randomised, controlled phase 3 trial. Mult Scler 2014;20:705–716. [DOI] [PubMed] [Google Scholar]
- 6. Bar‐Or A, Pachner A, Menguy‐Vacheron F, et al. Teriflunomide and its mechanism of action in multiple sclerosis. Drugs 2014;74:659–674. [DOI] [PMC free article] [PubMed] [Google Scholar]
- 7. Fragoso YD, Brooks JB. Leflunomide and teriflunomide: altering the metabolism of pyrimidines for the treatment of autoimmune diseases. Expert Rev Clin Pharmacol 2015;8:315–320. [DOI] [PubMed] [Google Scholar]
- 8. Li L, Liu J, Delohery T, et al. The effects of teriflunomide on lymphocyte subpopulations in human peripheral blood mononuclear cells in vitro. J Neuroimmunol 2013;265:82–90. [DOI] [PubMed] [Google Scholar]
- 9. Goodman A, Patel SP, Kurzrock R. PD‐1‐PD‐L1 immune‐checkpoint blockade in B‐cell lymphomas. Nat Rev Clin Oncol 2017;14:203–220. [DOI] [PubMed] [Google Scholar]
- 10. Carter L, Fouser LA, Jussif J, et al. PD‐1:PD‐L inhibitory pathway affects both CD4(+) and CD8(+) T cells and is overcome by IL‐2. Eur J Immunol 2002;32:634–643. [DOI] [PubMed] [Google Scholar]
- 11. Ringshausen I, Oelsner M, Bogner C, et al. The immunomodulatory drug leflunomide inhibits cell cycle progression of B‐CLL cells. Leukemia 2008;22:635–638. [DOI] [PubMed] [Google Scholar]
- 12. Zeyda M, Poglitsch M, Geyeregger R, et al. Disruption of the interaction of T cells with antigen‐presenting cells by the active leflunomide metabolite teriflunomide: involvement of impaired integrin activation and immunologic synapse formation. Arthritis Rheum 2005;52:2730–2739. [DOI] [PubMed] [Google Scholar]
- 13. Korn T, Magnus T, Toyka K, Jung S. Modulation of effector cell functions in experimental autoimmune encephalomyelitis by leflunomide‐mechanisms independent of pyrimidine depletion. J Leukoc Biol 2004;76:950–960. [DOI] [PubMed] [Google Scholar]
- 14. Dimitrova P, Skapenko A, Herrmann ML, et al. Restriction of de novo pyrimidine biosynthesis inhibits Th1 cell activation and promotes Th2 cell differentiation. J Immunol 2002;169:3392–3399. [DOI] [PubMed] [Google Scholar]
- 15. Gandoglia I, Ivaldi F, Laroni A, et al. Teriflunomide treatment reduces B cells in patienst with MS. Neurol Neuroimmunol Neuroinflamm 2017;4:e403 10.1212/nxi.0000000000000403. [DOI] [PMC free article] [PubMed] [Google Scholar]
- 16. Mahnke YD, Brodie TM, Sallusto F, et al. The who's who of T‐cell differentiation: human memory T‐cell subsets. Eur J Immunol 2013;43:2797–2809. [DOI] [PubMed] [Google Scholar]
- 17. Rivas JR, Ireland SJ, Chkheidze R, et al. Peripheral VH4+ plasmablasts demonstrate autoreactive B cell expansion toward brain antigens in early multiple sclerosis patients. Acta Neuropathol 2017;133:43–60. [DOI] [PMC free article] [PubMed] [Google Scholar]
- 18. Sancho D, Gómez M, Sánchez‐Madrid F. CD69 is an immunoregulatory molecule induced following activation. Trends Immunol 2005;26:136–140. [DOI] [PubMed] [Google Scholar]
- 19. Nishimura H, Nose M, Hiai H, et al. Development of lupus‐like autoimmune diseases by disruption of the PD‐1 gene encoding an ITIM motif‐carrying immunoreceptor. Immunity 1999;11:141–1517. [DOI] [PubMed] [Google Scholar]
- 20. Nishimura H, Okazaki T, Tanaka Y, et al. Autoimmune dilated cardiomyopathy in PD‐1 receptor‐deficient mice. Science 2001;291:319–322. [DOI] [PubMed] [Google Scholar]
- 21. Carter LL, Leach MW, Azoitei ML, et al. PD‐1/PD‐L1, but not PD‐1/PD‐L2, interactions regulate the severity of experimental autoimmune encephalomyelitis. J Neuroimmunol 2007;182:124–134. [DOI] [PubMed] [Google Scholar]
- 22. Salama AD, Chitnis T, Imitola J, et al. Critical role of the Programmed Death‐1 (PD‐1) pathway in regulation of experimental autoimmune encephalomyelitis. J Exp Med 2003;198:71–78. [DOI] [PMC free article] [PubMed] [Google Scholar]
- 23. Correale J, Villa A. Role of CD8+ CD25+ Foxp3+ regulatory T cells in multiple sclerosis. Ann Neurol 2010;67:625–638. [DOI] [PubMed] [Google Scholar]
- 24. Baecher‐Allan CM, Costantino CM, Cvetanovich GL, et al. CD2 costimulation reveals defective activity by human CD4+CD25(hi) regulatory cells in patients with multiple sclerosis. J Immunol 2011;186:3317–3326. [DOI] [PMC free article] [PubMed] [Google Scholar]
Associated Data
This section collects any data citations, data availability statements, or supplementary materials included in this article.
Supplementary Materials
Figure S1. Representative gating strategy for flow cytometry analysis.


