

Abstract
Although studies over the last decades have firmly connected a number of genes and molecular pathways to aging, the aging process as a whole still remains poorly understood. To gain novel insights into the mechanisms underlying aging, instead of considering aging genes individually, we studied their characteristics at the systems level in the context of biological networks. We calculated a comprehensive set of network characteristics for human aging-related genes from the GenAge database. By comparing them with other functional groups of genes, we identified a robust group of aging-specific network characteristics. To find the structural basis and the molecular mechanisms underlying this aging-related network specificity, we also analyzed protein domain interactions and gene expression patterns across different tissues. Our study revealed that aging genes not only tend to be network hubs, playing important roles in communication among different functional modules or pathways, but also are more likely to physically interact and be co-expressed with essential genes. The high expression of aging genes across a large number of tissue types also points to a high level of connectivity among aging genes. Unexpectedly, contrary to the depletion of interactions among hub genes in biological networks, we observed close interactions among aging hubs, which renders the aging subnetworks vulnerable to random attacks and thus may contribute to the aging process. Comparison across species reveals the evolution process of the aging subnetwork. As the organisms become more complex, the complexity of its aging mechanisms increases and their aging hub genes are more functionally connected.
Introduction
Aging is a fundamental biological process accompanied by a general decline in tissue function and increased risk for many diseases. Despite the discovery of several aging-related signaling pathways conserved across species, the underlying causes of aging remain one of the profound mysteries in biology. The theories proposed to explain aging include the accumulation of somatic mutations (1), the over-activity or hyper-function of developmental processes (2), and the accumulation of protein aggregates (3). The current consensus is that a large number of genes and pathways are involved in controlling the aging process, underlying its complexity. Just moving from a gene-by-gene approach to a global perspective of networks can shed new light on the complex aging process (4).
Over the last decade, many different types of biological networks have been constructed and both the quantity and quality have increased dramatically. Biological networks have been used to study various groups of genes. It was found that essential genes are more likely to be network hubs (i.e. genes with a large number of interacting partners) (5,6). Network-based disease studies have found that disease genes tend to have higher degrees (i.e. the number of interacting partners), cluster together, and are positioned at the central network locations (7). Biological networks have also been used to facilitate both better understanding of the molecular mechanisms of aging and the refinement of its theoretical models. Protein interaction maps show that human aging-related genes tend to be network hubs; most strikingly, it clearly shows a large cluster of development-associated genes, indicating the influence on human aging of developmental processes (8). A study of human homologs of longevity-associated genes from yeast, nematode, and fly in a longevity network showed that human longevity homologs tend to have higher degrees and shorter shortest paths between each other (9). Another study of the disease-aging network found that human disease genes are much closer to aging genes than expected by chance alone (10).
A large number of genes related to fundamental biological aging processes have been manually curated for the human species (11). These ‘aging’ genes include both genes that are associated with a given age-related pathology and ones that can regulate the aging process as a whole or at least multiple aspects of the aging phenotype. However, systems-level analyses of human aging genes in biological networks are lacking. Responding to this need, we here studied an updated collection of human aging genes (11) in a network context by considering aging genes as a whole, instead of examining each gene individually. To find more robust aging-specific properties we not only compared aging genes with background genes but also with other groups of genes as controls. We explored the network characteristics of aging genes in both protein interaction and gene coexpression networks. We also examined the expression patterns of aging genes across different tissues. In addition to discoveries of novel properties of aging genes in biological networks, this study also provided new clues about the molecular mechanisms of aging. First, we found aging genes are more likely to be network hubs and play important roles in communication among different functional modules or pathways. Second, we found a strong association between aging genes and essential genes (i.e. the genes whose deletion will lead to embryonic lethality), indicating that essential genes may influence the aging process. Third, we found an unexpected enrichment of interactions among aging hub genes, which renders the aging interaction subnetwork more vulnerable to random attacks. Fourth, we found that both aging genes and their network neighbors tend to express in more tissues with higher expression levels, which indicates that the aging subnetwork is more stable across different human tissues.
Results
Aging genes tend to be network hubs and intermediaries for cross-talks
Based on various evidence from human (e.g. progeroid syndromes), model organisms (e.g. delayed or accelerated aging in transgenic mice), and functional analysis (e.g. pathways linked to the aging process), a comprehensive set of genes potentially associated with human aging were manually collected after an extensive review of the literature for each gene (8). This collection of human aging genes includes both genes related to fundamental human aging processes and genes that could impact overall health and lead to human longevity.
To explore aging-specific network characteristics, we systematically studied network properties of aging genes and compared their characteristics with those of other groups of genes as controls. In the protein–protein interaction (PPI) network, we found aging genes tend to have higher degrees than the background (i.e. all protein-coding genes in the network), essential, transcription factor and housekeeping genes (Table 1). Our observation of higher degrees of aging genes is consistent with the result of a previous study in yeast, which showed that highly connected proteins in PPI networks are significantly more likely to be associated with aging (13). In addition, not only aging genes themselves, but also their direct neighbors tend to have higher degrees than background genes (P = 2.773 × 10−161, Wilcoxon rank sum test). Known as hubs, genes with much higher degrees in the network are more important and tend to be of higher biological significance. For example, it was reported that hub genes are more likely to be essential genes (5,14). It has also been found that duplicated genes, which are at least partially redundant in their functions, are more likely to encode highly connected proteins, suggesting that hub genes are often protected by redundancy (6). Research also showed evidence for a correlation between the evolutionary ages of proteins and the number of interactions they participate in (15,16). The age of a protein reflects its evolutionary history and is usually measured by its conservation according to the propensity of the protein to have orthologs across species (16). Such known biological stories behind the hubs would help us better understand the mechanisms of aging. Among the proteins encoded by aging genes, GRB2 and TP53 have the highest degrees. GRB2 is an important adaptor in growth signaling (17); TP53 is a major participant in the DNA damage response and has both pro-aging and anti-aging effects (18). We also found that both the closeness centralities and the betweenness centralities of aging genes are high (Table 1), indicating their central location in the network and the important role that they play in communication between other gene pairs. However, the special properties of aging genes in those network characteristics seem just due to their higher degrees (Table 1, degree-preserved resampling tests). Studies reported that a network bottleneck—a node with high betweenness but low degree—might act as an important link between two groups of nodes (19). As an example, using Subnet (20), we plotted the network neighborhood around ERCC5 (Supplementary Material, Figure S1A), covering its neighbors up to two connection away. It can be seen that the three neighbors of ERCC5 all have high degrees, while there is no direct interaction between them. And there are many aging genes and DNA damage response in this subnetwork. ERCC5 might play a key role in communication between those aging genes and genome maintenance.
Table 1.
Comparisons of network characteristics in PPI network between aging genes and other groups of genes
| Network characteristics | P-valuea and effect sizeb (in parenthesis) of comparison with aging genes | P-valuec of degree-preserved resampling test | ||||
|---|---|---|---|---|---|---|
| BG | ES | TF | HK | Mean | Median | |
| Degree | 4.80 × 10−44 (0.72) | 9.74 × 10⁻²⁰ (0.65) | 5.77 × 10⁻²⁰ (0.66) | 2.81 × 10⁻³² (0.69) | NA | NA |
| Closeness | 2.84 × 10⁻³² (0.72) | 3.22 × 10⁻¹⁶ (0.66) | 1.03 × 10⁻¹⁶ (0.67) | 1.05 × 10⁻²³ (0.69) | 0.396 | 0.193 |
| Betweenness | 3.90 × 10−38 (0.72) | 2.12 × 10⁻¹⁶ (0.65) | 1.46 × 10⁻²⁰ (0.68) | 2.90 × 10⁻²⁷ (0.69) | 0.627 | 0.643 |
| Clustering coefficient | 1.58 × 10⁻¹⁴ (0.57) | 1.70 × 10−05 (0.53) | 2.35 × 10−05 (0.53) | 2.03 × 10⁻¹⁵ (0.58) | 0.005 | 0.00 |
| Length of shortest path | 0.00 (0.62) | 0.00 (0.56) | 0.00 (0.54) | 0.00 (0.58) | 0.00 | NA |
Wilcoxon rank sum test.
Common language effect size (12) was used to show the difference between groups. Briefly, the effect size was calculated by the proportion of the pairs of values that support a hypothesis among all possible pairs of values between the two groups.
See Materials and Methods section for resampling tests.
The median length of shortest path is not sensitive enough to detect the differences between aging genes and random genes, so the result is not shown here.
Alternative hypothesis: aging genes have higher ‘degree’, ‘closeness’, ‘betweenness’, ‘clustering coefficient’ and ‘shorter shortest path’ than other group of genes and random genes with similar degree distribution as aging genes.
BG, background genes; ES, essential genes; TF, transcription factor genes; HK, housekeeping genes.
Although many network characteristics of genes are closely related to their degrees, several network characteristics of aging genes cannot be fully explained by their higher degrees. They indicate possible special underlying molecular mechanisms of aging. First, aging genes tend to have higher clustering coefficients compared with background, essential, transcription factor and housekeeping genes (Table 1 and Supplementary Material, Figure S1B). A weighted local fitting model was used for the regression analysis to show the expected clustering coefficient, given certain degrees for different groups of genes (21). Genes with higher clustering coefficients are more likely to be involved in well-connected modules, which are often functionally related to certain biological processes or pathways. Second, aging genes tend to have shorter shortest paths compared with background, essential, transcription factor and housekeeping genes (Table 1). Third, aging genes are more likely to interact with each other directly (Supplementary Material, Figure S1C and D). These results show strong interactions between aging genes through the network and indicate that aging genes are more likely to collaborate with one another in biological processes to carry out molecular functions. In fact, 192 aging genes form a connected component with 561 direct interactions among them (Supplementary Material, Figure S1E). Mapping of well-known aging-related pathways (22) in this aging interaction network can reveal how these pathways interact with one another. To achieve such information, we collected telomere and longevity pathways from BioCarta (23) and several other aging-related pathways from KEGG (24). Supplementary Material, Figure S1E highlighted aging genes from those aging pathways as well as their interactions. In addition, Figure 1A focuses on three well-known aging pathways, showing more detailed information about how aging-related pathways interact with each other. In the networks, it can be seen that many aging genes play an important role in communication between those pathways. We also found one well-connected aging module (Supplementary Material, Figure S1F) by using the module identification tool Clusterone (25). Half of the genes in the module are associated with the insulin signaling pathway (adjusted P = 5.7 × 10⁻⁶), a central pathway in the regulation of lifespan in various organisms (22).
Figure 1.
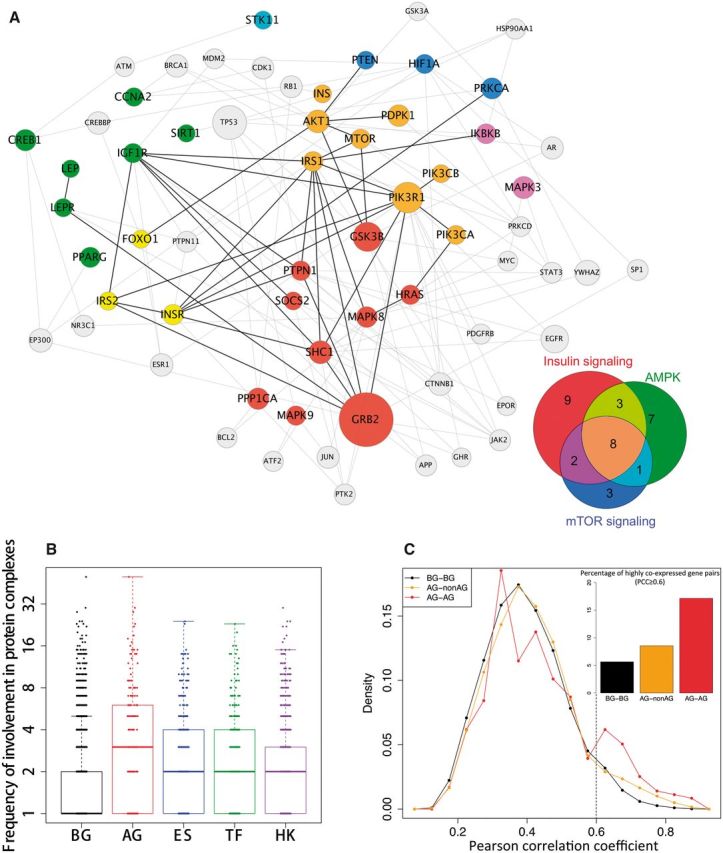
Characteristics of aging genes in biological networks and protein co-complexes. (A) Three well-known aging-related pathways in the aging-related protein interaction subnetwork. A large proportion of aging genes function across the three aging-related pathways. (B) Times of involvement in co-complexes. Aging proteins tend to involve in more co-complexes than background proteins (P = 2.214 × 10⁻¹⁹, Wilcoxon rank sum test), essential proteins (P = 2.703 × 10⁻⁷), transcription factor (P = 8.747 × 10⁻¹¹), and housekeeping proteins (P = 1.267 × 10⁻¹²), indicating a ‘cross talk’ role played by aging genes across different pathways or biological processes. (C) Strength of coexpression between gene pairs. Higher percentage of aging genes tends to strongly co-express with their co-expressed partners, especially for pairs of co-expressed aging gene. BG, background genes; AG, aging genes; ES, essential genes; TF, transcription factor genes; HK, housekeeping genes.
We also analyzed protein co-complexes, which (unlike the binary interactions) give the interactions among proteins that happen at the same time and localization. Aging co-complexes—i.e. co-complexes with at least one aging gene—tend to have larger sizes compared with all co-complexes (P = 3.252 × 10⁻⁴, Wilcoxon rank sum test, Supplementary Material, Figure S2). And the preference for larger co-complexes or modules indicates that genes in aging co-complexes take part in more complex cellular processes (15). Aging genes also tend to participate in more co-complexes compared with all background genes and other groups of genes (Fig. 1B), which indicates that aging genes are more likely to be ‘cross-talk’ genes between different pathways or biological processes. This observation is in agreement with results of previous studies. A study of network modules found that genes connecting different modules through protein interactions are more likely to affect aging or longevity (26). In another study, the analysis of signaling networks showed that the complexity of the aging PPIs is revealed by the cross-talk of aging-related pathways (27). Using gene set enrichment analysis by DAVID (28), we found that highly cross-talk aging genes are particularly related to the regulation of biosynthetic process, metabolic process, and transcription (Supplementary Material, Table S1A). In contrast, aging genes that are involved in only one co-complex are more likely to participate in cell differentiation and the regulation of cell death (Supplementary Material, Table S1B). Moreover, we also found that protein co-complexes enriched with aging genes are mainly related to genome maintenance including DNA replication, DNA repair, DNA metabolic process, DNA recombination and chromatin assembly or disassembly (Supplementary Material, Table S1C).
In addition to protein interaction networks, we also examined the network characteristics of aging genes in gene coexpression networks (Supplementary Materials). Although genes show a few unique network properties in the coexpression networks (e.g. aging genes do not show significantly higher degrees than essential genes in the coexpression network), overall, aging genes show similar network properties in the PPI and coexpression networks (e.g. with higher degrees than background and transcription factor genes, and closer to each other than background, essential and transcription factor genes) (Table 2 and Supplementary Material, Table S2). The similar network properties of aging genes in the coexpression network corroborate their similar properties in the PPI network. More interestingly, we found that aging genes not only have more co-expressed partners but also tend to co-express more strongly with their partners, especially with other aging genes (Fig. 1C). These results indicate that interaction between aging genes and other genes (especially that between aging gene pairs) is required in more tissues and under more conditions than that between non-aging genes.
Table 2.
Comparison of properties of aging genes in the PPI and coexpression networks
| Network characteristic | Compare aging genes with background genes (P-valuea) | |
|---|---|---|
| PPI network | Coexpression network | |
| Degree | 2.293 × 10−44 | 9.042 × 10−06 |
| Closeness | 2.539 × 10⁻³² | 4.722 × 10−08 |
| Betweenness | 2.516 × 10−38 | 1.097 × 10−03 |
| Proportion of aging neighbors | 7.836 × 10−62 | 4.609 × 10⁻²⁶ |
| Shortest paths | 0.00 | 0.00 |
| NDIb | 0.00 (568 interactions) | 0.00 (356 interactions) |
aWilcoxon rank sum test.
bNDI (number of direct interactions) among aging genes. The P-value is calculated by degree-controlled resampling test (repeat 1000 times), while all other P-values were calculated by Wilcoxon rank sum test.
Alternative hypothesis: aging genes tend to have higher degree, higher closeness centrality, higher betweenness centrality, more proportion of aging neighbors, shorter shortest path and more direct interactions compare to that of background genes.
Aging genes tend to be essential
We examined the association between aging genes and other functional groups of genes, which can provide important clues about the molecular mechanisms of aging. We first evaluated how extensively aging genes share genes with other functional groups by Fisher’s exact test. With all protein-coding genes as the background, aging genes showed the strongest association with essential genes and, to a slightly less extent, with transcription factor genes, while the association between aging genes and housekeeping genes is less strong (Table 3). In fact, if we use the genes in the PPI network [i.e. high-quality interactomes (HINT) (29)] as the background, no association was found between aging and housekeeping genes (Supplementary Material, Table S3). Our finding is consistent with previous studies, which showed that aging or longevity-associated genes are enriched with essential genes or genes required for development, and essential genes were equally enriched for longevity-associated genes (8,30–34).
Table 3.
Association study between aging genes with other group of genes by Fisher’s exact test
| AG | Non-AG | Row total | |
|---|---|---|---|
| (A) Association between aging and essential genes (P = 2.531 × 10⁻²⁴) | |||
| ES | 81 | 1404 | 1485 |
| Non-ES | 217 | 17 479 | 17 696 |
| Column total | 298 | 18 883 | 19 181a |
| (B) Association between aging and TF genes (P = 1.256 × 10⁻¹²) | |||
| TF | 56 | 1222 | 1278 |
| Non-TF | 242 | 17 661 | 17 903 |
| Column total | 298 | 18 883 | 19 181a |
| (C) Association between aging and housekeeping genes (P = 7.756 × 10−04) | |||
| HK | 82 | 3721 | 3 803 |
| Non-HK | 216 | 15 162 | 15 378 |
| Column total | 298 | 18 883 | 19 181a |
aProtein-coding genes were used as background genes.
In addition to the association analysis, which measures how two gene sets share members, we also studied the interactions between aging genes and other groups of genes in a biological network. We found essential genes are highly enriched in the neighborhood of aging genes (to remove bias, essential aging genes were excluded from the analysis) in the PPI and coexpression networks and in the aging co-complexes, compared with that in the neighborhood of background genes (Fig. 2). In the PPI network, aging genes have an even higher proportion of essential genes as their neighbors than essential genes themselves (P = 9.318 × 10⁻⁴, Wilcoxon rank sum test). In contrast, there is no enrichment of housekeeping genes in the neighborhood of aging genes in the networks or in the aging co-complexes (Supplementary Material, Figures S3A–C). Transcription factor genes are enriched in aging co-complexes (Supplementary Material, Figure S3E) but only slightly enriched in the neighborhood of aging genes in the PPI network (Supplementary Material, Figure S3D), and no enrichment was detected in the neighborhood of aging genes in the coexpression network (Supplementary Material, Figure S3F).
Figure 2.

Network association between aging and essential genes. (A) Association in the PPI network. Also shown are regression lines based on a weighted local fitting model (20) using log2(the number of neighbors + 1). Only non-essential aging genes are included in this analysis. Essential genes are more enriched in the neighborhood of aging genes than in the neighborhood of background genes (P = 2.231 × 10⁻¹¹, Wilcoxon rank sum test) or even essential genes themselves (P = 9.318 × 10⁻⁴). (B) Association in protein co-complexes. Due to their enrichment for essential genes, aging genes were not included in the calculation of the proportion of essential genes in the co-complexes. Essential genes are enriched in the aging co-complexes compare to that in all co-complexes (P = 6.405 × 10⁻³). (C) Association in the coexpression network. Only non-essential aging genes are included in the analysis. Aging genes are more likely to co-express with essential genes (P = 4.848 × 10⁻¹²). BG, background genes; AG, aging genes; ES, essential genes.
Aging subnetworks are vulnerable to random attacks
The effect of a deleterious mutation may not be limited to the activity of the gene carrying it, but can spread thought the network along the links between genes, and then alter activities of intact neighboring genes (35). Thus, the network vulnerability can be measured by how easily such deleterious effects can spread through the network. A previous analysis of interactions in both PPI and gene regulatory networks showed that interactions between network hubs are systematically suppressed, whereas those between hubs and non-hubs are favored (36). The suppression of interactions among hubs decreases the likelihood of crosstalk between different functional modules of the cell and increases the overall robustness of a network by localizing effects of deleterious perturbations. In our study, as expected, we observed the same network interaction profile among background genes (Fig. 3A). However, the interaction pattern among aging genes is strikingly different—compared with the expectation from random networks, they are enriched with interactions among aging hubs (genes with degree ≥32, Fig. 3B). In contrast, the interactions among essential and housekeeping hubs are suppressed (Supplementary Material, Figure S4A).
Figure 3.

Network profiles of protein interaction across species. (A) The interaction pattern among all human genes. We compared the frequencies of interactions among genes in the PPI network with those in 1000 randomized networks (rewired with the overall network topology unchanged, see Materials and Methods section). The heatmap is based on the Z-scores. For any two groups of genes, Z-score = (n–µ)/σ, in which n is the number of interactions in the PPI network, µ and σ the mean and the SD of the numbers of interactions in randomized networks. The heatmap shows that the interactions among hubs (i.e. genes with degree ≥ 32) are suppressed, while interactions between hubs and low-degree genes are favored. (B) The interaction pattern among human aging genes. When compared with all genes, interactions among aging genes are favored, and the contrast especially striking for aging hubs. (C) Z-scores of hub genes in the PPI networks of different species.
The network vulnerability is also related to the stability of the network in maintaining its connectivity (37), which measures how quickly the network is fragmented if we start to remove its nodes. In vivo, such node removal can be caused by loss-of-function mutations in the protein-coding sequences or protein impairment. Both germline and somatic mutations can affect the network stability. However, due to the accumulative effect, somatic mutations are likely to be more relevant in this process. Damage to the network topology can lead to diseases. Our simulation results show that the aging subnetwork will become less fragmented—and thus more robust against removal of genes—after we decreased the number of interactions among aging hubs and instead increased the interactions between aging hubs and genes with low degrees (Supplementary Material, Figure S5).
The enrichment of interactions among aging hubs, together with preferences of interactions among aging genes, facilitates the propagation of damaging effects in the aging subnetwork. Our protein co-complex analysis indicates that aging genes tend to be intermediaries for crosstalk (Fig. 1B), which could also decrease the robustness of the network by increasing the chance of deleterious effects spreading across different functional modules or pathways. Among the 48 aging hubs, 47 of them (except for CACNA1A) form a fully connected subnetwork by direct interactions among them (Fig. 4A). Well known to be involved in many types of cancer (24), TP53 interacts with most (∼40%) of other aging hubs. Its network topology may explain its involvement in diverse complex diseases. After mapping the hub genes into aging-related pathways, we can see that most of the 48 aging hubs tend to be involved in multiple aging-related pathways (Fig. 4B), either with direct membership (e.g. AKT1, PIK3R1 and PDPK1) or through their network neighbors (e.g. ERBB2, BRCA1 and ESR1), indicating their important roles in communication between those aging-related pathways (Figure 4C). The enrichment of interactions among aging genes, including aging hubs, could be required in aging-related biological process, because aging genes need frequently to collaborate with one another and some aging genes function across many aging-related pathways. The topology of aging subnetworks accommodates such functions. However, the specific topology of aging subnetworks also increases the chances of spread of deleterious effects through the network, which will become more serious as mutations accumulate with age. And the wide spread of deleterious effect through the aging network may lead to the complexity of most age-related diseases.
Figure 4.

Aging hubs and aging pathways. (A) Subnetwork of interactions among aging hubs. The size of a node is proportional to the number of its interacting neighbors. (B) Involvement of aging hubs in known aging-related pathways. For each aging hub, we examined whether it is directly involved or interacts with a gene in a particular aging-related pathway. Shown in the figure are also numbers of direct interaction partners of most indirectly involved aging hubs for each pathway. (C) Numbers of aging hubs directly and indirectly involved in aging pathways.
To see whether the enrichment of interactions among human aging hubs is a conserved feature of protein interaction networks, we also analyzed the interaction patterns of aging and/or longevity-associated genes from three model organisms—yeast (Saccharomyces cerevisiae), worm (Caenorhabditis elegans) and fly (Drosophila melanogaster) (GenAge build 17)—in their corresponding high quality PPI networks from HINT (29). We found that the interactions among aging hubs are highly suppressed in yeast, while the suppression is much weaker in worms (Supplementary Material Figure S4B). And there is no suppression among aging hubs in flies (Supplementary Material, Figure S4B). The interaction patterns among human aging genes and aging (and/or longevity) genes from the three model organisms reveal the evolutionary process of the aging subnetwork (Fig. 3C). As the organisms become more complex, aging genes, including aging hubs, are more functionally connected, and different aging pathways are more intertwined through cross-talks—i.e. the complexity of aging mechanisms increases.
Aging genes are highly expressed across diverse tissue types
As systems-wide properties, the network characteristics are not tissue-specific. To determine the tissue specificity of the functional activity of aging genes, we analyzed their expression profiles across 32 different tissues (38). When compared with other functional groups of genes, aging genes on average have the second highest expression levels after housekeeping genes (Fig. 5A), and relatively more of them (∼68%) are transcriptionally active in all 32 tissues. Relatively fewer aging genes (∼21%) show elevated (i.e. tissue-enriched, tissue-enhanced or group-enriched) expression levels in specific tissues (Fig. 5B). Our examination of different sets of aging genes with elevated expression in each tissue (Supplementary Material, Figure S6A) revealed their participation in tissue-specific functions. For example, in brain such aging genes are mostly associated with neurogenesis, and in placenta they are related to enzyme linked receptor protein signaling pathways and bone development (Supplementary Material, Table S4). Because the amount of transcripts and their corresponding proteins are tightly correlated (38–40), the generally high expression levels of aging genes indicate that the physical interactions—and thus functional collaborations—involving aging proteins could be more stable across different tissues, which may underlie the strong coexpression among aging genes.
Figure 5.

Expression profiles of gene sets across 32 human tissues. (A) Gene expression levels across 32 tissues. Gene expression was measured in FPKM (plus a pseudo count of 0.25). The tissues are ordered according to the median express levels of aging genes. Although aging genes have lower expression levels than housekeeping genes, they tend to have statistically significant higher expression levels than background (i.e. protein coding genes), essential, and transcription factor genes across all 32 tissues (P < 0.05 in all tissues by Wilcoxon rank sum test). (B) Composition of genes categories with different tissue specificity in each gene set. (C) Gene expression and the distance to aging genes in the PPI network (showing the mean and one standard deviation). Log2-transformed FPKM (plus a pseudo count of 0.25) values were used in this analysis. Here, background genes are all the genes in the PPI network; AG-1 are direct neighbors of aging genes; AG-2, genes two steps away from the aging genes; AG-3, genes three steps away from aging genes; AG-4+, genes four and more steps away from the aging genes. As their distance to aging genes increases, genes tend to have lower average expression levels across tissues (P < 0.01, Wilcoxon rank sum test). BG, background genes; AG, aging genes; ES, essential genes; TF, transcription factor genes; HK, housekeeping genes.
We found that the neighbors of aging proteins in the PPI network also tend to have higher expression levels than background genes in each of the 32 tissues (Pmax < 0.05, Wilcoxon rank sum tests). And the farther the proteins are from aging proteins in the PPI network, the lower expression level their corresponding genes tend to have (Fig. 5C). This observation indicates that the interactions closer to aging proteins tend to be more stable across different tissues, compared with those farther away. The PPI subnetwork around aging proteins could play a critical role in cellular maintenance and survival, which are necessary for most tissues. Moreover, we also noticed that aging genes with elevated expression in specific tissues tend to have lower degrees in the PPI network (P = 7.766 × 10⁻⁵, Wilcoxon rank sum test) compared with the aging genes expressed in all tissues (Supplementary Material, Figure S6B). Using the age of proteins from ‘ProteinHistorian’ (41), which assigned a phylogenetic age to each protein of a species, we also found that the former group of aging genes tend to be younger (P = 6.187 × 10⁻⁷, Wilcoxon rank sum test) than the latter group (Supplementary Material, Figure S6C), indicating their different evolution histories.
Longevity-associated human aging genes show unique expression profiles
Using longevity association of genes from LongevityMap (Build 2) (42), a manually curated database that catalogs human longevity-associated genes, loci and variants, we divided human aging genes into two general categories: genes associated with human longevity and genes associated with mechanisms of aging (see Supplementary Materials, for details). Exploring unique properties of each category of aging genes can provide insight into mechanisms of aging and longevity.
In general, very similar network properties were found for the two categories of human aging genes, indicating those aging genes occupy similar network neighborhoods and may even function in a similar manner (Supplementary Material, Table S5, see Supplementary Materials for details). However, compared with human aging mechanisms-associated genes, human longevity-associated genes tend to have less co-expressed partners (P = 4.307 × 10⁻³) with weaker coexpression correlations (Supplementary Material, Figure S7A). And they are more likely to be tissue-specific (with elevated expression level in one or a few tissues, Supplementary Material, Figure S7B), in agreement with the much lower overlap between them and housekeeping genes (13.6 versus 31% between aging mechanisms-associated genes and housekeeping genes). Together these results indicate that regulation of gene expression could be an important factor for human longevity. Moreover, human longevity-associated genes tend to have lower expression levels (in 14 tissues) compared with the human aging mechanisms-associated genes (Supplementary Material, Figure S7C). More studies are needed to determine whether this is an evolutionary outcome towards increased health and longevity. Finally, longevity-associated genes tend to be marginally younger than the aging mechanisms-associated genes (P = 0.06, Wilcoxon rank sum test) according to the estimated phylogenetic age of their encoded proteins from ProteinHistorian (41).
Discussion
Well connected with much higher degrees in the central part of the biological networks, aging genes form a subnetwork that becomes an important backbone of the whole network. Evolutionary restraints on aging genes are a natural consequence of their central importance in biological networks. A previous study has shown that aging genes are under purifying selection and subject to stronger functional constraints than average (43). On the other hand, highly enriched physical interactions among aging genes lead to their strong coevolution, since it was found that physically interacting proteins tend to be more strongly coevolving than proteins belonging to the same pathway (44). Indeed, previous studies have shown that aging genes and aging processes are conserved across species deep into evolutionary time (9,45). Our study shows that human aging genes are expressed in more tissues with higher expression levels, indicating stable physical interactions among aging genes across different tissues. Moreover, aging genes tend to be strongly co-expressed with their partners, especially with other aging genes. This gene expression pattern indicates that gene–gene interactions across tissues are more frequent for aging genes than non-aging genes. Previous studies revealed increased variation of gene expression in both single cells (46) and at coarse tissue resolution during mammalian aging (47,48) and decreased correlation of gene expression within genetic modules of old mice (49). So the strong coexpression between aging genes could indicate a stronger evolutionary constraint on their gene expression. More interestingly, we found that not only aging genes themselves, but also their neighbors in the PPI network tend to have higher average expression levels across the 32 tissues. And the farther the proteins from aging proteins in the PPI network, the lower expression level the corresponding gene tends to have. This indicates that the subnetworks around aging genes are more stable across different tissues. Aging genes with relatively stable expression across all 32 tissues tend to be evolutionarily older than those with tissue-specific expression. Previous studies have shown that broadly expressed genes (i.e. genes expressed in many tissues) tend to evolve with a slower rate than tissue-specific genes (50,51). Other studies also showed that older genes tend to evolve slower and be subject to stronger purifying selection than younger genes (52). And, thus, because the former group of aging genes has longer evolutionary history and evolve slowly, they are more conserved across species. In other words, the aging process is not only conserved across species, it also shows common underlying mechanisms across tissues.
Biological networks have been widely used for disease studies (35). Because conserved aging pathways show simultaneous influence on multiple age-related diseases (53), it is important to consider the relationship between aging genes and disease genes to fully understand the mechanisms of age-related diseases (10). Our analysis shows that certain network properties of aging genes are informative about the relationship between aging and age-related complex diseases. Although biological networks are robust to random attacks due to their scale-free topology, they are vulnerable to attacks targeting hubs, e.g. most aging genes. And studies have already shown that disease genes are more likely to be hubs (15,54). Moreover, we found that the aging subnetwork is vulnerable to random attacks on its proteins, which can be caused by erratic genomic mutations or protein impairment. Two network aspects of aging genes underlie this vulnerability. First, unlike in most biological networks, hubs in the aging subnetwork are also highly connected to one another. This unusual topology of the aging subnetwork reduces its power to localize the deleterious effect on genes near the hubs. Second, aging genes tend to function as the intermediaries for cross talks between different functional modules, regulating different biological processes and functions through the network. The effect of genetic perturbation is not restricted to genes carrying mutations, but can spread through the network and impact the activity of genes with no defects (35). Close functional connection among aging genes in biological processes, suggested by their stronger physical interaction and higher coexpression, makes it easy for damaging effects of deleterious perturbations to propagate throughout the network. Deleterious perturbations to the aging subnetwork are not limited to mutations directly affecting genes. They also include unrepaired or misrepaired DNA damage (e.g. breaks and adducts) and protein impairment (e.g. oxidative damage and aggregates). Inflammation and environmental processes that affect certain genes or their products can also provide deleterious perturbations to the network.
Our simulation results suggest that the enrichment of interactions among aging hubs also makes the human aging subnetwork more prone to fragmentation due to removal of genes from the network through loss-of-function mutations. Although several aging pathways show conservation among species, aging subnetwork show a different interaction profile, indicating different evolution processes from low-level organisms to humans. The enrichment of interactions among human aging hubs reflects the higher complexity of aging mechanisms in humans than those in lower-level organisms. Because the human aging subnetwork is vulnerable to random attacks, there must be mechanisms to protect it from such attacks. Several studies have found that highly expressed genes and hub genes tend to be more conserved with slower evolution rate (55). The higher expression levels of aging genes and their neighbors in the PPI network indicate low mutation rates in aging genes and their neighbors, which decrease the chances of damaging perturbations to aging-aging subnetwork. However, as age increases, somatic mutations will accumulate and their damaging effects will spread out easily in the aging subnetwork, which will often lead to age-related diseases. But further studies are required to find out how the topology of the aging subnetwork influences the effects of beneficial mutations (e.g. longevity-associated germ line mutations). We hypothesize that the lower incidence of age-related diseases in centenarians (56–58) most likely indicates a lower rate of damaging somatic mutations in aging genes or their network neighbors.
The origin of aging has been an enduring mystery in biology. Several different theories have been proposed to explain the fundamental molecular mechanism underlying this complex biological process. Network-based analysis of aging genes on the systems level could shed new light on this topic. We found that aging genes tend to be essential and interact with other essential genes through the PPI and coexpression networks. The strong association between aging genes and essential genes testifies to the involvement of essential genes in the aging process. Several previous studies also made similar observations. For example, although some essential genes are absolutely required throughout the whole life span, it was found that turning off many others in adulthood can lead to a longevity state (31). Moreover, several other studies also found the continued activity of essential genes in adulthood might contribute to the aging process (59,60). A network-based study revealed three large functional clusters among human aging genes, including a cluster of growth and development genes (8). Such observations suggest that aging is caused by hyper-function of developmental processes controlled by essential and developmental genes during adulthood (2,61,62). Although there are still debates between the hyperactivity theory and the molecular damage accumulation theory of aging, the strong association between aging and essential genes does indicate that essential genes are part of the aging process.
Regulation of gene expression has been found to be associated with longevity (63,64). More varied expression levels of human longevity-associated genes under different conditions could indicate more complex and elaborate regulatory mechanisms of their expression. The cost will be lower for cells to adjust the expression of human longevity-associated genes for higher fitness, due to the low expression correlation between them and other genes. Moreover, because of the strong influence of gene expression on the evolutionary rate of genes (55), lower expression of human longevity-associated genes may indicate their relatively higher evolutionary rates compared with those of the aging mechanisms-associated genes.
Publication bias could be present in biological networks containing data sourced from literature. To tackle this problem, we used several different approaches to minimize the potential bias and also carried out validation of our observations (see Supplementary Materials, for details). In summary, the safeguard measures that we took include the following: (i) We chose a reliable protein interaction network that have been vigorously tested for our analysis and verified the special network properties of aging genes in a network of interactions only obtained from high-throughput assays (Supplementary Material, Table S6); (ii) We used both background genes and other functional groups of genes as the reference gene sets in our study of aging genes in networks; (iii) We observed similar network properties of aging genes in different types of biological networks, a mutually corroborating result; (iv) We incorporated protein structure information in our network analysis of aging genes, because protein interactions are determined by their structures. Our analysis shows that the structure properties of aging genes supports their network characteristics (Supplementary Material, Figure S8), which can be regarded as a disproval of any serious publication bias in the protein interaction network. Although there may be potential sources of bias in the networks, network-based analysis is considered as a promising way to study complex traits, like aging. This study is motivated by this trend and makes full use of the achievement of aging study and improvement of biological networks. With the rapid development of high-throughput techniques, network-based analysis will play more and more important roles to explore the mechanisms of aging and other complex traits in the near future.
Materials and Methods
Aging genes and other functional groups of genes
In this study, we analyzed four human gene sets, focusing on aging genes (Supplementary Material, Table S7A). (i) 298 aging genes from GenAge (build 17) (11). (ii) 1485 essential genes. We used the human orthologs of mouse essential genes in our study. We first determined mouse essential genes by using Mouse Genome Informatics to find mouse genes whose deletions result in prenatal, perinatal, or postnatal lethality. We then identified their human orthologs. A recent study of mouse essential genes found that their human orthologs are under strong purifying selection and perform expected essential functions in human (65). (iii) 3803 housekeeping genes (66). (iv) 1278 transcription factor genes from the Panther database (67). In addition, we also used 19181 human protein-coding genes from the GENCODE annotation (version 18) as the background in our statistical analysis. In addition to human aging genes, we also collected aging and/or longevity-associated genes in model organisms from GenAge (GenAge, build 17) (11) for comparisons among species (Supplementary Material, Table S7B).
PPIs and protein co-complexes
The PPI network from HINT (29) was used as the background network in our study. It was compiled from different data sources and then filtered both systematically and manually to remove erroneous and low-quality interactions. Only the largest component of the network was considered for the network characteristics analysis (Supplementary Material, Table S8). We used protein co-complexes from CHPC2012, which integrated three different databases (68). Supplementary Table S9 summarizes the number of genes from each functional group that involve in co-complexes.
Protein domain analysis
Using high-quality protein domains from Pfam-A (version 27.0) (69) (Supplementary Material, Table S10), we analyzed the number of domain types that each protein has, as physical interactions among proteins depend on the types of domains that they have. We used the domain–domain interaction data from iPfam 1.0 (70) to check whether the domains included in aging proteins tend to have more interacting partners compared with the domains included in all background proteins. Given a particular protein, each type of its domains will be considered only once, even if some domain types occur several times in this protein. However, because certain domain types may be enriched in aging proteins (i.e. occur in multiple aging proteins), we retained the redundancy of domains from different proteins.
Gene coexpression analysis
To analyze how human genes are expressed together, we used the gene coexpression data set Hsa2.c2-0 from COXPRESdb (71). It was based on 12,640 gene chips across different tissues and conditions. So the network shows a general coexpression relationship among genes, which is not tissue or condition specific. COXPRESdb uses a rank-based method to measure correlation of gene expression (72). In our study, we first set a threshold for the mutual rank and only chose the co-expressed gene pairs with the mutual rank equal to or less than this threshold. After constructing the gene coexpression network, we extracted the subnetworks consisting of protein coding genes. And only the largest component of the subnetwork was used in our analysis (Supplementary Material, Table S11A). Based on the suggestion given by the authors of COXPRESdb (personal communication), we used both 100, a normal threshold, and 30, a stringent one, for the mutual rank to construct the coexpression network. Here, we only show the results using 100 as the network threshold, since different thresholds would not change our conclusions.
Tissue-specific gene expression analysis
We studied the tissue specificity of gene expression among the four sets of genes that we analyzed, using a gene expression data set generated with tissue samples of 122 human individuals representing 32 different tissues (38). Genes were divided into the following six groups according to their expression patterns across tissues (38): (i) Not detected: fragments per kilobase of exon per million fragments mapped (FPKM) <1 in all tissues; (ii) Expressed in all tissues: FPKM > 1 in all tissues and show relatively constant expression levels across tissues; (iii) Tissue enriched: at least 5-fold higher FPKM level in one tissue compare to all others; (iv) Group enriched: 5-fold higher average FPKM in two to seven tissues compared with all others; (v) Tissue enhanced: at least 5-fold higher FPKM in one tissue compared with the average in all others; and (vi) Mixed: the remaining genes. Based on the annotation of these categories, we systematically compared the differences among different gene sets.
Degree-preserved resampling test
The significance of the observed values of a network characteristic for a group of genes can be assessed by comparing their central tendency—i.e. mean or median—with the permutation-generated null distribution. We used degree-preserved resampling to evaluate the dependency of a network characteristic of a group of genes on their degree distribution. To generate the degree-preserved null distribution, we first randomly select from the network a group of genes, which are of the same number and have a similar degree distribution as the analyzed genes. We then calculate the central tendency of the characteristic for the random genes. Many iterations of this resampling procedure generate the degree-preserved null distribution of the characteristic for resampled genes.
Randomization of the background network
We randomize the background network by randomly rewiring interactions among genes in it (36). Each time, we arbitrarily select two interactions (e.g. and and then swap the two interactions and generate two new interactions ( and ) if the two new interactions do not exist in the original network and they are not auto-interactions. In this study, to generate such random networks we rewired the original network as many times as the number of interactions in it.
Robustness analysis of the aging subnetwork
To evaluate the robustness of the networks, we measured the number of disjoint components and also the size of the components after randomly removing a certain number of genes from the networks (73). A smaller number of components and a bigger component size indicate the network is more robust against removal of genes from the network. Using this approach, we evaluated the robustness of the aging subnetwork, which is enriched with interactions among hubs, against removal of genes from the network. In comparison, we also evaluated the robustness of simulated networks that contain the same number of nodes and edges and have much less interactions among hubs but instead more interactions between hubs and non-hubs—i.e. like the 'background' biological network as we expect (36). To generate such networks, we first randomly selected an interaction between aging hubs (e.g. AB) and another interaction between non-hubs (e.g. CD). The lower the degrees of a pair of interacting non-hubs the higher chance to select the interaction between them. We then swapped the two interactions to generate two new interactions (AD and BC) if the two new interactions do not exist in the original network and they are not auto-interactions. By repeating this procedure a large number of times, we obtained a random network that resembles the network background. When compared with the original network, it has fewer interactions among hubs and more interactions between hubs and non-hubs.
Supplementary Material
Supplementary Material is available at HMG online.
Supplementary Material
Acknowledgements
We thank Drs. João Pedro de Magalhães and Simon C. Johnson for helpful suggestions.
Conflict of Interest statement. None declared.
Funding
This work was supported by the Ellison Medical Foundation New Scholar in Aging Award (AG-NS-0751-11) to Z.D.Z.
References
- 1.Vijg J. (2007) Aging of the Genome. Oxford, New York. [Google Scholar]
- 2.Blagosklonny M.V. (2012) Answering the ultimate question “What is the Proximal Cause of. Aging?” Aging-Us, 4, 861–877. [DOI] [PMC free article] [PubMed] [Google Scholar]
- 3.David D.C., Ollikainen N., Trinidad J.C., Cary M.P., Burlingame A.L., Kenyon C. (2010) Widespread protein aggregation as an inherent part of aging in C. elegans. PLoS Biol, 8, e1000450.. [DOI] [PMC free article] [PubMed] [Google Scholar]
- 4.Soltow Q.A., Jones D.P., Promislow D.E.L. (2010) A Network Perspective on Metabolism and Aging. Integr. Comp. Biol., 50, 844–854. [DOI] [PMC free article] [PubMed] [Google Scholar]
- 5.Jeong H., Mason S.P., Barabasi A.L., Oltvai Z.N. (2001) Lethality and centrality in protein networks. Nature, 411, 41–42. [DOI] [PubMed] [Google Scholar]
- 6.Kafri R., Dahan O., Levy J., Pilpel Y. (2008) Preferential protection of protein interaction network hubs in yeast: Evolved functionality of genetic redundancy. Proc. Natl. Acad. Sci. USA, 105, 1243–1248. [DOI] [PMC free article] [PubMed] [Google Scholar]
- 7.Ideker T., Sharan R. (2008) Protein networks in disease. Genome Res., 18, 644–652. [DOI] [PMC free article] [PubMed] [Google Scholar]
- 8.de Magalhaes J.P., Toussaint O. (2004) GenAge: a genomic and proteomic network map of human ageing. FEBS Lett., 571, 243–247. [DOI] [PubMed] [Google Scholar]
- 9.Bell R., Hubbard A., Chettier R., Chen D., Miller J.P., Kapahi P., Tarnopolsky M., Sahasrabuhde S., Melov S., Hughes R.E. (2009) A Human Protein Interaction Network Shows Conservation of Aging Processes between Human and Invertebrate Species. Plos Genet., 5, e1000414. [DOI] [PMC free article] [PubMed] [Google Scholar]
- 10.Wang J.G., Zhang S.H., Wang Y., Chen L.N., Zhang X.S. (2009) Disease-aging network reveals significant roles of aging genes in connecting genetic diseases. Plos Comput. Biol., 5, e1000521. [DOI] [PMC free article] [PubMed] [Google Scholar]
- 11.Tacutu R., Craig T., Budovsky A., Wuttke D., Lehmann G., Taranukha D., Costa J., Fraifeld V.E., de Magalhaes J.P. (2013) Human Ageing Genomic Resources: Integrated databases and tools for the biology and genetics of ageing. Nucleic Acids Res., 41, D1027–D1033. [DOI] [PMC free article] [PubMed] [Google Scholar]
- 12.Mcgraw K.O., Wong S.P. (1992) A common language effect size statistic. Psychol Bull., 111, 361–365. [Google Scholar]
- 13.Promislow D.E.L. (2004) Protein networks, pleiotropy and the evolution of senescence. Proc. R. Soc. B. Biol. Sci., 271, 1225–1234. [DOI] [PMC free article] [PubMed] [Google Scholar]
- 14.Zotenko E., Mestre J., O'Leary D.P., Przytycka T.M. (2008) Why do hubs in the yeast protein interaction network tend to be essential: reexamining the connection between the network topology and essentiality. Plos Comput. Biol., 4, e1000140 [DOI] [PMC free article] [PubMed] [Google Scholar]
- 15.Jonsson P.F., Bates P.A. (2006) Global topological features of cancer proteins in the human interactome. Bioinformatics, 22, 2291–2297. [DOI] [PMC free article] [PubMed] [Google Scholar]
- 16.Wuchty S. (2004) Evolution and topology in the yeast protein interaction network. Genome Res., 14, 1310–1314. [DOI] [PMC free article] [PubMed] [Google Scholar]
- 17.Simko G.I., Gyurko D., Veres D.V., Nanasi T., Csermely P. (2009) Network strategies to understand the aging process and help age-related drug design. Genome Med., 1, 90. [DOI] [PMC free article] [PubMed] [Google Scholar]
- 18.Matheu A., Maraver A., Serrano M. (2008) The Arf/p53 pathway in cancer and aging. Cancer Res., 68, 6031–6034. [DOI] [PubMed] [Google Scholar]
- 19.Joy M.P., Brock A., Ingber D.E., Huang S. (2005) High-betweenness proteins in the yeast protein interaction network. J. Biomed. Biotechnol., 2005, 96–103. [DOI] [PMC free article] [PubMed] [Google Scholar]
- 20.Lemetre C., Zhang Q.W., Zhang Z.D.D. (2013) SubNet: a Java application for subnetwork extraction. Bioinformatics, 29, 2509–2511. [DOI] [PMC free article] [PubMed] [Google Scholar]
- 21.Cleveland W.S., Devlin S.J. (1988) Locally-weighted regression: an approach to regression analysis by local fitting. J. Am. Stat. Assoc., 83, 596–610. [Google Scholar]
- 22.Kenyon C.J. (2010) The genetics of ageing. Nature, 464, 504–512. [DOI] [PubMed] [Google Scholar]
- 23.Nishimura D. (2001) BioCarta. Biotech Softw. Intern. Rep., 2, 117–120. [Google Scholar]
- 24.Kanehisa M., Goto S. (2000) KEGG: kyoto encyclopedia of genes and genomes. Nucleic Acids Res., 28, 27–30. [DOI] [PMC free article] [PubMed] [Google Scholar]
- 25.Nepusz T., Yu H.Y., Paccanaro A. (2012) Detecting overlapping protein complexes in protein-protein interaction networks. Nat. Methods, 9, 471. [DOI] [PMC free article] [PubMed] [Google Scholar]
- 26.Xue H.L., Xian B., Dong D., Xia K., Zhu S.S., Zhang Z., Hou L., Zhang Q.P., Zhang Y., Han J.D.J. (2007) A modular network model of aging. Mol. Syst. Biol., 3, 147. [DOI] [PMC free article] [PubMed] [Google Scholar]
- 27.Greer E.L., Brunet A. (2008) Signaling networks in aging. J. Cell. Sci., 121, 407–412. [DOI] [PubMed] [Google Scholar]
- 28.Huang D.W., Sherman B.T., Lempicki R.A. (2009) Systematic and integrative analysis of large gene lists using DAVID bioinformatics resources. Nat. Protoc., 4, 44–57. [DOI] [PubMed] [Google Scholar]
- 29.Das J., Yu H.Y. (2012) HINT: high-quality protein interactomes and their applications in understanding human disease. Bmc Syst. Biol., 6, 92. [DOI] [PMC free article] [PubMed] [Google Scholar]
- 30.Budovsky A., Tacutu R., Yanai H., Abramovich A., Wolfson M., Fraifeld V. (2009) Common gene signature of cancer and longevity. Mech. Ageing Dev., 130, 33–39. [DOI] [PubMed] [Google Scholar]
- 31.Curran S.P., Ruvkun G. (2007) Lifespan regulation by evolutionarily conserved genes essential for viability. Plos Genet., 3, e56. [DOI] [PMC free article] [PubMed] [Google Scholar]
- 32.Tacutu R., Budovsky A., Wolfson M., Fraifeld V.E. (2010) MicroRNA-regulated protein-protein interaction networks: how could they help in searching for pro-longevity targets? Rejuv. Res., 13, 373–377. [DOI] [PubMed] [Google Scholar]
- 33.Tacutu R., Budovsky A., Yanai H., Fraifeld V.E. (2011) Molecular links between cellular senescence, longevity and age-related diseases - a systems biology perspective. Aging-Us, 3, 1178–1191. [DOI] [PMC free article] [PubMed] [Google Scholar]
- 34.Tacutu R., Shore D.E., Budovsky A., de Magalhaes J.P., Ruvkun G., Fraifeld V.E., Curran S.P. (2012) Prediction of C. elegans longevity genes by human and worm longevity networks. Plos One, 7, e48282.. [DOI] [PMC free article] [PubMed] [Google Scholar]
- 35.Barabasi A.L., Gulbahce N., Loscalzo J. (2011) Network medicine: a network-based approach to human disease. Nat. Rev. Genet., 12, 56–68. [DOI] [PMC free article] [PubMed] [Google Scholar]
- 36.Maslov S., Sneppen K. (2002) Specificity and stability in topology of protein networks. Science, 296, 910–913. [DOI] [PubMed] [Google Scholar]
- 37.Melián C.J., Bascompte J. (2002) Complex network: two ways to be robust? Ecol. Lett., 5, 705–708. [Google Scholar]
- 38.Uhlen M., Fagerberg L., Hallstrom B.M., Lindskog C., Oksvold P., Mardinoglu A., Sivertsson A., Kampf C., Sjostedt E., Asplund A. et al. (2015) Tissue-based map of the human proteome. Science, 347, 1260419. [DOI] [PubMed] [Google Scholar]
- 39.Lundberg E., Fagerberg L., Klevebring D., Matic I., Geiger T., Cox J., Algenas C., Lundeberg J., Mann M., Uhlen M. (2010) Defining the transcriptome and proteome in three functionally different human cell lines. Mol. Syst. Biol., 6, 450. [DOI] [PMC free article] [PubMed] [Google Scholar]
- 40.Wilhelm M., Schlegl J., Hahne H., Gholami A.M., Lieberenz M., Savitski M.M., Ziegler E., Butzmann L., Gessulat S., Marx H, et al. (2014) Mass-spectrometry-based draft of the human proteome. Nature, 509, 582.. [DOI] [PubMed] [Google Scholar]
- 41.Capra J.A., Williams A.G., Pollard K.S. (2012) ProteinHistorian: tools for the comparative analysis of eukaryote protein origin. Plos Comput. Biol., 8, e1002567.. [DOI] [PMC free article] [PubMed] [Google Scholar]
- 42.Budovsky A., Craig T., Wang J., Tacutu R., Csordas A., Lourenco J., Fraifeld V.E., de Magalhaes J.P. (2013) LongevityMap: a database of human genetic variants associated with longevity. Trends Genet., 29, 559–560. [DOI] [PubMed] [Google Scholar]
- 43.de Magalhaes J.P., Church G.M. (2007) Analyses of human-chimpanzee orthologous gene pairs to explore evolutionary hypotheses of aging. Mech. Ageing Dev., 128, 355–364. [DOI] [PMC free article] [PubMed] [Google Scholar]
- 44.Tillier E.R., Charlebois R.L. (2009) The human protein coevolution network. Genome Res., 19, 1861–1871. [DOI] [PMC free article] [PubMed] [Google Scholar]
- 45.McCormick M.A., Promislow D.E.L. (2014) Networks in the biology of aging: powerful tools for a complex process. Annu. Rev. Gerontol. Geriatr., 34, 243–266. [Google Scholar]
- 46.Bahar R., Hartmann C.H., Rodriguez K.A., Denny A.D., Busuttil R.A., Dolle M.E., Calder R.B., Chisholm G.B., Pollock B.H., Klein C.A. et al. (2006) Increased cell-to-cell variation in gene expression in ageing mouse heart. Nature, 441, 1011–1014. [DOI] [PubMed] [Google Scholar]
- 47.Li Z., Wright F.A., Royland J. (2009) Age-dependent variability in gene expression in male fischer 344 rat retina. Toxicol. Sci., 107, 281–292. [DOI] [PMC free article] [PubMed] [Google Scholar]
- 48.Somel M., Khaitovich P., Bahn S., Paabo S., Lachmann M. (2006) Gene expression becomes heterogeneous with age. Curr. Biol., 16, R359–R360. [DOI] [PubMed] [Google Scholar]
- 49.Southworth L.K., Owen A.B., Kim S.K. (2009) Aging Mice Show a Decreasing Correlation of Gene Expression within Genetic Modules. Plos Genet., 5, e1000776. [DOI] [PMC free article] [PubMed] [Google Scholar]
- 50.Pal C., Papp B., Hurst L.D. (2001) Highly expressed genes in yeast evolve slowly. Genetics, 158, 927–931. [DOI] [PMC free article] [PubMed] [Google Scholar]
- 51.Duret L., Mouchiroud D. (2000) Determinants of substitution rates in mammalian genes: expression pattern affects selection intensity but not mutation rate. Molecular Biol. Evol. 17, 68–74. [DOI] [PubMed] [Google Scholar]
- 52.Wolf Y.I., Novichkov P.S., Karev G.P., Koonin E.V., Lipman D.J. (2009) The universal distribution of evolutionary rates of genes and distinct characteristics of eukaryotic genes of different apparent ages. Proc. Natl. Acad. Sci. USA, 106, 7273–7280. [DOI] [PMC free article] [PubMed] [Google Scholar]
- 53.Johnson S.C., Dong X., Vijg J., Suh Y. (2015) Genetic evidence for common pathways in human age-related diseases. Aging Cell, 14, 809–817. [DOI] [PMC free article] [PubMed] [Google Scholar]
- 54.Amberger J., Bocchini C.A., Scott A.F., Hamosh A. (2009) McKusick's Online Mendelian Inheritance in Man (OMIM). Nucleic Acids Res., 37, D793–D796. [DOI] [PMC free article] [PubMed] [Google Scholar]
- 55.Zhang J., Yang J.R. (2015) Determinants of the rate of protein sequence evolution. Nat. Rev. Genet., 16, 409–420. [DOI] [PMC free article] [PubMed] [Google Scholar]
- 56.Evert J., Lawler E., Bogan H., Perls T. (2003) Morbidity profiles of centenarians: survivors, delayers, and escapers. J. Gerontol., 58, 232–237. [DOI] [PubMed] [Google Scholar]
- 57.Pavlidis N., Stanta G., Audisio R.A. (2012) Cancer prevalence and mortality in centenarians: a systematic review. Crit. Rev. Oncol. Hematol., 83, 145–152. [DOI] [PubMed] [Google Scholar]
- 58.Andersen S.L., Sebastiani P., Dworkis D.A., Feldman L., Perls T.T. (2012) Health span approximates life span among many supercentenarians: compression of morbidity at the approximate limit of life span. J. Gerontol. A-Biol., 67, 395–405. [DOI] [PMC free article] [PubMed] [Google Scholar]
- 59.David D.C., Ollikainen N., Trinidad J.C., Cary M.P., Burlingame A.L., Kenyon C. (2010) Widespread protein aggregation as an inherent part of aging in C. elegans. Plos Biol., 8, e1000450. [DOI] [PMC free article] [PubMed] [Google Scholar]
- 60.Reis-Rodrigues P., Czerwieniec G., Peters T.W., Evani U.S., Alavez S., Gaman E.A., Vantipalli M., Mooney S.D., Gibson B.W., Lithgow G.J. et al. (2012) Proteomic analysis of age-dependent changes in protein solubility identifies genes that modulate lifespan. Aging Cell, 11, 120–127. [DOI] [PMC free article] [PubMed] [Google Scholar]
- 61.Gems D., de la Guardia Y. (2013) Alternative perspectives on aging in caenorhabditis elegans: reactive oxygen species or hyperfunction? Antioxid. Redox. Sign., 19, 321–329. [DOI] [PMC free article] [PubMed] [Google Scholar]
- 62.de Magalhaes J.P. (2012) Programmatic features of aging originating in development: aging mechanisms beyond molecular damage? FASEB J., 26, 4821–4826. [DOI] [PMC free article] [PubMed] [Google Scholar]
- 63.Slagboom P.E., Beekman M., Passtoors W.M., Deelen J., Vaarhorst A.A., Boer J.M., van den Akker E.B., van Heemst D., de Craen A.J., Maier A.B, et al. (2011) Genomics of human longevity. Philos. Trans. R Soc. Lond. Ser. B Biol. Sci., 366, 35–42. [DOI] [PMC free article] [PubMed] [Google Scholar]
- 64.Passtoors W.M., van den Akker E.B., Deelen J., Maier A.B., van der Breggen R., Jansen R., Trompet S., van Heemst D., Derhovanessian E., Pawelec G. et al. (2015) IL7R gene expression network associates with human healthy ageing. Immun. Ageing, 12, 21.. [DOI] [PMC free article] [PubMed] [Google Scholar]
- 65.Georgi B., Voight B.F., Bucan M. (2013) From mouse to human: evolutionary genomics analysis of human orthologs of essential genes. Plos Genet., 9, e1003484.. [DOI] [PMC free article] [PubMed] [Google Scholar]
- 66.Eisenberg E., Levanon E.Y. (2013) Human housekeeping genes, revisited. Trends Genet., 29, 569–574. [DOI] [PubMed] [Google Scholar]
- 67.Mi H.Y., Muruganujan A., Casagrande J.T., Thomas P.D. (2013) Large-scale gene function analysis with the PANTHER classification system. Nat. Protoc., 8, 1551–1566. [DOI] [PMC free article] [PubMed] [Google Scholar]
- 68.Wu M., Yu Q., Li X.L., Zheng J., Huang J.F., Kwoh C.K. (2013) Benchmarking human protein complexes to investigate drug-related systems and evaluate predicted protein complexes. Plos One, 8, e53197. [DOI] [PMC free article] [PubMed] [Google Scholar]
- 69.Finn R.D., Bateman A., Clements J., Coggill P., Eberhardt R.Y., Eddy S.R., Heger A., Hetherington K., Holm L., Mistry J, et al. (2014) Pfam: the protein families database. Nucleic Acids Res., 42, D222–D230. [DOI] [PMC free article] [PubMed] [Google Scholar]
- 70.Finn R.D., Miller B.L., Clements J., Bateman A. (2014) iPfam: a database of protein family and domain interactions found in the Protein Data Bank. Nucleic Acids Res., 42, D364–D373. [DOI] [PMC free article] [PubMed] [Google Scholar]
- 71.Obayashi T., Okamura Y., Ito S., Tadaka S., Motoike I.N., Kinoshita K. (2013) COXPRESdb: a database of comparative gene coexpression networks of eleven species for mammals. Nucleic Acids Res., 41, D1014–D1020. [DOI] [PMC free article] [PubMed] [Google Scholar]
- 72.Obayashi T., Kinoshita K. (2009) Rank of correlation coefficient as a comparable measure for biological significance of gene coexpression. DNA Res., 16, 249–260. [DOI] [PMC free article] [PubMed] [Google Scholar]
- 73.Albert R., Jeong H., Barabasi A.L. (2000) Error and attack tolerance of complex networks. Nature, 406, 378–382. [DOI] [PubMed] [Google Scholar]
Associated Data
This section collects any data citations, data availability statements, or supplementary materials included in this article.