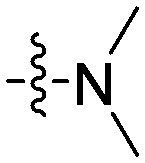
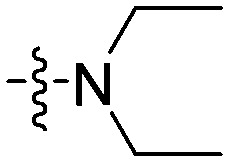
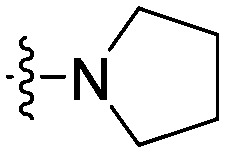
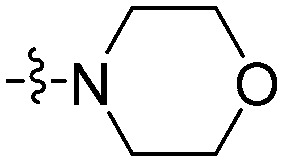
Table 1. SAR of the synthesized compounds.
| Compound | R | HL60 IC50 (μM) | Raji IC50 (μM) | Ramos IC50 (μM) | BTK a Inh% at 100 nm |
| 11a |
|
>50 | 42.9 | >50 | ND b |
| 11b |
|
9.34 | 12.5 | 11.2 | 40.3 |
| 11c |
|
15.8 | 19.2 | 10.4 | 59.8 |
| 11d |
|
5.94 | 14.7 | 7.24 | 60.7 |
| 11e |
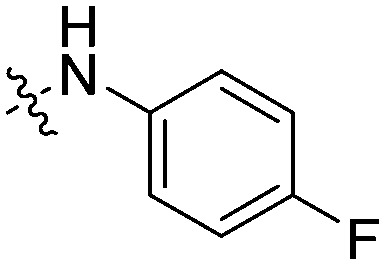
|
ND | ND | ND | 83.9 |
| 11f |
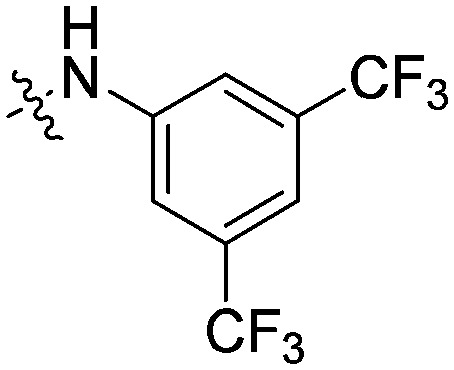
|
4.79 | 9.36 | 6.18 | 56.5 |
| 11g |
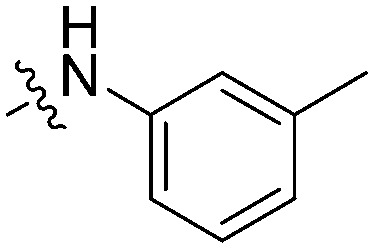
|
3.66 | 6.98 | 5.39 | 82.7 |
| 11h |
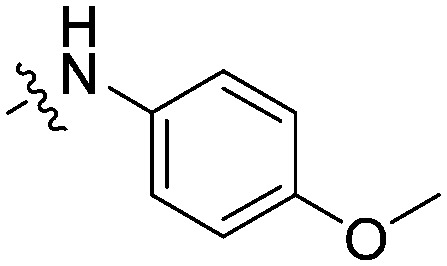
|
ND | ND | ND | 83.9 |
| 11i |
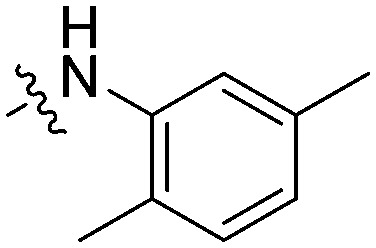
|
14.9 | 20.9 | 16.8 | ND |
| Ibrutinib | 3.57 | 14.5 | 2.31 | 99.4 |
aPercentage inhibition rate of each compound on BTK at 100 nM was measured using the ADP-Glo™ kinase assay system, shown as means of three experiments.
bNot determined.
