Abstract
Objective:
To compare quantitative OCT angiography (OCTA) parameters of macular ischemia in diabetic eyes without retinopathy with those in healthy nondiabetic controls.
Design:
Cross-sectional study from August 2014 through June 2017.
Subjects:
Thirty-nine eyes of 39 diabetic patients without clinical evidence of diabetic retinopathy and 40 eyes of 40 healthy nondiabetic subjects.
Methods:
Subjects underwent OCTA imaging using prototype AngioVue software (RTVue XR Avanti). Analyses of the foveal avascular zone (FAZ) and vasculature surrounding the FAZ were performed on the automatically generated en face OCTA images of the superficial and deep retinal vasculatures using vessel-based and FAZ-based metrics.
Main Outcome Measures:
Comparison of measurements made in the superficial and deep retinal capillary plexuses of diabetic eyes and normal eyes.
Results:
FAZ-based analysis revealed statistically significant differences between diabetic and normal eyes in FAZ area (superficial and deep layers), perimeter (superficial layer), major axis length (superficial layer), and minor axis layer (superficial and deep layers). Vessel-based analysis revealed statistically significant differences in the binarized flow index (superficial and deep layers), both including and excluding the FAZ area.
Conclusions:
Quantitative OCTA parameters reveal subclinical macular ischemia at both the superficial and deep retinal capillary plexuses in diabetic eyes that do not manifest clinical retinopathy. Vessel-based and FAZ-based metrics applied to OCTA images may serve as effective tools for screening and disease monitoring in patients with diabetes without clinical evidence of retinopathy.
Diabetic retinopathy is the most common cause of visual impairment among working-age adults in the developed world.1 The current gold standard for detection of diabetic retinopathy is a dilated fundus examination. In addition, fluorescein angiography (FA) is used to evaluate the retinal vasculature in diabetic eye disease. FA has high sensitivity for detecting microaneurysms and areas of neovascularization, and it may be helpful to visualize retinal vascular changes in diabetic eyes that are otherwise not visible on examination.2 However, FA has several limitations, including an inability to independently visualize the deep retinal capillary plexus, increased cost and length of study time, and possible adverse effects due to dye injection, such as nausea, vomiting, and, rarely, allergic reactions.3
In contrast, OCT angiography (OCTA) is a noninvasive imaging modality based on depth-resolved motion-contrast imaging that operates by comparing the fluctuations in signal amplitude due to movement of blood cells relative to the static surrounding tissue. By enhancing fluctuations in OCT signal among sequential B-scans acquired at a given retinal location, a 3-dimensional OCT angiogram is generated. This allows assessment of the retinal and choroidal microvasculature in a noninvasive fashion.4,5 A unique property of OCTA in comparison to dye-based angiography is that it is depth-resolved, enabling the generation of 3-dimensional angiograms that can be used to analyze the retinal and choroidal capillary plexuses at varying depths. Because imaging the deep retinal capillary plexus is not currently possible using current FA techniques, many recent insights into microvascular diseases of the retina and choroid have been achieved using OCTA.
Over the past several years, a number of research groups have used OCTA to study the microvascular changes that occur in patients with diabetic retinopathy. OCTA has previously been used to qualitatively describe features such as an enlarged foveal avascular zone (FAZ), areas of ischemia, microaneurysms, and neovascularization in eyes with diabetic retinopathy.4,6–9 Quantitative studies analyzing the retinal microvasculature using automated algorithms applied to OCTA have described reduced vessel density in eyes with diabetic retinopathy.10–13
Recent evidence suggests that microvascular changes such as enlargement and/or remodeling of FAZ and areas of capillary nonperfusion may begin before diabetic retinopathy is clinically evident.14,15 This study aims to compare quantitative OCTA parameters of macular ischemia in diabetic eyes without retinopathy with those in healthy nondiabetic controls.
Methods
Subjects
Diabetic patients without clinical evidence of retinopathy and healthy nondiabetic controls were imaged using the prototype OCTA software on a commercially available Avanti spectral-domain (SD) OCT system (Optovue, Fremont, CA) at the New England Eye Center between August 2014 and June 2017. This study was approved by the institutional review board of Tufts Medical Center and adhered to the Declaration of Helsinki and the Health Insurance Portability and Accountability Act of 1996. Informed consent was obtained from all subjects in accordance with the Tufts Medical Center institutional review board before enrollment in the study. All OCTA images were de-identified before being placed in a database of OCTA images at the New England Eye Center.
The diagnosis of diabetes without clinical retinopathy was made by a retina specialist based on a complete ophthalmic examination, including dilated fundus examination with slit-lamp biomicroscopy and indirect ophthalmoscopy and, in selected cases, structural OCT imaging on commercially available SD-OCT (Carl Zeiss Meditec Inc, Dublin, CA; software version 6.0) and FA (Heidelberg Spectralis, Spectralis HRA + OCT, Heidelberg Engineering Inc, Heidelberg, Germany). Diabetic patients with any previous or concomitant posterior segment pathologies such as diabetic retinopathy of any severity, age-related macular degeneration, retinal detachment, and vascular occlusions, and those with a myopic refractive error of ≥6 diopters, were excluded. The healthy nondiabetic control subjects had a best-corrected visual acuity of 20/20 or better and underwent a dilated fundus examination to exclude any pre-existing posterior segment pathology.
OCT Angiography Imaging
All subjects underwent OCTA imaging using prototype AngioVue software within the RTVue XR Avanti SD-OCT device (Optovue, Inc, Fremont, CA) that operates at a wavelength of 840 nm, a bandwidth of 45 nm, and a speed of 70 000 A-scans per second. Volumes, 3 × 3 mm in area and centered at the fovea, consisted of 304 A-scans per B-scan and 304 B-scan locations per volume; 2 repeated B-scans were acquired at each B-scan position to allow for OCTA. Split-spectrum amplitude-decorrelation angiography16 was used to generate OCTA images. All OCTA imaging was performed by trained ophthalmic photographers who repeated imaging several times, if necessary, to ensure acquisition of the best image quality. This is consistent with the standard imaging protocol at the New England Eye Center.
Quantification of Retinal Vasculature
Analyses of the FAZ and vasculature surrounding the FAZ were performed on the automatically generated en face OCTA images of the superficial and deep retinal vasculatures. All analysis was performed using MATLAB (MathWorks, Natick, MA). Before quantification of vascular features, the scan-logo in the bottom left of the images (red arrow in Fig 1A) was excluded from the analysis. The processing steps involved in the analyses are schematically outlined in Figure 1. The methodology of quantification is described below.
Figure 1.
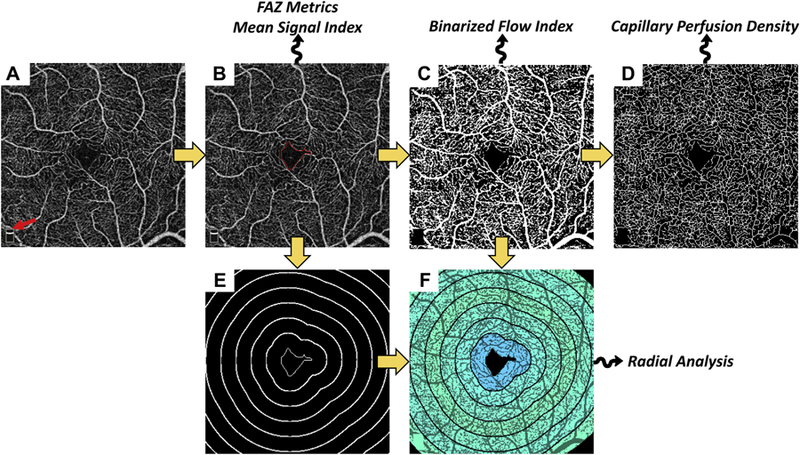
Summary of processing steps used in analysis. Yellow arrows indicate the workflow; squiggly arrows indicate that the listed metrics are derived from that processing step. A, Input image; red arrow points to the scan-logo, which is removed from the analysis. B, Segmented foveal avascular zone (FAZ); red contour indicates FAZ boundary. This contour is used to derive the FAZ-based metrics. It is also used for computation of all metrics in which the FAZ is excluded. C, Binarized image. D, Skeletonized image. E, Level sets (bold white) of the closest-point-to-FAZ-contour function; the FAZ, in the center, is shown as a thin white contour. The level set contours are spaced by 250 μm. F, Radially averaged binarized flow index, using the contours from (E), overlaid on the binarized image.
Foveal Avascular Zone–Based Analysis.
FAZ areas on the superficial and deep images were manually traced by a masked reader using a custom MATLAB application. For the FAZ-based analysis, we evaluated the following metrics:
FAZ Area [mm2]: area within the traced FAZ
FAZ Perimeter [mm]: length of the contour demarcating the FAZ
Acircularity Index (AI): ratio of the FAZ perimeter to the perimeter of a circle with an area equal to that of the FAZ–mathematically, AI = Perimeter/√(4 × π × Area)17
Major Axis Length [mm]: major axis of the ellipse that has the same normalized second central moments as the region
Minor Axis Length [mm]: minor axis of the ellipse that has the same normalized second central moments as the region
Axis Ratio: ratio of the major axis length to the minor axis length.17
Vessel-Based Analysis.
The following vessel-based metrics were evaluated, both with the FAZ excluded and with the FAZ included:
Mean Signal Index: defined as the mean OCTA signal over the image field-of-view. For the analysis with the FAZ excluded, the mean was taken over the image pixels outside the FAZ boundary.
Binarized Flow Index (BFI): defined similarly to the flow index described by Jia et al.18 Computation of the BFI proceeds in 3 steps: (1) Image binarization (Fig 1C). The threshold used for binarization is set at 3 standard deviations above the mean noise level in the FAZ. Artifacts causing bright OCTA signals within the FAZ were excluded from the noise analysis. (2) Spatial averaging of the binarized image via convolution with a disk structuring element (kernel) having a 250-μm diameter. (3) Averaging of the output from (2). For the analysis with the FAZ excluded, the mean was taken over the image pixels outside the FAZ boundary.
Capillary Perfusion Density (CPD): defined analogously to Agemy et al.13 Computation of the CPD proceeds in 4 steps: (1) Binarization, as described for the BFI. (2) Skeletonization of the binarized image (Fig 1D). (3) Spatial averaging, as described for the BFI. (4) Averaging of the output from (3), as described for the BFI.
The spatially averaged BFI and CPD were semi-transparently overlaid on the binarized, skeletonized, or original OCTA images (Fig 2A.2 and B.2; Fig 3A.2 and B.2). The BFI and CPD metrics were also analyzed as a function of distance from the FAZ margin as follows:
Figure 2.
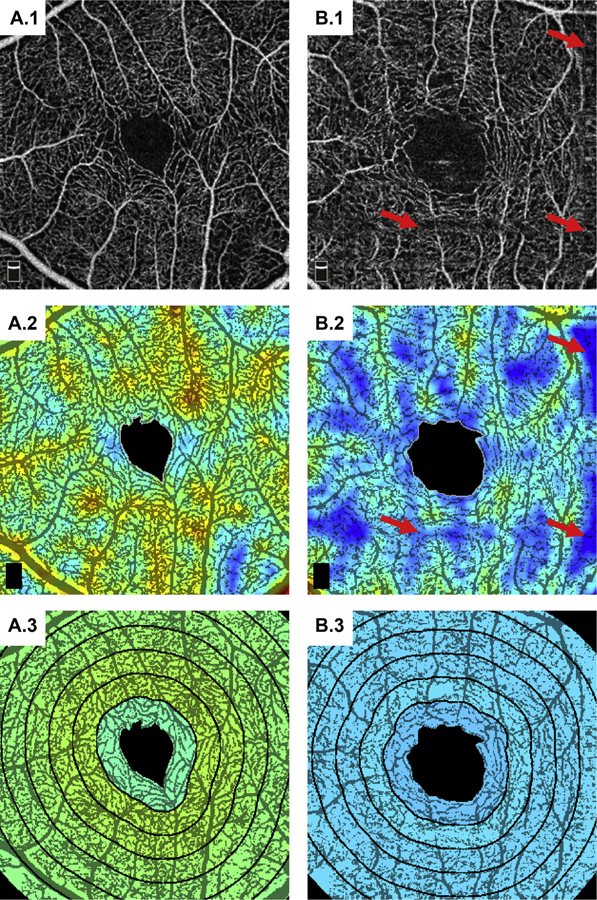
Example analysis on the superficial vasculature for A, a 66-year-old control, and B, a 66-year-old diabetic patient. A.1 and B.1, Input OCTA images. A.2 and B.2, binarized flow index (BFI) overlaid on the binarized OCT angiography (OCTA) images (red corresponds to higher flow index and blue to lower flow index). The red arrows point to motion artifacts, which, while somewhat hidden in the input OCTA image, appear as thresholded regions in the binarized image; motion artifacts present a substantial challenge to vessel-based analysis techniques. A.3 and B.3, Radially averaged BFI overlaid on the binarized OCTA images (with the same color scale as in A.2 and B.2).
Figure 3.
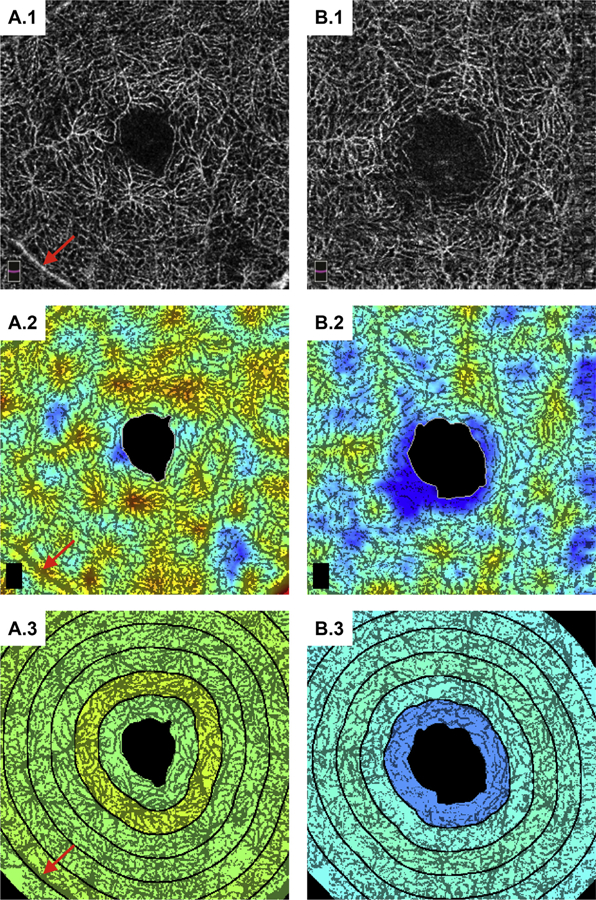
Example analysis on the deep vasculature for the same patients as in Figure 2. (See caption of Figure 2 for figure description.) The red arrows point to a superficial retinal vessel appearing within the deep vasculature because of a projection image. This sort of artifact can confound quantitative vessel-based analysis of the deeper vasculature.
Radial Vascular Maps: These maps show the dependency of a given vessel metric as a function from the FAZ boundary. Computation proceeds in 3 steps: (1) Every pixel outside the FAZ is assigned a distance from the FAZ, defined as the distance between that pixel and the closest point on the FAZ boundary. (2) Using these distances, the image is divided into radial sectors, where a given sector contains all pixels whose distance from the FAZ lies within a given range (for this study, we used 250-μm sectors; Fig 1E). (3) Averaging of the vessel metric over each sector (Fig 1F).
Statistical Analysis
The en face OCTA of the superficial and deep retinal capillary plexuses were analyzed as independent datasets. For all metrics, the control and diabetic groups were compared using the Mann–Whitney U test, with significance set at 0.05. Pearson correlation coefficient was used to check for correlations of the metric values with age and signal strength. All analysis was performed using MATLAB.
Results
A total of 39 eyes of 39 patients with diabetes without clinical retinopathy and 40 eyes of 40 healthy nondiabetic control subjects were imaged using OCTA. Mean HbA1c was 7.1 and mean visual acuity was 20/30 in the diabetic group. The mean age of the diabetic patients was 54±10.7 years and that of the healthy subjects was 48±17.8 years (P = 0.089, Mann–Whitney U). The mean OCT signal strengths were 72.9±6.4 and 71.7±4.9 for the control and diabetic groups, respectively (P = 0.26, Mann–Whitney U; all signal strengths were >60).
The results of the FAZ-based analysis are summarized in Table 1, and those of the vessel-based analysis are summarized in Table 2. Examples of analyzed images are shown in Figures 2 and 3. Histogram plots of the FAZ areas and BFI are shown in Figure 4.
Table 1.
Summary of Foveal Avascular Zone—Based Metrics Measured in the Superficial and Deep Plexuses for Diabetic Subjects without Clinical Retinopathy and Healthy Controls
| Area [mm2] | Perimeter [mm] | Acircularity Index | Major Axis Length [mm] | Minor Axis Length [mm] | Axis Ratio | |
|---|---|---|---|---|---|---|
| Superficial plexus | ||||||
| Diabetic | 0.33±0.15 | 2.33±0.83 | 1.17±0.19 | 0.7±0.17 | 0.59±0.14 | 1.19±0.15 |
| Control | 0.24±0.09 | 1.99±0.44 | 1.18±0.14 | 0.61±0.11 | 0.50±0.11 | 1.22±0.17 |
| P value | 0.002 | 0.02 | 0.63 | 0.009 | 0.002 | 0.23 |
| Deep plexus | ||||||
| Diabetic | 0.35±0.16 | 2.24±0.61 | 1.1±0.07 | 0.72±0.17 | 0.6±0.15 | 1.22±0.14 |
| Control | 0.27±0.09 | 2.1±0.33 | 1.16±0.15 | 0.66±0.1 | 0.53±0.1 | 1.26±0.23 |
| P value | 0.03 | 0.18 | 0.08 | 0.07 | 0.02 | 0.61 |
Bold P values indicate statistical significance.
Table 2.
Summary of Vessel-Based Metrics* Measured in the Superficial and Deep Plexuses for Diabetic Subjects without Clinical Retinopathy and Healthy Controls
| Excluding FAZ |
Including FAZ |
|||||
|---|---|---|---|---|---|---|
|
Mean Signal Index |
Binarized Flow Index |
Capillary Perfusion Density |
Mean Signal Index |
Binarized Flow Index |
Capillary Perfusion Density |
|
| Superficial plexus | ||||||
| Diabetic | 0.26±0.02 | 0.41±0.08 | 0.22±0.03 | 0.25±0.02 | 0.42±0.08 | 0.21±0.03 |
| Control | 0.26±0.03 | 0.5±0.05 | 0.23±0.02 | 0.25±0.03 | 0.46±0.05 | 0.22±0.02 |
| P value | 0.28 | 0.01 | 0.13 | 0.15 | 0.01 | 0.07 |
| Deep plexus | ||||||
| Diabetic | 0.29±0.02 | 0.46±0.09 | 0.25±0.03 | 0.28±0.03 | 0.46±0.09 | 0.24±0.03 |
| Control | 0.3±0.03 | 0.51±0.07 | 0.26±0.02 | 0.29±0.03 | 0.51±0.07 | 0.25±0.02 |
| P value | 0.10 | 0.01 | 0.08 | 0.07 | 0.01 | 0.06 |
FAZ = foveal avascular zone.
Bold P values indicate statistical significance.
The metrics are subdivided based on inclusion and exclusion of the FAZ.
Figure 4.
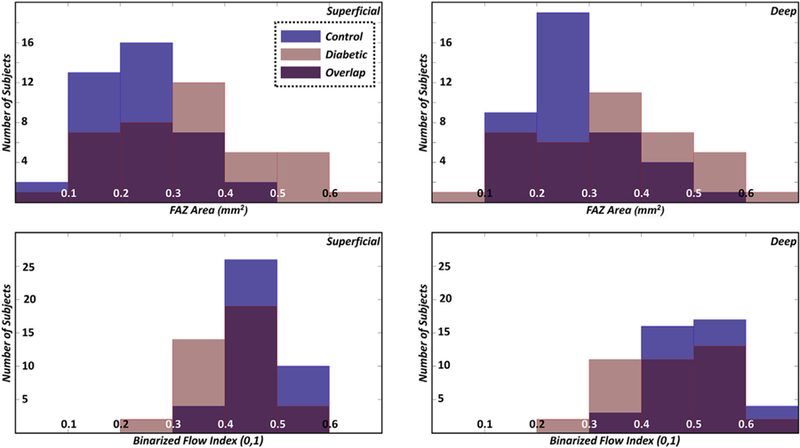
Histograms of the foveal avascular zone (FAZ) area (top row) and binarized flow index (bottom row); the left column corresponds to the superficial vasculature and the right column corresponds to the deep vasculature.
Discussion
In this study, both FAZ-based and vessel-based metrics were used to identify macular ischemia in diabetic eyes without clinical retinopathy and in healthy nondiabetic control eyes. Vessel-based metrics were evaluated in 3 ways: (1) globally, both including and excluding the FAZ; (2) locally (and qualitatively), using spatial averaging; and radially, by averaging metrics over sectors lying different distances away from the FAZ margin.
The FAZ-based analysis revealed statistically significant differences in the FAZ area (superficial and deep layers), perimeter (superficial layer), major axis length (superficial layer), and minor axis layer (superficial and deep layers). The observations of increased FAZ area in diabetic subjects, compared with controls, agrees with previous literature.14,15,19–22 We suspect that an obfuscation of detail in the OCTA images of the deep layer, which causes the FAZ to appear more circular in shape, may have contributed to the finding that the perimeter and major axis lengths were found to be significantly higher in the superficial layers but not in the deep layers. It should be noted that although both the major and minor axis lengths tended to be longer in diabetic patients, the ratio of these 2 was not found to be statistically different from that in controls, which is consistent with previous studies.17 The observation that the AI in controls did not differ from that in diabetic patients in a statistically significant way is also consistent with prior results.17 Interestingly, although not statistically significant, the AI in the deep layer was lower in diabetic patients than in controls. Again, this may be attributable, in part, to the observation that in the deep layer, and in diabetic subjects in particular, OCTA images of the FAZ are less defined, making the FAZ appear more circular in shape.
The vessel-based analysis revealed statistically significant differences in the BFI (superficial and deep), both including and excluding the FAZ area. Analysis of the BFI as a function of distance from the FAZ margin revealed that the most significant differences between the 2 groups occurred from 500 μm away from the FAZ margin and outward (Fig 5). To our knowledge, this is the first report of such analysis, and future studies to better understand this finding are merited. Although not statistically significant, the mean signal index and CPD were also reduced in diabetic patients as compared with controls. The lack of a difference in CPD at either the superficial or deep retinal capillary plexus is somewhat at odds with recent publications.21 Dimitrova et al21 calculated parafoveal vessel density in the superficial and deep plexuses using a circle of 1.25 mm radius, centered at the fovea, and excluded the central area within a circle of 0.3 mm radius. The enlarged FAZ area that they reported would have expanded beyond the boundaries of this inner circle and may have impacted their parafoveal vessel density measurements. In our study, in which we excluded the entire, manually traced FAZ area from our CPD measurements, we failed to find a statistical significance in CPD between controls and diabetic patients.
Figure 5.
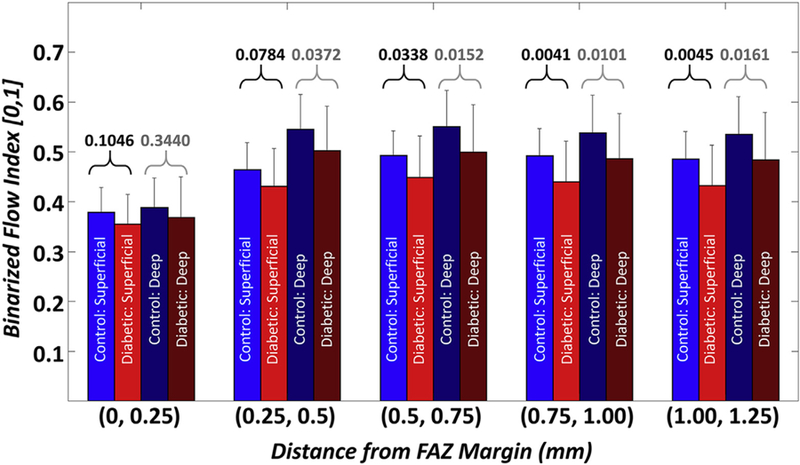
Bar plots of the binarized flow index as a function of the distance from the foveal avascular zone (FAZ) margin. Labels on the x-axis indicate the sector boundaries; i.e., (0, 0.25] denotes a sector starting at, but not including, the FAZ margin, and ending at, and including, the level set contour 0.25 mm away from the FAZ margin. The numbers above the brackets correspond to P values (black text corresponds to P values for the superficial layer; gray text corresponds to P values for the deep layer).
Comparing FAZ-based and vessel-based metrics, we believe that each class of techniques has its advantages and disadvantages. FAZ measurements are relatively easy to perform manually and are relatively robust to noise and image quality. That being said, FAZ measurements are highly dependent on accurate layer segmentation, particularly when the deep and superficial layers are separated; accurate layer segmentation is especially challenging in patients with pathology. Furthermore, it has been our observation that the details of the FAZ boundary are less obvious in the deep layer than in the superficial layer. Compared with FAZ tracing, manual extraction of retinal vasculature is not feasible, making automated analysis a necessity. Most vessel-based metrics require, as a first step, binarization of the OCTA image. Binarization, though conceptually simple, is a complex problem that can be influenced by many factors, including signal levels, noise levels, optical focusing, vascular density, and motion artifacts (red arrows of Fig 2B.1 and B.2). If the threshold used for binarization is too high, true vasculature will be removed; if the threshold is too low, noise will masquerade as vasculature. There is also the question of whether a single, global threshold should be used or whether local (spatially adaptive) thresholding should be used; similarly, there is a question of whether a single threshold should be used for all images or whether the threshold should be adapted on a per-image basis, as was done in this study. Unfortunately, in making these processing decisions, there is usually no clear answer, and different choices may result in drastically different results. Nevertheless, compared with FAZ measurements, vessel-based techniques may, with improved image quality and analysis techniques, provide more sensitive and/or comprehensive information regarding diseases status.
Another consideration in comparing FAZ-based and vessel-based metrics is their dependency on age. Previous studies have found that vessel density–related measures decrease with age, which is consistent with the findings of this study (Fig 6).23,24 In contrast, we did not observe a correlation between FAZ area and age (Fig 6). That the FAZ area appears largely decoupled from age simplifies its interpretation in cohorts of subjects of varying age. Overall, at the time of writing, it is the authors’ belief that, at least for the purposes of robustly detecting diabetes-related vascular alterations in diabetic subjects without retinopathy, FAZ measurements, and in particular the FAZ area, serve as the more robust metric. Whether FAZ enlargement is the first detectable change in the eyes of diabetic patients remains an open question.
Figure 6.
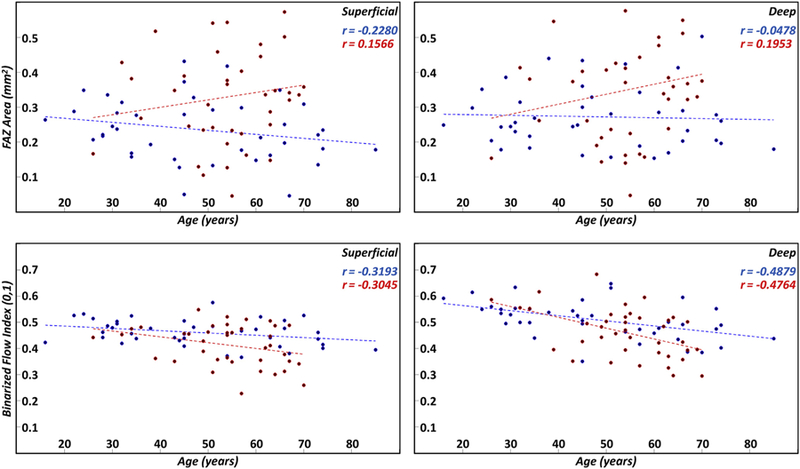
Scatter plots of the foveal avascular zone (FAZ) area (first row) and binarized flow index (second row) as a function of age; the first column corresponds to the superficial layer and the second column to the deep layer. Linear regression lines are shown as dashed lines. Blue points and lines correspond to controls; red points and lines correspond to diabetic patients. Pearson correlation coefficients for the controls and diabetic patients are listed in blue and red text, respectively.
This study is limited in that it is retrospective in design and involves a small sample size. Future longitudinal studies involving a large sample size may help to further determine the utility of automated measures of macular ischemia in diabetic eyes. There are also limitations related to the OCTA acquisition and signal processing steps in this study. As with most OCTA-based analysis, results are dependent on the quality of the inputted image. In particular, it is plausible that decreases in signal strengths may cause changes in FAZ-based and vessel-based metrics, for instance due to thresholding or binarization errors.25,26 Our analysis (Fig 7) of signal strength showed that FAZ area measurements were very weakly correlated with signal strength values, whereas BFI was more strongly correlated, particularly in normal subjects. Overall, there was no statistically significant difference in signal strengths between the control and diabetic groups, and all signal strengths were >60. Another processing-related limitation of this study, again shared by most OCTA studies, is the possibility of incorrect layer segmentation. As noted previously, errors in segmentation will cause errors in both FAZ-based and vessel-based analysis. Although all layer segmentations used in this study were the default contours automatically computed by the Optovue software, images with obviously incorrect segmentations were excluded. Furthermore, as this study was done on normal controls and diabetic patients without diabetic retinopathy, the absence of pathology somewhat limits the severity of this limitation.
Figure 7.
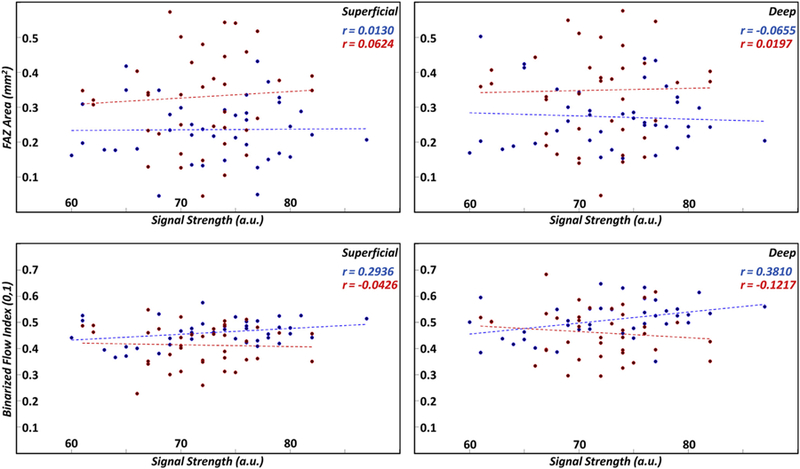
Scatter plots of the foveal avascular zone (FAZ) area (first row) and binarized flow index (second row) as a function of signal strength; the first column corresponds to the superficial layer and the second column to the deep layer. Linear regression lines are shown as dashed lines. Blue points and lines correspond to controls; red points and lines correspond to diabetic patients. Pearson correlation coefficients for the controls and diabetic patients are listed in blue and red text, respectively. a.u. = arbitrary unit.
In conclusion, methods for quantifying macular ischemia presented in this study have provided further evidence of subclinical manifestations of diabetic retinopathy. These methods may potentially serve as effective tools for screening and disease monitoring. However, larger-scale studies are needed to confirm our results.
Acknowledgments
Financial Support: This work was in part supported by a grant from the Macula Vision Research Foundation, New York and the Massachusetts Lions Club.
Abbreviations and Acronyms:
- AI
acircularity index
- BFI
binarized flow index
- CPD
capillary perfusion density
- FA
fluorescein angiography
- FAZ
foveal avascular zone
- OCTA
OCT angiography
Footnotes
Financial Disclosure(s):
Disclosures: N.K.W.: Consultant — Regeneron, Genentech; speaker’s bureau — Optovue, Nidek; research support — Carl Zeiss Meditec. J.S.D.: Consultant and research support — Carl Zeiss Meditec, Optovue, and Topcon Medical Systems Inc. C.R.B.: Speaker — Allergan; advisory board — Allergan, Genentech. J.G.: Royalties from intellectual property owned by the Massachusetts Institute of Technology and licensed to Carl Zeiss Meditec Inc, Optovue Inc; stock options — Optovue Inc. There are no conflicting relationships for any other author.
Human Subjects: This study includes human subject/tissues. No animal subjects were used in this study. Study protocol was approved by the Institutional Review Board (IRB) of Tufts Medical Center. Informed consent was obtained from all human subjects. All tenets of the Declaration of Helsinki were followed.
References
- 1.Klein R, Klein BE, Moss SE, Cruickshanks KJ. The Wisconsin Epidemiologic Study of diabetic retinopathy. XIV. Ten-year incidence and progression of diabetic retinopathy. Arch Ophthalmol 1994;112:1217–1228. [DOI] [PubMed] [Google Scholar]
- 2.Yamana Y, Ohnishi Y, Taniguchi Y, Ikeda M. Early signs of diabetic retinopathy by fluorescein angiography. Jpn J Ophthalmol 1983;27:218–227. [PubMed] [Google Scholar]
- 3.Kwiterovich KA, Maguire MG, Murphy RP, et al. Frequency of adverse systemic reactions after fluorescein angiography. Results of a prospective study. Ophthalmology 1991;98: 1139–1142. [DOI] [PubMed] [Google Scholar]
- 4.Matsunaga D, Yi J, Puliafito CA, Kashani AH. OCT angiography in healthy human subjects. Ophthalmic Surg Lasers Imaging Retina 2014;45:510–515 [DOI] [PubMed] [Google Scholar]
- 5.de Carlo TE, Romano A, Waheed NK, Duker JS. A review of optical coherence tomography angiography (OCTA). Int J Retina Vitreous 2015;1:5. [DOI] [PMC free article] [PubMed] [Google Scholar]
- 6.Salz DA, Talisa E, Adhi M, et al. Select features of diabetic retinopathy on swept-source optical coherence tomographic angiography compared with fluorescein angiography and normal eyes. JAMA Ophthalmol 2016;134:644–650. [DOI] [PMC free article] [PubMed] [Google Scholar]
- 7.Freiberg FJ, Pfau M, Wons J, et al. Optical coherence tomography angiography of the foveal avascular zone in diabetic retinopathy. Graefes Arch Clin Exp Ophthalmol 2015;254: 1051–1058. [DOI] [PMC free article] [PubMed] [Google Scholar]
- 8.Ishibazawa A, Nagaoka T, Takahashi A, et al. Optical coherence tomography angiography in diabetic retinopathy: a prospective pilot study. Am J Ophthalmol 2015;160:35–44.e31. [DOI] [PubMed] [Google Scholar]
- 9.Bresnick GH, Condit R, Syrjala S, et al. Abnormalities of the foveal avascular zone in diabetic retinopathy. Arch Ophthalmol 1984;102:1286–1293. [DOI] [PubMed] [Google Scholar]
- 10.Kim AY, Chu Z, Shahidzadeh A, et al. Quantifying microvascular density and morphology in diabetic retinopathy using spectral-domain optical coherence tomography angiography. Invest Ophthalmol Vis Sci 2016;57:OCT362–OCT370. [DOI] [PMC free article] [PubMed] [Google Scholar]
- 11.Hwang TS, Gao SS, Liu L, et al. Automated quantification of capillary nonperfusion using optical coherence tomography angiography in diabetic retinopathy. JAMA Ophthalmol 2016:1–7. [DOI] [PMC free article] [PubMed]
- 12.Cole E, Dang S, Novais EA, et al. Automated ischemia segmentation using OCT angiography in diabetic retinopathy. Invest Ophthalmol Vis Sci 2016;57:447. [Google Scholar]
- 13.Agemy SA, Scripsema NK, Shah CM, et al. Retinal vascular perfusion density mapping using optical coherence tomography angiography in normals and diabetic retinopathy patients. Retina 2015;35:2353–2363. [DOI] [PubMed] [Google Scholar]
- 14.de Carlo TE, Chin AT, Bonini Filho MA, et al. Detection of microvascular changes in eyes of patients with diabetes but not clinical diabetic retinopathy using optical coherence tomography angiography. Retina 2015;35:2364–2370. [DOI] [PubMed] [Google Scholar]
- 15.Choi W, Waheed NK, Moult EM, et al. Ultrahigh speed swept source optical coherence tomography angiography of retinal and choriocapillaris alterations in diabetic patients with and without retinopathy. Retina 2017;37:11–21. [DOI] [PMC free article] [PubMed] [Google Scholar]
- 16.Jia Y, Tan O, Tokayer J, et al. Split-spectrum amplitude-decorrelation angiography with optical coherence tomography. Opt Express 2012;20:4710–4725. [DOI] [PMC free article] [PubMed] [Google Scholar]
- 17.Krawitz BD, Mo S, Geyman LS, et al. Acircularity index and axis ratio of the foveal avascular zone in diabetic eyes and healthy controls measured by optical coherence tomography angiography. Vision Res doi: 10.1016/j.visres.2016.09.019.2017.02.26. [DOI] [PubMed] [Google Scholar]
- 18.Jia Y, Morrison JC, Tokayer J, et al. Quantitative OCT angiography of optic nerve head blood flow. Biomed Opt Express 2012;3:3127–3137. [DOI] [PMC free article] [PubMed] [Google Scholar]
- 19.Di G, Weihong Y, Xiao Z, et al. A morphological study of the foveal avascular zone in patients with diabetes mellitus using optical coherence tomography angiography. Graefes Arch Clin Exp Ophthalmol 2016;254:873–879. [DOI] [PubMed] [Google Scholar]
- 20.Takase N, Nozaki M, Kato A, et al. Enlargement of foveal avascular zone in diabetic eyes evaluated by en face optical coherence tomography angiography. Retina 2015;35: 2377–2383. [DOI] [PubMed] [Google Scholar]
- 21.Dimitrova G, Chihara E, Takahashi H, et al. Quantitative retinal optical coherence tomography angiography in patients with diabetes without diabetic retinopathy. Invest Ophthalmol Vis Sci 2017;58:190–196. [DOI] [PubMed] [Google Scholar]
- 22.Schottenhamml J, Moult EM, Ploner S, et al. An automatic, intercapillary area-based algorithm for quantifying diabetes-related capillary dropout using optical coherence tomography angiography. Retina 2016;36 Suppl 1:S93–S101. [DOI] [PMC free article] [PubMed] [Google Scholar]
- 23.Iafe NA, Phasukkijwatana N, Chen X, Sarraf D. Retinal capillary density and foveal avascular zone area are age-dependent: quantitative analysis using optical coherence tomography angiography. Invest Ophthalmol Vis Sci 2016;57: 5780–5787. [DOI] [PubMed] [Google Scholar]
- 24.Yu J, Jiang C, Wang X, et al. Macular perfusion in healthy Chinese: an optical coherence tomography angiogram study. Invest Ophthalmol Vis Sci 2015;56:3212–3217. [DOI] [PMC free article] [PubMed] [Google Scholar]
- 25.Cole ED, Moult EM, Dang S, et al. The definition, rationale, and effects of thresholding in OCT angiography. Ophthalmology Retina 2017;1:435–447. [DOI] [PMC free article] [PubMed] [Google Scholar]
- 26.Spaide RF, Fujimoto JG, Waheed NK. Image artifacts in optical coherence tomography angiography. Retina 2015;35: 2163–2180. [DOI] [PMC free article] [PubMed] [Google Scholar]


