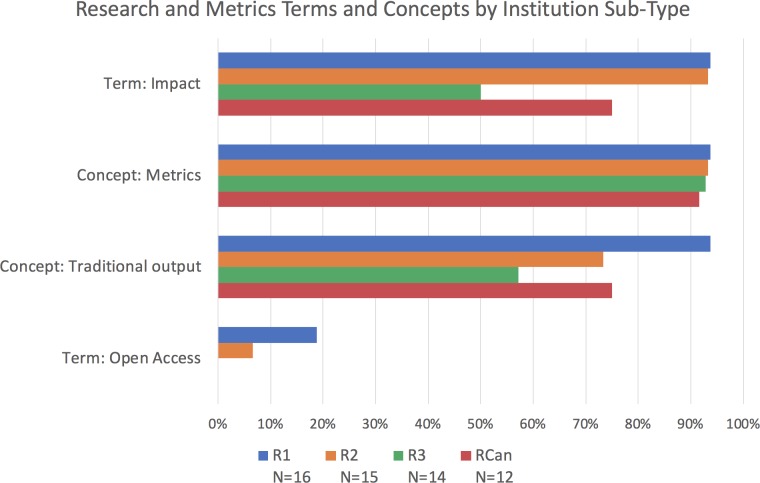
Figure 7. Percentage of institutions mentioning terms and concepts related to research and metrics by institution sub-type.
Bars represent whether each term or concept (several terms and phrases) was identified within documents of doctoral/research-focused universities, from the most research intensive (R1; blue), to those that are less so (R2; orange, and R3; green), as well as the Canadian research universities (RCan; red). The term "impact" appears less in R3 institutions, and the concept of "metrics" appears to decrease with research intensity (with RCan institutions at similar levels to the R2 institutions from the US) However, the conditions for a chi-square test were not met to measure the significance of these differences.

