Figure 6. Ase1, Cut7 and Klp2 do not contribute to the regulation of cell-size-dependent spindle elongation velocity.
(A) Time-lapse image from mitosis onset until spindle breakdown of a wild-type cell expressing mCherry-Atb2 (tubulin) and Ase1-GFP. Arrowhead corresponds to anaphase B onset. Each frame corresponds to 2 min interval. (B) Images of wee1-50, wild-type (wt) and cdc25-22 cells expressing mCherry-Atb2 (tubulin) and Ase1-GFP in late anaphase. Scale bar, 5 µm. (C) Ase1-GFP intensity at anaphase spindles plotted against final spindle length (wee1-50: n = 24, wt: n = 28, cdc25-22: n = 30). Data was fitted by linear regression (dashed lines), showing the regression coefficient R2 and the slope m. (D) Comparative plot of spindle length dynamics of wild-type (n = 27) cells, pnmt81-ase1 (n = 32) and pnmt41-ase1 (n = 29). (E) Box plot comparison of anaphase B spindle elongation velocities (v) in wild-type, pnmt81-ase1 and pnmt41-ase1 cells. (F) Comparative plot of anaphase spindle dynamics of wild-type (n = 28) and ase1Off cells (n = 52). Bold curves correspond to mean spindle dynamics. (G) Model of the role of tested midzone components. (H) Box plot comparison of anaphase B spindle elongation velocities (v) in wild-type cells, ase1-Shut-Off (ase1Off), pkl1Δ, the double-deletion pkl1Δcut7Δ and klp2Δ cells. P values were calculated by Mann-Whitney U test; data sets are defined as not significantly different (n.s.) if p>0.05. Data obtained from n cells was collected from three independent experiments.

Figure 6—figure supplement 1. Upon reduction of the Ase1 level spindles remain stable until late anaphase.
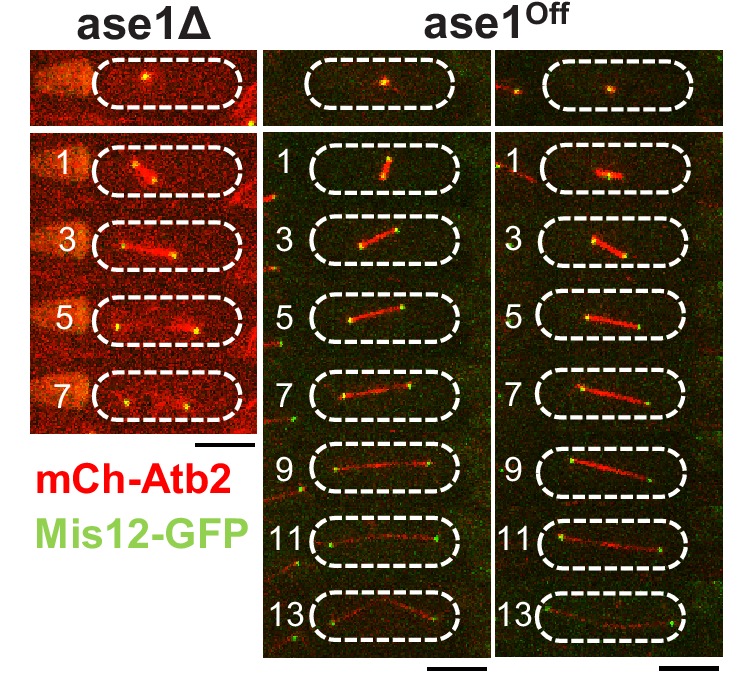
Figure 6—figure supplement 2. GFP-Ase1 intensity at anapahse spindles in ase1Off and wild-type cells.
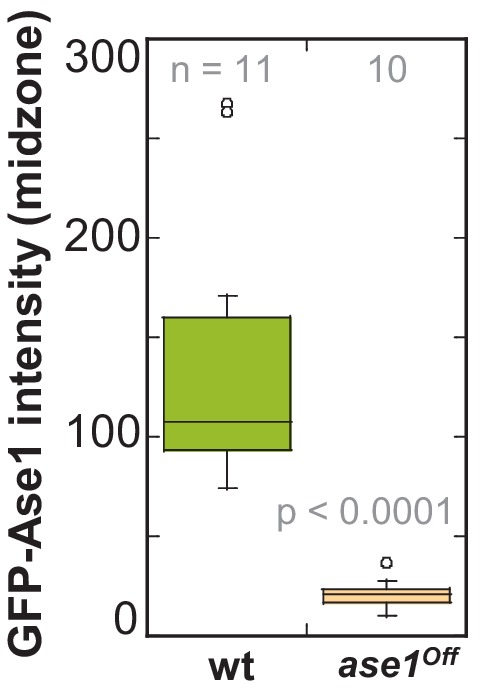
Figure 6—figure supplement 3. Klp9-GFP intensity at anaphase spindles in ase1Off and wild-type cells.
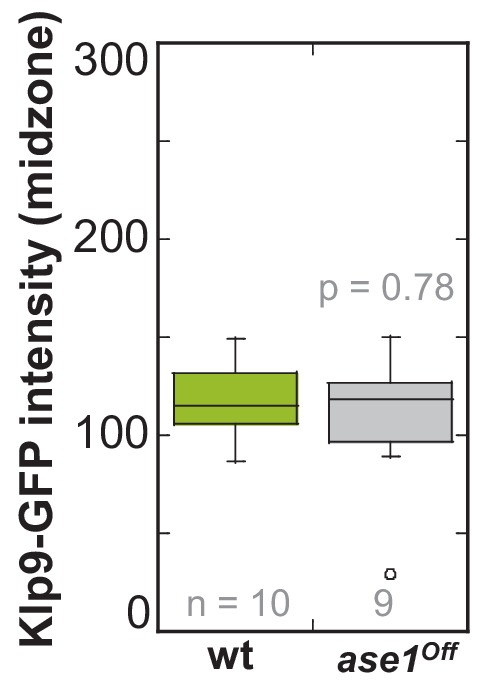
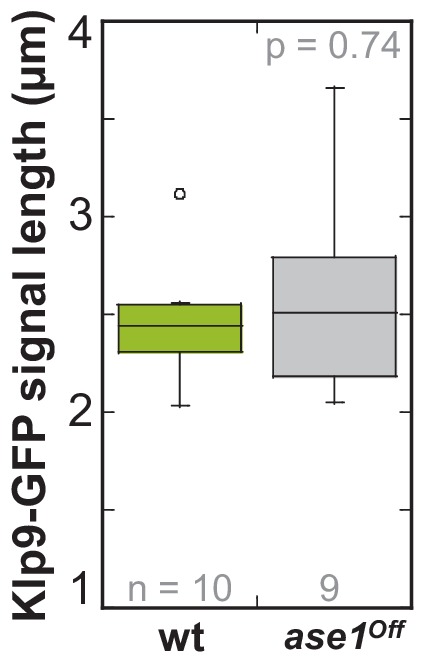
Figure 6—figure supplement 4. Klp9-GFP signal length at anaphase spindles in ase1Off and wild-type cells.