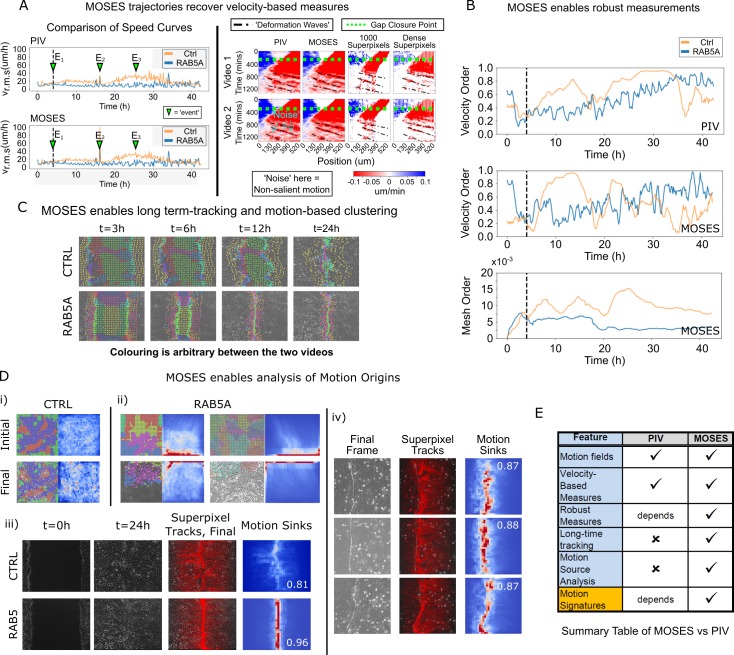
Figure 6. Comparison between MOSES and PIV.
(A) Left: average speed curves of MCF-10A control (CTRL) and doxycycline inducible RAB5A-expressing (RAB5A) monolayer cell migration after doxycycline addition (Supp. Movie 3 of Malinverno et al., 2017) computed using PIV and MOSES (optical flow). Green triangles indicate notable events in the movie; E1 (4 h): addition of doxycycline, E2 (16 h): first bright ‘flash’ in movie followed by accelerated movement of RAB5A expressing cells, E3 (25 h): timepoint at which RAB5A cells moved fastest. Right: velocity kymographs of Videos 1 and 2 (c.f. Figures 3 and 4 respectively in Rodríguez-Franco et al. (2017)) computed from PIV and MOSES motion fields showing the presence of deformation waves (black dash-dot line) due to cell jamming following initial gap closure (green dashed line). The corresponding velocity kymographs reconstructed from a fixed number of 1000 MOSES superpixel tracks and a ‘dense’ number of superpixel tracks (starting with 1000 superpixels) is shown for comparison. The speed and direction of movement are indicated by the intensity and colour, respectively (blue, moving right; red, moving left). (B) Top and middle: velocity order parameter curves as defined in Malinverno et al. (2017) for the MCF-10A control and RAB5A expressing cell lines was computed for the same movies as (A) using PIV and MOSES. Bottom: corresponding MOSES mesh order curve. Black vertical dashed line mark the addition of doxycycline. (C) MOSES superpixel tracks computed for wound-healing assay of MCF-10A and RAB5A cells (Supp. Video 19 of Malinverno et al., 2017) were automatically clustered into distinct groupings and coloured uniquely according to their mesh strain curve using GMM with BIC model selection (Materials and methods, Video 8 of this paper). (D) (i,ii) Automatic clustered superpixels and associated motion saliency maps (backward tracking to identify ‘initial’ motion, forward tracking to identify ‘final’ motion) for different videos of MCF10A-control (CTRL) and RAB5A monolayer migration in Malinverno et al. (2017), (see also Video 9). (iii) Left to right: snapshots of initial and final frames, MOSES superpixel tracks (1000 superpixels) overlaid on final frames, associated ‘final’ motion saliency map and boundary formation index for CTRL and RAB5A cells for same videos in (C). (iv) Snapshot of final frame, overlaid MOSES superpixel tracks (1000 superpixels) and associated ‘final’ motion saliency map and boundary formation index for the boundary formation between EphB2 and ephrinB1 expressing MDCK monolayers (Rodríguez-Franco et al., 2017). (E) Summary of the comparison between MOSES and PIV. Long-time refers to the tracking of movement beyond one timepoint.

