Abstract
In order to meet the health needs of the coming “age wave”, technology needs to be designed that supports remote health monitoring and assessment. In this study we design CIL, a clinician-in-the-loop visual interface, that provides clinicians with patient behavior patterns, derived from smart home data. A total of 60 experienced nurses participated in an iterative design of an interactive graphical interface for remote behavior monitoring. Results of the study indicate that usability of the system improves over multiple iterations of participatory design. In addition, the resulting interface is useful for identifying behavior patterns that are indicative of chronic health conditions and unexpected health events. This technology offers the potential to support self-management and chronic conditions, even for individuals living in remote locations.
Keywords: smart homes, clinician in the loop, visual analytics, activity recognition, remote health monitoring
I. INTRODUCTION
THE world’s population is aging. As a result, costs associated with chronic illnesses are soaring with 92% of older adults diagnosed with one chronic condition and 77% diagnosed with two or more chronic conditions [1]. Because individuals are living longer with chronic diseases [2] and a shortage will emerge in the care workforce [3], we must consider innovative health care options to provide quality care to our aging population, particularly those living in rural areas away from immediate health care.
Recent advances have transformed smart homes from experimental prototypes to real-world assistive technologies [4], [5]. Sensors are embedded in smart homes or other environments that collect data on resident behavior and home status. This sensor data is analyzed by software algorithms to recognize activities, discover behavior patterns, and infer the health status of residents in the home. Because the projected shortage of healthcare providers will create a challenge in providing health assistance to the growing older adult population, the rise of smart home technologies provides a new paradigm to deliver remote health monitoring. Our previous research suggests that we can harness smart home sensor data and machine learning to determine a person’s health status [6]–[11]. A continuous health monitoring system can provide an accurate assessment of physical functionality. Furthermore, clinicians can observe behavior fluctuations which allows for early detection of health events and decline.
In this paper, we introduce CIL, a clinician-in-the-loop visual analytics system, that provides a way for clinicians to remotely monitor and interpret the health status of individuals living in smart homes. The analytics are enhanced by partnering visual information displays with automatically-collected data on individuals, including their daily activities, walking speed, sleep quality, and activity level. Working with clinicians, CIL is created through two rounds of iterative design [12] with individuals new to the use of smart homes followed by three rounds of iterative design with individuals familiar with smart home technologies and data.
Smart home design has been researched for over a decade. As a result, researchers have also designed ways to visually present specific features of smart home data. As an example, Wang et al. [13] created a heat map that shows a smart home resident’s overall activity level. In a heat map, a darker or more intense color typifies a larger value for that period (in this case, more activity). Similarly, Le [14] depicted activity levels in the whole home and specific regions of the home using graphics that would be meaningful to the older adult residents. These included a streamed graphical display of data over long periods of time and radial curves that indicate the time of day when location-based activity is occurring. Kim et al. [15] took an approach similar to ours in providing a clinician-focused interface, although this is based on self-report rather than sensor data. In the QuietCare project, Kutzik et al. [16] used expert-crafted rules together with red, yellow, and green traffic-light circles to indicate the status of a resident in an assisted care facility with respect to bathroom falls, completed meals and medication, use of the bathroom, and activity level.
As emphasized in previous studies, visualization of data is most effective when it is tailored to the specific tasks it supports (in these cases, identifying behavior changes) [17] and to a particular user group [18]. The previously-cited studies created visualizations for groups including older adults and assisted care facility staff members. Visualizations were evaluated by determining whether changes in activity levels could be explained by known health conditions [13], or through open-ended discussion with clinicians and other end users [15], [16].
In this study, we design visual analytics specifically for trained clinicians (i.e., Registered Nurses) to use in remote monitoring of a patient’s health status. As a result, we involve clinicians in iterative design of the analytics. This offers a unique approach to the system design, the extraction of features, and the visualization of the information because they are created based on clinician feedback for the purpose of assistance clinicians with data interpretation. Another unique aspect of the work is the automatic identification of activity labels and incorporation of this and other data mined-insights into the visualized information. Finally, to evaluate our visual analytics tool (CIL), we collect quantitative usability scores, compute the agreement level between clinician interpretations of the data, and align clinician-identified concerns that arise from use of CIL with actual reported health events. This evaluation is based on data from ongoing smart home data collections. The results indicate that CIL can assist with remote health monitoring and help identify possible health concerns.
II. Smart Home Data Collection
Health management can be boosted using automated monitoring systems that take advantage of recent advances in pervasive computing and machine learning. The core of these technologies is the ability to unobtrusively sense and identify routine behavior. Clinicians can use this information to assess health, even at remote locations.
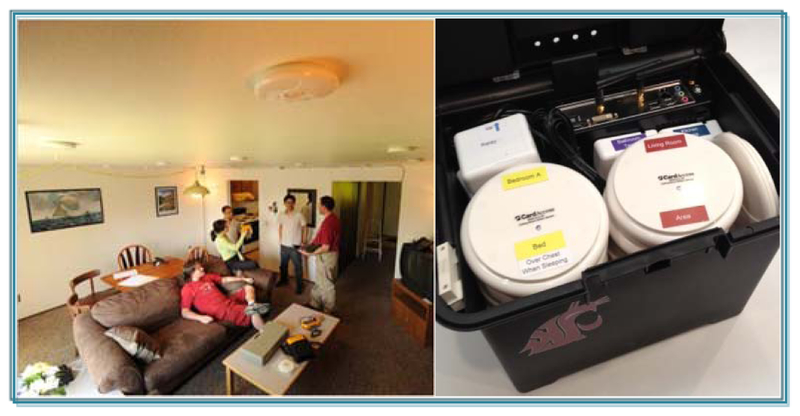
As a basis for remote health monitoring and visual analytics, we deployed the CASAS “smart home in a box” (SHiB, see Fig. 1) [19] in the homes of older adult participants. The SHiB collects sensor data in any physical environment while residents perform their normal daily routines. Sensors collect data for motion, door usage, light levels, and temperature levels. Sensors post readings as text messages to middleware on a Raspberry Pi [20]. The middleware assigns timestamps and sensor identifiers to the readings and stores the resulting sensor “events” locally as well as securely transmitting them to a remote relational database.
Figure 1.
(left) Motion/light sensors and door/temperature sensors are installed in a smart home; (right) the SHiB kit includes sensors, computer, and networking equipment.
III. Iterative Design Round 1: Untrained Clinicians
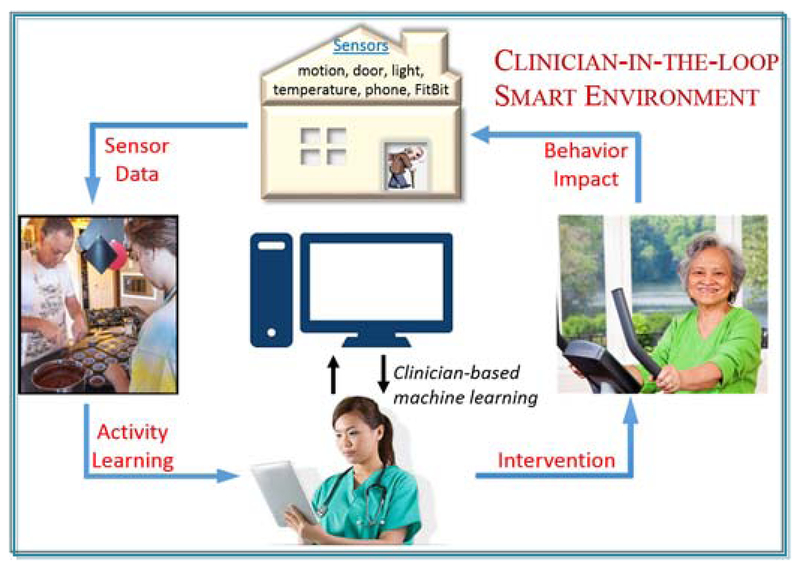
The smart home-based analytics system, called CIL, is designed as part of a clinician-in-the-loop smart home (see Fig. 2). In this approach, data regarding behavior are collected using smart home ambient sensors. Data are analyzed by machine learning algorithms to generate behavior features. The visual behavior analytics are displayed to a remotely-located clinician who regularly uses them to monitor the well-being of the resident. Clinician findings can be used to manually intervene in the case of detected health events or to suggest new healthy behaviors for the resident to adopt.
Fig. 2.
The clinician-in-the-loop smart environment.
Because all visual analytics will be interpreted by clinicians, we involve clinicians in the design of the analytics as part of a participatory design process. Participatory design has been shown to be effective at identifying features that are most relevant to target audiences and increasing acceptance of the technology as a result [21]. This design process was conducted through two rounds. In the first round, experienced nurses enrolled in a graduate informatics nursing course provided feedback on CIL that was iteratively used to improve the system. During the second round, clinicians familiar with smart home data interpretation provided feedback to refine the system and use it for health event detection.
The first round started with an open discussion of smart home technologies and their use for health monitoring. Based on the discussion, 40 nursing students suggested features important for monitoring patient health that would be most useful as part of CIL. Initial smart home-based features were designed based on this discussion.
A. Smart Home Features
Daily smart home features that were identified as clinically useful to our first round of nursing study participants and that could be detected by the smart home included:
Distribution of time spent in different areas of the home
Time spent sleeping
Overall activity level in home
Number of sleep interruptions (i.e., bed toilet transitions)
Because sensors are marked with their corresponding locations in the home and sensor events are timestamped, duration in each area of the home is straightforward to compute. To compute overall activity level, we can tally the number of motion sensor events that occur each day. Ambient sensors are discrete event sensors. As a result, they send a message when there is a change in state. Motion sensors send an “on” message when movement occurs within the sensor’s field of view. The number of such messages thus serves as an estimation of the amount that the resident is moving in the home.
To automatically generate the remaining two features, sleep duration and bed-toilet transitions, CIL relies on automatic activity recognition. Activity recognition maps a sequence of sensor events, Λ=(λ1, λ2,.., λn), onto an activity label, aΛ. These labels provide a way of describing daily behaviors in terms of identifiable activities of daily living. While many diverse approaches have been explored for activity recognition that draw from machine learning techniques such as support vector machines, Gaussian mixture models, decision trees, and probabilistic graphs [22]–[30], many of these approaches also perform activity recognition on pre-segmented data in scripted settings. Clinicians use CIL to identify health events as soon as possible. As a result, activities need to be recognized in near-real-time.
To identify activities as they occur in naturalistic settings, CIL’s activity recognition algorithm, called AR, extracts features from a sliding window that moves over the data as it is collected. AR generates a vector of features that include time-weighted bag-of-sensor counts, time of day, window duration, window entropy, window activity level, most recent resident location, most recent sensor location, and elapsed time since the previous event for each sensor. AR trains a random forest classifier on this data which is both efficient and effective for the task. This method has reported an activity recognition accuracy of 95% for 30 activities, including bed-toilet transition and sleep, in a collection of 30 smart homes [31]. AR labels each sensor event with a corresponding activity label as shown in Fig. 3. The bed-toilet and sleep features are calculated based on this labeled data.
Fig. 3.
Sample sensor events with AR-generated activity label.
B. Round 1 Results
In the first round of participatory design, we presented 13 experienced nurses with paper-based prototype visual displays of one week of data from three different smart homes. Visual displays consisted of bar charts, pie charts, and line graphs for each smart home feature. Each smart home dataset contained a known health event. Participants were asked to provide free-form text-based suggestions for improvement. The participants were randomly assigned to one of 2 design iterations. After each iteration, participant feedback was used to improve the design.
Feedback from this first round of participatory design reflected the need for an interactive display. Specifically, participants wanted to be able to zoom in on selected time windows and compare different features for the selected timeframe. Feedback on the exact type of graphical display was mixed. However, a consistent request was to add a baseline measure for each feature, together with standard deviation lines. This measure would allow clinicians to determine points in time that are unusual and warrant closer inspection.
IV. Iterative Design Round 2: Trained Clinicians
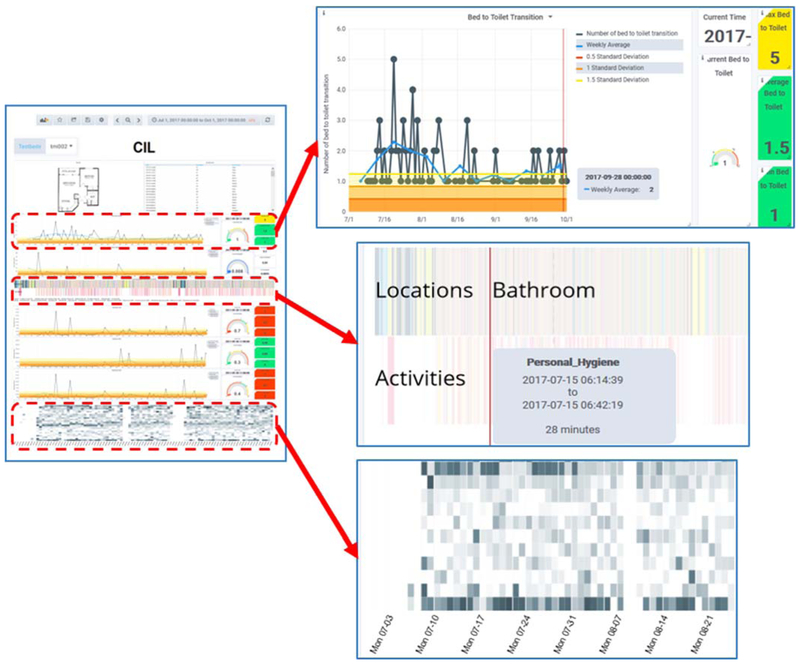
For the second round of iterative design, 7 experienced nurses provided feedback on the design of the CIL visual analytics. Three of the participants also have experience analyzing smart home data. We conducted three rounds of design. For each round, we provided the clinicians with a graphical interface for 3 homes. The final version of the system is shown in Fig. 4. In this system, users can select a testbed (upper left) and period of time (upper right) to observe.
Fig. 4.
(left) CIL interface. (upper right) Expanded view of line graph depicting daily number of bed-toilet transitions, together with rolling baseline. (middle right) Expanded view of time-aligned graph showing distribution of time spent among different activities and home locations. (lower right) Expanded view of activity level heat map.
The main display provides a view of the home’s floorplan and of the raw sensor events for the entire observed time period. In addition, graphs are included that plot values for daytime and nighttime sleep duration, number of sleep interruptions (bed-toilet), time spent in different activities and different areas of the house, and overall activity level. Hovering over any point in a graph pops up a window with more information about that data point. To protect the privacy of smart home residents, access to the interface is password protected.
A. New CIL Features
A clear direction that the clinicians wanted to pursue was for CIL to present the data in a manner that would make understanding sensor events and identifying anomalies easier. Toward that end, the following design elements were added over the three iterations of participatory design:
Baseline for comparison.
To help analyze changes in a person’s behavior over time, clinicians requested that baselines be provided for each feature. The baselines are calculated based either on the first week of data for the home or (as requested by clinicians) on a rolling weekly average. The baseline is graphed together with standard deviation lines. These lines were requested to be indicated with red (0.5 standard deviations), orange (1.0 standard deviation), and yellow (1.5 standard deviations) lines that are calculated based on all of the data collected to date for that home.
Activity heat map.
The clinicians felt that a heat map was a helpful way for them to interpret overall activity level by hour of the day and across multiple days. This is consistent with the findings of Wang et al. [13].
Time-aligned location and activity distribution.
The clinicians observed that activities were particularly interesting if they were performed in unusual locations (e.g., sleeping in a living room recliner rather than a bed may be consistent with breathing difficulties). To highlight this, they requested charts of these two features be aligned over time. The location and activity charts indicate the specific in-home location and activity with a corresponding color. Hovering over a point in the chart brings up a text box with the name of the corresponding location or activity.
Walking speed.
In this round we used smart home data to calculate walking speed. We focused on nighttime bed-to-toilet and times as they reflect the most direct paths with the fewest number of pauses. Because actual floorplan sizes are not always available, we calculate a relative walking speed based on the time required to navigate between these points.
Clear use of colors and indicators.
In addition to plotting each feature over the entire time window, dials were included on the right side of each line graph that indicated the current (most recent data point) value of the feature along with the maximum, minimum, and average value of the feature for the time period. Values are color coded per clinician request. Consistent with colors used for traffic indicators, nearness to the baseline for the feature is represented by green, moderate distance is represented by yellow, and far distance is represented by red.
Another feature we added in this round is activity segmentation. While AR labels each sensor event with a corresponding activity class, it does not indicate the beginning or ending of each activity occurrence, which is needed to calculate activity durations. To segment sensor events into individual activity occurrences and calculate activity durations, we utilize an unsupervised change point detection algorithm called SEP [32] to detect changes in the time-ordered data indicating transitions between activities. The segment that occurs between change points is assigned the majority-label activity class.
B. Quantitative Feedback
To obtain quantitative feedback on CIL design, 7 participants (3 with smart home experience and 4 nurses randomly assigned to one iteration of analytics) completed the 19-item Post-Study System Usability Questionnaire (PSSUQ) [33] survey. The questionnaire assessed users’ perceived satisfaction with the system based on three factors (system usability, information quality, interface quality) as well as overall satisfaction. For each question, response choices ranged from 1 (indicating satisfaction) to 7 (indicating dissatisfaction).
Table 1 summarizes the ratings of the 7 participants before and after refinement of the CIL design. We use a permutation-based analysis [34] to obtain statistical significance result with 100 shuffles and found that all of the pre-refinement and post-refinement comparisons are statistically significant (p<.05). For the participants with smart home experience, the overall mean for the PSSUQ total, information quality, and interface quality scores decreased, suggesting some improvement in overall usability, quality of information provided by CIL, and quality of the interface across design iterations. For participants without smart home experience, means for the PSSUQ total, system usability, and information quality were lower for participants who evaluated a post-refinement iteration than for those who evaluated the initial CIL design. This is consistent with the conclusion that some improvement was made between the design iterations. An interesting observation is that the overall decrease in mean values is greater for the participants without smart home experience than for the ones with smart home experience. One possible interpretation is that increasing familiarity with the system actually caused clinicians to raise their quality standard. The consistent decrease in means assessing satisfaction with the system for all of the participants suggests that the visualizations may not be unreasonably difficult to learn to interpret, even for individuals who have limited experience analyzing sensor data.
Table I.
Mean PSSUQ scores from participants (lower scores indicate greater satisfaction with cil).
| PSSUQ Scores, Participants with Smart Home Experience | ||
|---|---|---|
| Factor | Pre-Refinement | Post-Refinement |
| Overall | 3.7 | 3.6 |
| System usability | 3.8 | 3.9 |
| Information quality | 3.4 | 3.2 |
| Interface quality | 4.2 | 3.8 |
| PSSUQ Scores, Participants with no Smart Home Experience | ||
| Factor | Pre-Refinement | Post-Refinement |
| Total | 5.2 | 3.3 |
| System usability | 5.2 | 3.4 |
| Information quality | 5.3 | 3.4 |
| Interface quality | 1.8 | 2.7 |
C. Clinical Validation
The long-term goal of this work is to use the CIL visual analytics to aid clinicians in remote monitoring of patients and timely detection of health events that require intervention. To determine the usefulness of CIL for detection of health events, we asked the three trained clinicians to indicate potential health events that provoked an action. Specifically, they indicated times during the observation period at which, based on the observed visual analytics, they would recommend taking an action such as a phone call or home visit.
Three homes were monitored for this purpose. Home #1 housed a male in the age range 80–90 who has Parkinson’s Disease. In addition, he has an enlarged prostate and severe thirst due to Sjorgren’s disorder. This condition makes him constantly thirsty (with dry mouth). Effects of these conditions can be observed in the smart home data and include sleeping in the living room recliner rather than bed if there is too much pain, frequent trips to the kitchen for water, and frequent trips during the night to the bathroom.
Home #2 housed a female in the age range 80–90 with diagnosis of COPD, atrial fibrillation, suprapubic catheter, and chronic constipation. Because of her chronic conditions she spends a long period of time in the bathroom each morning maintaining her suprapubic catheter and a long period of time in the bathroom during evenings due to constipation or pain associated with her prolapsed uterus.
Home #3 housed a female in the age range 90–100. This individual has a diagnosis of a tumor on her spinal column which affects her legs. At the beginning of the observation period she could walk slowly with a walker. However, over the course of the observation period she transitioned to using a wheelchair. She receives help in the mornings with physical therapy, getting dressed, fixing breakfast, and grooming her hair.
To obtain ground truth information on participant overall health and descriptions of health events, clinicians visited participants on a weekly basis. During the visits, clinicians asked residents about their overall health, perform clinical assessments, and discussed doctor visits and health events that occurred during the previous week.
For our validation of CIL analytics, we examined three components of clinician responses. First, we analyzed time periods that the clinician identified as needing a phone visit or home visit response. We calculated the amount of agreement between the three clinicians for these time periods. We then analyzed the clinician observations based on the pre-existing chronic conditions for each participant. Third, we determined the percentage of actionable detected health events that were also identified by participants as health events or changes in health status. Finally, we analyze the clinician’s overall observations about the patient’s health to determine the consistency between the clinicians’ interpretations and the patient’s diagnosis.
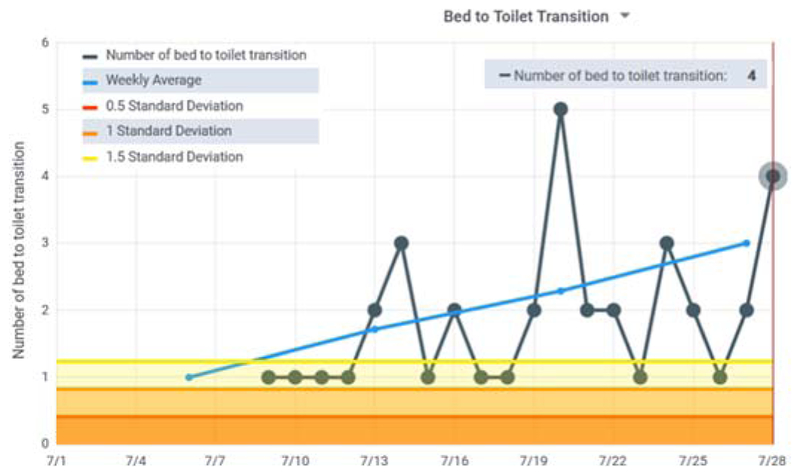
As Table 2 indicates, for Home #1 the clinicians agreed on 67.5% of the days that would warrant a phone call or visit. In fact, 2 of the 3 clinicians differed in their list by only 1 day, while the third clinician listed all of these days along with other possible concerning days. Fig. 5 shows the CIL bed-to-toilet graph for one of the identified periods of time. During this time the number of sleep interruptions for toileting increased while the overall sleep total decreased. These types of patterns occurred frequently during the observed period due to Sjogren’s dry mouth syndrome and an enlarged prostate. The patterns were distinctive enough that the clinicians’ overall assessment was possible prostate issues resulting in a large number of night toileting and low nighttime sleep in bed due to possible pain. One clinician also wondered about possible dementia due to wandering around the home at night. While the patient-provided explanation was a need for frequent drinks of water, this was a consistent observation.
Table II.
Identified days with possible health events for each observed smart home.
| Home | Observed days | Actionable days | Agreement |
|---|---|---|---|
| 1 | 289 | 40 | 67.5% |
| 2 | 54 | 21 | 42.9% |
| 3 | 54 | 24 | 91.7% |
Figure 5.
Bed to toilet transition graph for Home #1. Many of the most recent readings are above the 1.5 standard deviation line and the rolling average is increasing.
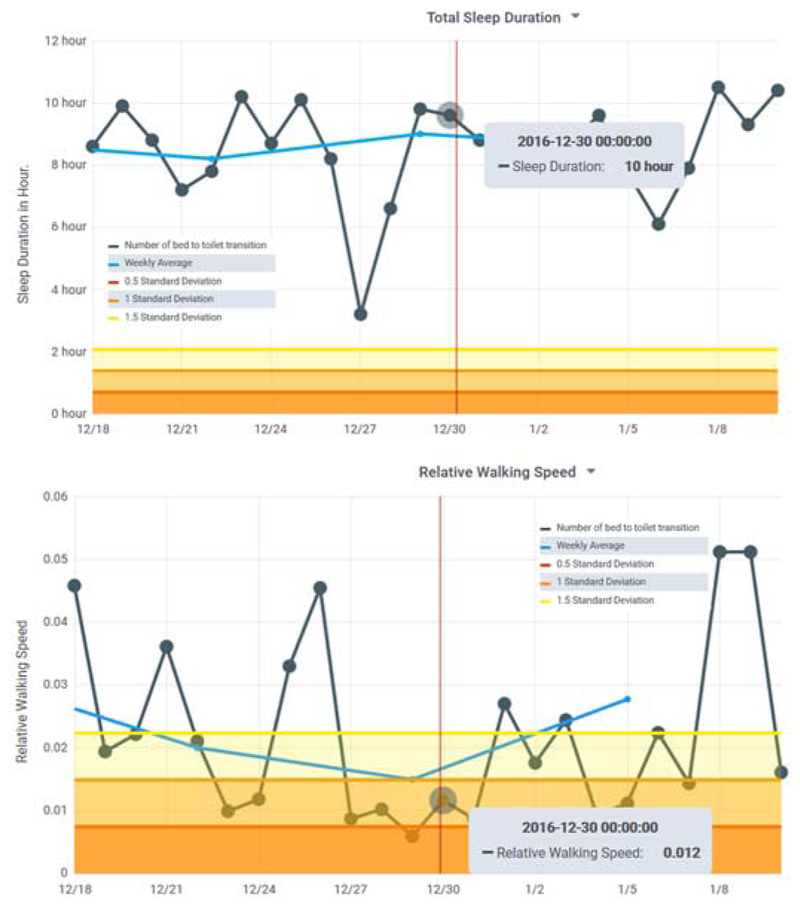
For Home #2, 2 of the clinicians identified the same 6 days of concern. The third clinician listed 6 of those days plus additional time periods of interest. All three focused on a period at the end of December which was marked by a greater than normal daily amount of sleep and little time out of the house. The clinicians overall assessment was possible depression. This was consistent with the patient’s own assessment of situational depression during the holiday period. Fig. 6 shows sleep data during this period of concern as well as the corresponding walking speed data.
Figure 6.
(top) Total sleep is unusually high and (bottom) relative walking speed is unusually low during the Home #2 time period noted by clinician participants.
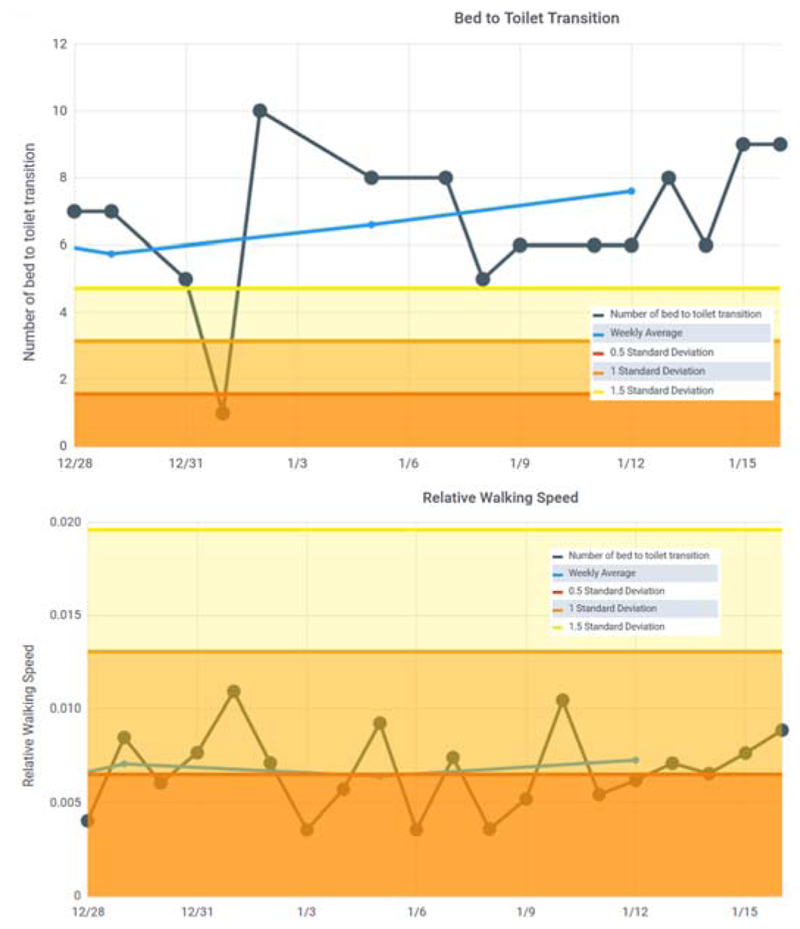
For Home #3, the primary concerns were decreased walking speed over the observed time period as well as occasional increases in bathroom visit durations. The variation in walking speed was difficult f or the clinicians to assess remotely. This was consistent with the patient’s increased difficulties in walking and subsequent transition to using a wheelchair. The clinicians did observe high levels of activity overall, which may be reflected not only by the patient moving about the house but also by the visitors that helped the patient on a daily basis.
V. Discussion
This study revealed how valuable it is to involve a target group in participatory design of a visual interface that will be used for remote health monitoring. One participant pointed out that “It is clinically meaningful to not only know something like how much a person is sleeping at night, but how much are they sleeping relative to their baseline.” The participants felt that CIL is valuable at highlighting patterns so clinicians can detect changes in these patterns.
At the same time, we discovered a great amount of individual variability in participant preferences and suggestions, a number of which contradicted each other. We found that refining CIL in response to the consistent suggestions improved satisfaction overall. However, where suggestions conflicted, there may be a need to customize the interface for individual participants. There may also be a need to prioritize information. Participants required an average of 71 minutes to become familiar with the visual analytics and identify concerns. Future studies can analyze how time spent analyzing data on a regular basis may decrease with usage.
The current clinician-in-the-loop visual interface is limited by the type of information that can be provided by smart home sensors and activity labelers. For example, while the smart home may be able to detect that a person is cooking, there is currently not a straightforward method of determining the quality of the resident’s diet, which is information that clinicians requested. In addition, distinguishing activities between the person of interest and visitors in the home is currently challenging.
VI. Conclusions
Ongoing research indicates that ambient sensor data embedded into smart homes can be used to monitor patient activities and to identify behavior changes that are related to important health events. This study demonstrates that the information can be translated from sensors to visual analytics for use by a clinician-in-the-loop smart home. The iterative design of CIL resulted in an interactive visual interface. This interface aided participants in identifying changes in behavior over time, to identify health concerns, and to make decisions about appropriate actions to take.
Future work may include generating alternative versions of CIL for different end-user groups that facilitate different sensor-based features and interaction mechanisms. A specific use case is to design, evaluate and utilize clinician-in-the-loop visual analytics for wearable sensors, particularly for real-time detection and interpretation of health events [35].
Figure 7.
(top) Bed-toilet transitions is higher than normal, which may partly account for (bottom) relative walking speed being dramatically lower than normal for Home #3.
Acknowledgements
The authors would like to thank all of the nurse participants for their contribution to this study. This research is supported in part by the National Institutes of Health under Grants R25EB024327 and R01NR016732.
This work was supported in part by NIA Grant R25 AG946114 and R01NR016732.
Contributor Information
Alireza Ghods, School of Electrical Engineering & Computer Science, Washington State University, Pullman, W 99164 (alireza.ghods@wsu.edu)..
Kathleen Caffrey, Department of Psychology, Washington State University, Pullman, WA 99164 (kathleen.caffrey@wsu.edu)..
Beiyu Lin, School of Electrical Engineering & Computer Science, Washington State University, Pullman, W 99164 (beiyu.lin@wsu.edu)..
Kylie Fraga, Department of Psychology, Washington State University, Pullman, WA 99164 (kylie.fraga@wsu.edu)..
Roschelle Fritz, Department of Nursing, Washington State University, Vancouver, WA 98686 (shelly.fritz@wsu.edu)..
Maureen Schmitter-Edgecombe, Department of Psychology, Washington State University, Pullman, WA 99164 (schmitter-e@wsu.edu)..
Chris Hundhausen, EECS, Washington State University, Pullman, Washington United States (hundhaus@wsu.edu).
Diane J. Cook, School of Electrical Engineering & Computer Science, Washington State University, Pullman, WA 99164 (djcook@wsu.edu)..
References
- [1].National Council on Aging, “Healthy aging facts,” 2018.. [Google Scholar]
- [2].Healthy People, “Older adults,” 2018.. [Google Scholar]
- [3].Health Resources & Services, “Health workforce projections,” 2018.. [Google Scholar]
- [4].Wilson C, Hargreaves T, and Hauxwell-Baldwin R, “Smart homes and their users: A systematic analysis and key challenges,” Pers. Ubiquitous Comput, vol. 19, no. 2, pp. 463–476, 2015. [Google Scholar]
- [5].Chen L, Cook DJ, Guo B, Chen L, and Leister W, “Guest editorial: Special issue on situation, activity, and goal awareness in cyber-physical human-machine systems,” IEEE Trans. Human-Machine Syst, vol. 47, no. 3, 2017. [Google Scholar]
- [6].Cook DJ, Dawadi P, and Schmitter-Edgecombe M, “Analyzing activity behavior and movement in a naturalistic environment using smart home techniques,” IEEE J. Biomed. Heal. Informatics, vol. 19, no. 6, pp. 1882–1892, 2015. [DOI] [PMC free article] [PubMed] [Google Scholar]
- [7].Dawadi P, Cook DJ, and Schmitter-Edgecombe M, “Automated clinical assessment from smart home-based behavior data,” IEEE J. Biomed. Heal. Informatics, 2016. [DOI] [PMC free article] [PubMed] [Google Scholar]
- [8].Dawadi P, Cook DJ, and Schmitter-Edgecombe M, “Automated cognitive health assessment using smart home monitoring of complex tasks,” IEEE Trans. Syst. Man, Cybern. Part B, 2012. [DOI] [PMC free article] [PubMed] [Google Scholar]
- [9].Dawadi P, Cook DJ, Schmitter-Edgecombe M, and Parsey C, “Automated assessment of cognitive health using smart home technologies,” Technol. Heal. Care, vol. 21, no. 4, pp. 323–343, 2013. [DOI] [PMC free article] [PubMed] [Google Scholar]
- [10].Dawadi P, Cook D, and Schmitter-Edgecombe M, “Modeling patterns of activities using activity curves,” Pervasive Mob. Comput, 2015. [DOI] [PMC free article] [PubMed] [Google Scholar]
- [11].Dawadi P, Cook DJ, and Schmitter-Edgecombe M, “Longitudinal functional assessment of older adults using smart home sensor data,” IEEE J. Biomed. Heal. Informatics, 2015. [Google Scholar]
- [12].Nielsen J, “Iterative user interface design,” IEEE Comput, vol. 26, no. 11, pp. 32–41, 1993. [Google Scholar]
- [13].Wang S, Skubic M, and Zhu Y, “Activity density map visualization and dissimilarity comparison for eldercare monitoring,” IEEE Trans. Inf. Technol. Biomed, vol. 16, no. 4, pp. 607–614, 2012. [DOI] [PubMed] [Google Scholar]
- [14].Le T, “Visualizing smart home and wellness data,” in Handbook of Smart Homes, Health Care and Well-Being, 2017, pp. 567–577. [Google Scholar]
- [15].Kim Y et al. , “Prescribing 10,000 steps like aspirin: Designing a novel interface for data-driven medical consultations,” in CHI Conference on Human Factors in Computing Systems, 2017, pp. 5787–5799. [Google Scholar]
- [16].Kutzik D, “Behavioral monitoring to enhance safety and wellness in old age,” in Gerontechnology, Kwon S, Ed. Springer, 2016, pp. 291–309. [Google Scholar]
- [17].Mazza R, Introduction to Information Visualization. London: Springer-Verlag, 2009. [Google Scholar]
- [18].Zulas AL, “Modifying smart home to smart phone notifications using reinforcement learning algorithms,” Washington State University, 2017. [Google Scholar]
- [19].Hu Y, Tilke D, Adams T, Crandall A, Cook DJ, and Schmitter-Edgecombe M, “Smart home in a box: Usability study for a large scale self-installation of smart home technologies,” J. Reliab. Intell. Environ, vol. 2, pp. 93–106, 2016. [DOI] [PMC free article] [PubMed] [Google Scholar]
- [20].Pi Raspberry, “Teach, learn and make with raspberry pi,” 2018.. [Google Scholar]
- [21].Teixeira L, Saavedra V, Ferreira C, and Santos BS, “Using participatory design in a health information system,” in Annual International Conference of the IEEE Engineering in Medicine and Biology Society, 2011, pp. 5339–5342. [DOI] [PubMed] [Google Scholar]
- [22].Bulling A, Blanke U, and Schiele B, “A tutorial on human activity recognition using body-worn inertial sensors,” ACM Comput. Surv, vol. 46, no. 3, pp. 107–140, 2014. [Google Scholar]
- [23].Reiss A, Stricker D, and Hendeby G, “Towards robust activity recognition for everyday life: Methods and evaluation,” in Pervasive Computing Technologies for Healthcare, 2013, pp. 25–32. [Google Scholar]
- [24].Lara O and Labrador MA, “A survey on human activity recognition using wearable sensors,” IEEE Commun. Surv. Tutorials, vol. 15, no. 3, pp. 1192–1209, 2013. [Google Scholar]
- [25].Fang H, Si H, and Chen L, “Recurrent neural network for human activity recognition in smart home,” in Chinese Intelligent Automation Conference, 2013, pp. 341–348. [Google Scholar]
- [26].Liu L, Peng Y, Liu M, and Huang Z, “Sensor-based human activity recognition system with a multilayered model using time series shapelets,” Knowledge-Based Syst, vol. 90, pp. 138–152, 2015. [Google Scholar]
- [27].Brenon A, Portet F, and Vacher M, “Using statistico-relational model for activity recognition in smart home,” in European Conference on Ambient Intelligence, 2015. [Google Scholar]
- [28].Nguyen LT, Zeng M, Tague P, and Zhang J, “I did not smoke 100 cigarettes today! Avoiding false positives in real-world activity recognition,” in ACM Conference on Ubiquitous Computing, 2015, pp. 1053–1063. [Google Scholar]
- [29].Rafferty J, Nugent CD, Liu J, and Chen L, “From activity recognition to intention recognition for assisted living within smart homes,” IEEE Trans. Human-Machine Syst, vol. 47, no. 3, pp. 368–379, June 2017. [Google Scholar]
- [30].Gayathri KS, Easwarakumar KS, and Elias S, “Probabilistic ontology based activity recognition in smart homes using Markov Logic Network,” Knowledge-Based Syst, vol. 121, pp. 173–184, April 2017. [Google Scholar]
- [31].Cook D, “Learning setting-generalized activity models for smart spaces,” IEEE Intell. Syst, vol. 27, no. 1, pp. 32–38, 2012. [DOI] [PMC free article] [PubMed] [Google Scholar]
- [32].Aminikhanghahi S, Wang T, Cook DJ, and Fellow I, “Real-Time Change Point Detection with application to Smart Home Time Series Data,” IEEE Trans. Knowl. Data Eng, p. to appear, 2018. [DOI] [PMC free article] [PubMed] [Google Scholar]
- [33].Lewis JR, “Psychometric evaluation of the post-study system usability questionnaire: The PSSUQ,” in Human Factors Society 36th Annual Meeting, 1992, pp. 1259–1263. [Google Scholar]
- [34].Ojala M and Garriga CG, “Permutation tests for studying classifier performance,” J. Mach. Learn. Res, vol. 11, pp. 1833–1863, 2010. [Google Scholar]
- [35].Ghasemzadeh H, Panuccio P, Trovato S, Fortino G, and Jafari R, “Power-aware activity monitoring using distributed wearable sensors,” IEEE Trans. Human-Machine Syst, vol. 44, no. 4, pp. 537–544, 2014. [Google Scholar]


