Abstract
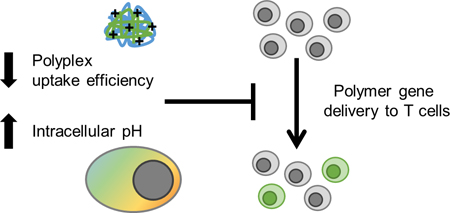
T cells have emerged as a therapeutically-relevant target for ex vivo gene delivery and editing. However, most commercially available reagents cannot transfect T cells and designing cationic polymers for non-viral gene delivery to T cells has resulted in moderate success. Here, we assess various barriers to successful gene transfer in the Jurkat human T cell line and primary human T cells. Using two polymers previously developed in our group, we show that uptake is one barrier to gene delivery in primary human T cells but is not predictive of successful gene delivery. We then probe intracellular pathways for barriers to gene transfer including endosomal acidification, autophagy, and immune sensing pathways. We find that endosomal acidification is slower and not as robust in human T cells compared to the model HeLa human cell line commonly used to evaluate cationic polymers for gene delivery. These studies inform the future design of cationic polymers for non-viral gene delivery to T cells, specifically, to rely on alternative endosomal release mechanisms than pH-triggered release.
Graphical Abstract
Introduction
Genetically engineered T cells have recently gained FDA approval for treatment of various leukemias and lymphomas and additional subsets of T cells are being developed as therapeutics for autoimmune diseases.1–4 The manufacturing of genetically modified patient T cells creates a need for a flexible, inexpensive system that can deliver multiple cargoes in vitro, especially as combinatorial gene editing techniques are emerging as important tools for improving safety and therapeutic efficacy.5,6 Currently, the two FDA approved engineered T cell therapies rely on lentiviral transduction of cells during production. However, lentiviral vectors are very costly to produce at GMP scale for clinical use and can be a barrier to broad translation.
Cationic polymers, which are used routinely in laboratory settings for gene transfer, can be manufactured readily at clinical scale and formulated with various types of nucleic acid cargo. However, T cells and other blood cells are notoriously difficult to transfect using non-viral vectors, and recent attempts to design cationic polymer gene carriers for T cells has resulted in moderate in vitro efficiency.7–10 In order to design better synthetic gene carriers specifically for T cells, more needs to be known about the current barriers leading to low gene transfer.
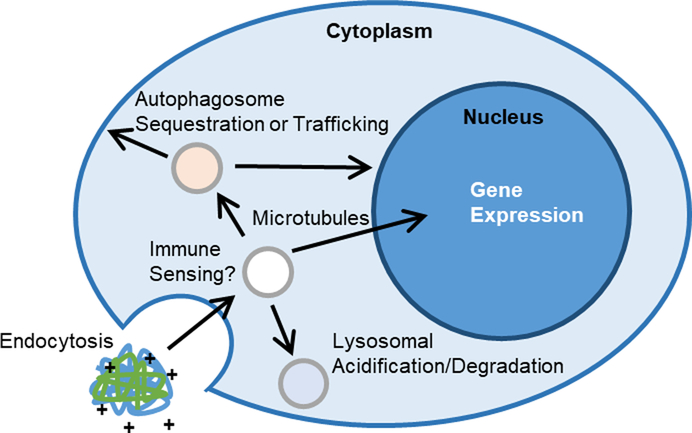
Successful non-viral gene delivery formulations must be internalized in cells, typically by some endocytosis mechanism, escape endosomal vesicles, traffic to the desired subcellular location and release protected nucleic acid cargo (Fig. 1). In addition, polyplexes must overcome multiple cellular defense mechanisms to deliver their genetic cargo to target cells. The most widely studied trafficking path of polyplexes through cells starts with endocytosis into an early endosome.11,12 This is followed by either endosomal escape or degradation from fusion to an acidic lysosome. The success of transfection reagents such as polyethylenimine (PEI), poly(2-dimethylaminoethyl methacrylate) (pDMAEMA), and poly(beta-amino ester) (PBAE) is credited to their buffering capacity and “proton sponge effect” in early endosomes, promoting endosomal lysis before acidification.13–17
Fig. 1.
Schematic of barriers and intracellular trafficking steps that have been studied or hypothesized for cationic polymer gene complexes.
There is also the potential that polyplexes could be recognized by immune sensing pathways like the family of interferon-induced transmembrane (IFITM) proteins that inhibit viral entry and endosomal escape by promoting cholesterol accumulation and endosomal stiffening.18,19 Additionally, polyplexes can be sequestered in tubulovesicular autophagosomes that accumulate near the nucleus, or be trafficked along microtubules to the nucleus.20,21
Recently, we developed two cationic polymers that can successfully transfect several adherent cell lines and are also effective for in vivo gene delivery to both the lungs and brain.22–25 These two polymers contain the same DNA-condensing monomer unit 2-dimethylaminoethyl methacrylate (DMAEMA) but differ in polymer architecture (linear vs. comb) and designed endosomal release mechanism (pH-triggered release vs. proton sponge effect) (Fig. S1 †). The virus-inspired polymer for endosomal release (VIPER) has a linear di-block polymer design that shields a membrane lytic peptide, melittin, in a stable micelle that disassembles at pH 6.4, promoting endosomal escape.24 The comb polymer (Comb) has a poly(2-hydroxyethyl methacrylate) back-bone with pDMAEMA branches, resulting in the comb architecture. Unexpectedly, VIPER, the polymer that exhibited less toxicity and higher gene transfer efficiencies compared to Comb in all other cell types tested, exhibited poor transfection efficiency in the Jurkat T cell line and in primary T cells.9
Here, we probe multiple potential barriers to successful gene delivery in T cells from a polymer design and biological perspective. From a polymer design perspective, we investigate the importance of uptake efficiency and kinetics of intracellular pH to identify key parameters in polymer design for gene delivery to T cells. From a biological perspective, we explore the roles of immune sensing pathways and autophagy as potential barriers to cationic polymer gene delivery to T cells. We find that uptake of polyplexes is reduced and intracellular acidification of endocytic compartments is slowed in primary T cells, which indicate cell type-specific barriers to non-viral gene delivery.
Experimental
Materials
Rapamycin, 3-methyladenine, polyclonal goat anti-rabbit IgG HRP antibody, and polyclonal goat anti-mouse IgG HRP antibody were purchased from Sigma Aldrich. YOYO-1 iodide, pHrodo red dextran 10,000 MW, pHrodo green dextran 10,000 MW, and intracellular pH calibration buffer kit, were purchased from ThermoFisher. Monoclonal mouse anti-human IFITM1 antibody (clone: 5B5E2), polyclonal rabbit anti-human IFITM2 antibody, and polyclonal rabbit anti-human IFITM3 antibody were purchased from Proteintech. Polyclonal rabbit anti-human IC3B antibody was purchased from Cell Signaling Technology. Alexa Fluor 488 donkey anti-rabbit antibody purchased from Jackson ImmunoResearch. Zombie Violet and Zombie NIR fixable viability stains were purchased from Biolegend.
PmaxGFP plasmid (Lonza) and pCMV-Luc plasmid (Photinuspyralis luciferase under control of the cytomegalovirus (CMV) enhancer/promoter) were transformed into XL10 Gold ultracompetent cells (Stratagene) and single colonies were grown up in an overnight culture. Plasmids were purified using the NucleoBond Xtra Maxi Endotoxin Free kit (Macherey-Nagel), purity and concentration were quantified by Nanodrop and a diagnostic gel.
Cell culture conditions
Jurkat cells (human T lymphocyte line) were a kind gift from Prof. Michael Jensen (Seattle Children’s Research Institute). Jurkat cell lines overexpressing IFITM 1, 2, or 3, and backbone vector were a generous gift from Prof. Shan-Lu Liu (Ohio State University). All Jurkat cell lines were maintained in RPMI-1640 media supplemented with 10% fetal bovine serum (v/v). Cells were passaged 18–24 hours prior to transfection.
HeLa cells were maintained in DMEM media supplemented with 10% fetal bovine serum and 1% penicillin-streptomycin (v/v). Cells were seeded at 50,000 cells in 500 μL of media in a 24 well-plate 18–24 hours prior to transfection.
Cryopreserved vials of healthy donor primary human T lymphocytes, isolated by magnetic activated cell sorting, were generously provided by Juno Therapeutics. T cells were cultured at 1.5×10⁶ cells/mL in X-VIVO 15 media (Lonza) supplemented with 2% KnockOut serum replacement (ThermoFisher) and premium grade recombinant human IL-21 at 10 ng/mL (Miltenyi). Cells were activated with CD3/CD28 Human T Activator beads (DynaBeads, Gibco) 40–48 hours prior to transfection. All cells were maintained in a 37 °C and 5% CO2 humidified incubator.
Western blotting
Cells (5–10×106) were washed twice in PBS via centrifugation at 500 ×g for 3 minutes. Cell pellets were flash frozen in dry ice and stored at −80 °C prior to use. Cell pellets were thawed and resuspended in cell lysis buffer (20 mM Tris-HCl pH 8.0, 137 mM NaCl, 10% glycerol, 1% NP-40, 2 mM EDTA, cOmplete Protease Inhibitor from 25× stock, and 1 mM PMSF) and incubated at 4 °C with intermittent vortexing for 1 hour. Supernatant from samples centrifuged at 15,000 ×g for 20 minutes at 4 °C were quantitated via micro BCA protein assay kit (ThermoFisher).
Equivalent masses of protein extract (40 μg) from each cell line were mixed with 2× Laemmli sample buffer and run on a 4–20% Mini-PROTEAN TGX precast protein gel (Bio-Rad). Proteins were transferred to Immobilon-P PVDF membrane (Millipore Sigma) and subjected to standard immunoblotting with primary IFITM 1, 2, or 3 antibodies at a 1:5000, 1:1000, or 1:1000 dilution, respectively. Goat anti-mouse or goat anti-rabbit HRP-labeled secondary antibodies were used at a 1:5000 dilution. Immunoblots were developed with SuperSignal West Pico Chemiluminescent Substrate kit (Pierce) and imaged using a Xenogen IVIS imager (PerkinElmer).
Polymer and polyplex preparation
Comb-shaped pHEMA25-g-pDMAEMA16 polymer (Comb) and virus-inspired polymer for endosomal release (VIPER) were synthesized as reported previously by controlled living radical polymerization.22,23 Polymers were diluted from protonated stocks into sterile molecular grade H2O to desired amine concentration for transfection studies.
For uptake studies, plasmid DNA was labeled with YOYO-1 iodide nucleic acid stain. DNA and YOYO-1 were mixed at a dye to base pair ratio of 1:50 and incubated for 1 hour at room temperature prior to polyplex formation.
Polyplexes were formed immediately before use in uptake and transfection studies. Plasmid was diluted from a stock solution to 0.1 μg/μL with sterile molecular grade H2O or 150 mM NaCl. Polymer solution was added to plasmid in an equivalent volume at an amine-to-phosphate ratio (N/P) of 5, vortexed briefly, and allowed to complex for 20–30 minutes at room temperature.
Polyplex uptake and transfection
Transfection conditions were based on previously optimized and reported conditions for each cell type.9,23,26 Jurkat and primary human T cells were washed once with sterile phosphate buffered saline (PBS) via centrifugation at 500×g for 3 minutes and resuspended in Opti-MEM media (Gibco). Jurkats were plated at 1×10⁶ cells/mL in 250 μL (2.5×10⁵ cells) and primary T cells were plated at 3×10⁶ cells/mL in 250 μL (7.5×10⁵ cells). HeLa cells were washed once with sterile PBS before the addition of 250 μL of Opti-MEM media. All cells were stored in a 37 °C and 5% CO2 humidified incubator during polyplex formation.
YOYO-1 labeled pCMV-luc plasmid DNA was used for polyplex formation in uptake studies and unlabeled pMAX-GFP plasmid DNA was used in transfection studies. Polyplexes were added dropwise to wells, with 1, 1.5, and 2 μg equivalent of DNA (20, 30, and 40 μL of polyplex) added to HeLa, Jurkat, and primary T cells, respectively. Cells were incubated with polyplexes for 4 hours prior to flow cytometry analysis for uptake studies, or 700 μL complete media addition and additional 48-hour culture period for transfection studies.
Autophagy regulation treatments
Autophagy regulators 3-methyladenine (3-MA) and rapamycin were used in transfection studies as previously described.27 Briefly, 3-MA was supplemented to Opti-MEM medium at 5 or 10 mM during the 4 hour transfection period. The complete media added after transfection did not contain 3-MA. In rapamycin transfection studies, rapamycin at 10 or 100 nM was added to the complete culture media of cells 2 hours prior to transfection. Rapamycin was removed from cells during the 4-hour transfection period, and supplemented in the complete media at the same concentrations for the 48-hour culture period prior to flow cytometry analysis.
pH-sensitive dextran uptake
HeLa cells were seeded the same for dextran uptake studies as transfection studies, detailed above, washed once in PBS, and maintained in 180 μL of live cell imaging solution (LCIS, 140 mM NaCl, 2.5 mM KCl, 1.8 mM CaCl2 1 mM MgCl2, 20 mM HEPES, pH 7.4) during uptake studies. Jurkats and primary T cells were washed once in PBS and seeded at 2.22×10⁶ cells/mL in 90 μL in a 96 well plate (2×10⁵ cells per well) in LCIS.
At designated times (15, 30, 60, 120, or 240 minutes prior to analysis), pHrodo labeled dextran was added to designated wells to a final concentration of 20 μg/mL and cells were incubated at 37 °C. Prior to flow cytometry analysis, HeLa cells were lifted using 0.05% trypsin (ThermoFisher) and Jurkat and Primary T cells were washed once with 0.05% trypsin. Cells were washed twice with LCIS and resuspended in either LCIS or pH clamping buffers (pH 5.5, 6.5, and 7.5) supplemented with the ionophores valinomycin and nigericin. After a 5-minute incubation at 37 °C, cells were analyzed by flow cytometry (Fig. S2).
LC3B staining and confocal microscopy
Cells were plated and treated with polyplexes as described above. 30–60 minutes after transfection, cells were resuspended in culture medium and transferred to poly-D-lysine coated glass slides. Cells adhered for 1 hour prior to being fixed in 4% paraformaldehyde for 15 minutes at room temperature. Cells were stained with rabbit anti-human LC3B antibody at 1:200 dilution followed by staining with Alexa Fluor 488 donkey anti-rabbit secondary antibody at 1:400 dilution and DAPI. Coverslips were mounted using PVA/DABCO mounting medium and imaged the on a Leica SP8X scanning confocal microscope.
Flow cytometry
Cells were transferred to a U-bottom 96-well plate. In transfection studies, cells were washed once with PBS and stained with a 1:500 dilution of Zombie Violet or Zombie NIR fixable viability stain. For both transfection and uptake studies, cells were washed twice with PBS with 1% bovine serum albumin (BSA, Miltenyi) via centrifugation 500×g for 3 minutes. For transfection studies, cells were resuspended in 200 μL of PBS with 1% BSA. In uptake studies, cells were resuspended in 200 μL of 0.04% trypan blue in PBS to quench extracellular fluorescence. Cells were immediately analyzed on either a MacsQuant Analyzer (Miltenyi) or Attune NxT (ThermoFisher) flow cytometer. At least 1×10⁴ events were collected for each sample.
FlowJo software (FlowJo, LLC) was used for data analysis, with serial gating (Fig. S3). Transfection efficiency was measured as the percentage of live cells expressing GFP fluorescence.
Statistical analysis
Results are given as mean value ± standard deviation (SD). Two-way ANOVA with Dunnett’s multiple comparisons posthoc analysis were performed in GraphPad Prism software (Graph Pad Software).
Results and discussion
Polyplex uptake and transfection reduced in primary T cells
Cell binding and uptake of cationic polyplexes by endocytosis is the initial step in successful transfection.28 To quantify polyplex uptake in cells, we used the fluorescent dimeric cyanine dye YOYO-1 to label plasmid DNA prior to polyplex formation with Comb or VIPER. The percentage of HeLa, Jurkat, or activated primary human T cells that had taken up polyplexes after a 4-hour incubation was quantified by flow cytometry (Fig. 2A). Extracellular fluorescence of associated, but not internalized, polyplexes was quenched with trypan blue.28 In Jurkat and HeLa cells, VIPER polyplexes were detected in a higher percentage of cells. The uptake efficiency for Comb and VIPER polyplexes was similar between HeLa and Jurkat cell lines, but significantly lower in primary human T cells. The total uptake of polyplexes was also quantified using the median fluorescent intensity of cells treated with YOYO-1 labeled DNA polyplexes (Fig. S4). As we previously reported, Comb and VIPER polyplexes transfect HeLa cells, while VIPER polyplexes showed very low transfection levels (1.5% and 3.5%) in Jurkat and primary T cells respectively (Fig. 2B).9 Overall transfection levels were also lower in primary T cells.
Fig. 2.
(A) Uptake and (B) transfection efficiency of Comb and VIPER polyplexes in HeLa, Jurkat, and primary T cells. Uptake efficiencies were expressed as percentage of YOYO-positive cells. Transfection efficiencies are expressed as percentage of GFP-positive cells. Data are shown as mean ± SD (n=3; 2-way ANOVA with Sidak’s multiple comparisons, *p<0.05, **p<0.01, ****p<0.0001).
These results indicate that overall lower uptake of polyplexes into primary T cells may contribute to low transfection efficiencies compared to other cell types. Future polymers designed for T cell delivery should be screened and optimized for uptake efficiency. However, it is clear that intracellular trafficking represents a significant challenge for polyplex mediated gene delivery to T cells, as VIPER polyplexes had greater accumulation in Jurkat T cells but still had lower transfection efficiency.
Endosomal acidification is delayed in T cells
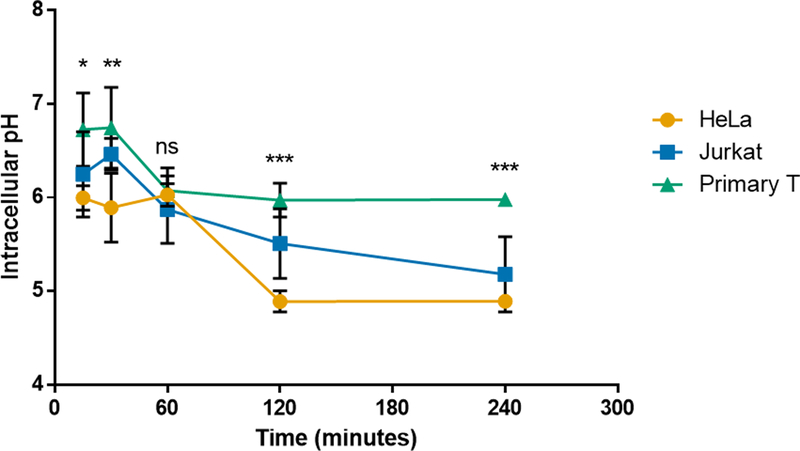
VIPER’s potent pH-selective membrane-lytic activity is responsible for its high transfection efficiency in most cultured cells.23,25 Since uptake efficiency of VIPER was not predictive of gene expression, we hypothesized that the acidification of endosomal compartments in Jurkat and primary T cells may be delayed compared to the cell lines that VIPER efficiently transfects. To test this hypothesis, we measured the average intracellular pH of HeLa, Jurkat, and primary human T cells over a 4-hour period to understand the intracellular environment during transfection studies. We used 10 kDa dextran labeled with the pH-sensitive pHrodo dye (ThermoFisher) for these studies to measure the average pH in various endosomal compartments at various time points. Dextran is a well-established molecule used to study fluid-phase endocytosis pathways, as well as endosomal and lysosomal trafficking and pH.29–31 In addition, dextran does not have buffering capacity like pDMAEMA polymers, resulting in more accurate intracellular pH measurements.32
Standard curves were created for each cell type by fixing the intracellular pH at 5.5, 6.5, or 7.5 using buffers supplemented with ionophores and measuring the fluorescent intensity of internalized dextran at that pH (Fig. S5). The experimental intracellular pH was calculated using a linear regression at each time point, which accounts for the variation in total dextran uptake over time. The intracellular pH of HeLa cells rapidly dropped to 6 within 30 minutes (Fig. 3). However, the intracellular pH of primary T cells was much higher than HeLa cells at every time point tested, except for 60 minutes, and did not get below pH 6 even 4 hours after initial uptake. The intracellular pH of Jurkat cells was only significantly higher than HeLas at the 2 hour time point (p<0.05), and only significantly lower than primary T cells at 4 hours (p<0.01). The pH-sensitive monomer in VIPER has a pKa of 6.4 and therefore the micelle core of the polyplex may not reach a low enough pH to dissociate within primary human T cells.33 In addition, the higher intracellular pH of primary T cells may also decrease the overall efficiency of DMAEMA due to lower osmotic pressure and reduced proton pump-mediated endosomal escape. The intracellular pH of Jurkat cells did drop below pH 6 within 1 hour, which suggests additional intracellular mechanism contribute to the inefficiencies of VIPER in this cell line.
Fig. 3.
Intracellular pH of HeLa, Jurkat, and primary human T cells over time. Intracellular pH at various incubation times as measured using pHrodo labeled dextran and flow cytometry. Data are shown as mean ± SD (n=3; 2-way ANOVA with Tukey’s multiple comparisons, *p<0.05, **p<0.01, ***p<0.001).
This study suggests that the future design of polymer gene delivery systems for human T cells should include endosomal release mechanisms that can be effective without relying on rapid acificiation to lower pH (below 6). For example, a pH-sensitive monomer with a higher pKa value could be used in place of the diisopropylaminoethyl methacrylate (DIPAMA) and potentially be triggered in the endosomal compartment of T cells.34,35
Immune sensing IFITM proteins play minor role in modulating transfection
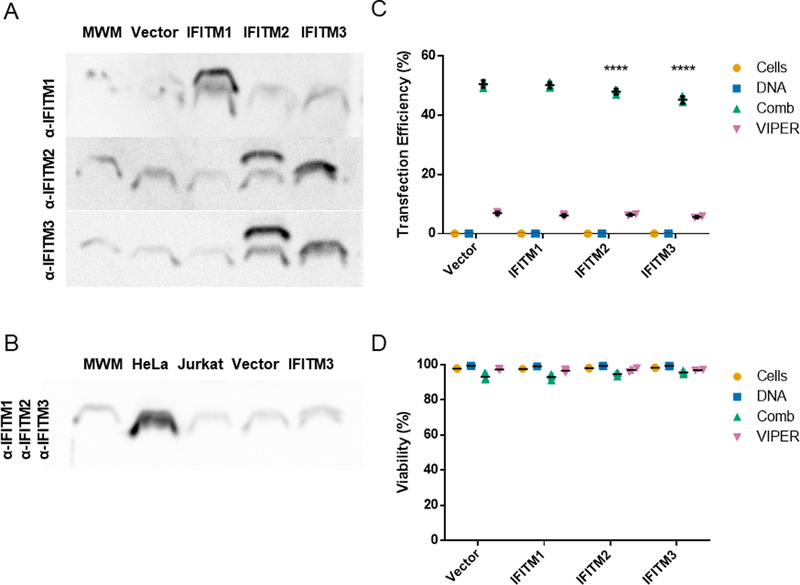
Polyplexes and viruses share similar intracellular paths through cells. The interferon induced transmembrane (IFITM) family of proteins (IFITM 1, 2, and 3) has been implicated as a sensing pathway that reduces viral uptake and escape from endosomes.19 IFITM3 specifically recruits cholesterol to the endosomal membrane, increasing membrane stiffness and reducing endosomal escape. While these proteins are not solely expressed in immune cells, they have been shown to play a role in the viral infectivity of T cell lines. We used IFITM overexpressing Jurkat T cell lines developed by Shan-Lu Liu’s laboratory to evaluate the impact of these proteins on non-viral gene delivery.18 Expected overexpression in each cell line was confirmed by western blot (Fig. 4A). The antibodies for IFITM2 and IFITM3 have known cross-reactivity and stained both the IFITM2 overexpressing and IFITM3 overexpressing Jurkat cell lines. Important to note, when we performed western blots for all three IFITM proteins on cell extracts from HeLa cells and three Jurkat cell lines, the HeLa cell extracts had the highest IFITM expression (Fig. 4B). This data alone suggests that IFITM proteins do not significantly inhibit polymer-mediated gene delivery, as both Comb and VIPER can efficiently transfect HeLa cells.
Fig. 4.
IFITM protein expression analysis and polymer transfections of pmaxGFP plasmid in IFITM overexpressing Jurkat T cell lines. (A) Protein expression of individual IFITM 1, 2, and 3 proteins in Jurkat cell lines visualized by western blot with 20 kDa molecular weight marker (MWM). (B) Protein expression of IFITM 1, 2, and 3 in HeLa, parental Jurkat, vector only, and IFITM3 overexpressing Jurkat cells. (C) Transfection efficiency and (D) viability of cationic polymers in Jurkat human T cell lines overexpressing IFITM 1, 2, or 3. Transfection efficiencies are expressed as percentage of GFP-positive cells. Data are shown as mean ± SD (n=3; 2-way ANOVA with Dunnett’s multiple comparisons, ****p<0.0001).
Transfection efficiency and viability were compared to the vector transduced Jurkat cell line that does not overexpress any of the IFITM proteins (Fig. 4 C & D). Jurkat cell lines overexpressing IFITM 2 and IFITM 3 did have a slight (~5–10%), but statistically significant, reduction in transfection efficiency when Comb was used as the gene delivery agent. Similar percent reductions of 5–10% were observed in IFITM 2 and IFITM 3 overexpressing cells when VIPER was used as the gene delivery agent. Additional mechanistic studies would be needed to understand the interactions between IFITM proteins and cationic polymer gene carriers. From this study, IFITM proteins were ruled out as a critical barrier to improving gene delivery in T cells.
Enhancing autophagy reduces transfection efficiency in T cells
Autophagy is a conserved process within mammalian cells that plays the important role of sequestering and degrading proteins aggregates, damaged organelles, and intracellular pathogens.36 Autophagy is an integral process in T cells, tied to homeostasis, mitochondrial clearance, memory formation, proliferation, and survival.37–41 Studies have shown that polyplex uptake can increase autophagosome formation in cells, and that polyplexes are sequestered in autophagosomes, a suspected non-productive destination that prevents nuclear transport.20,42,43 We fixed primary human T cells 30 or 60 minutes after transfection, stained with an anti-LC3B antibody that labels autophagosomes, and imaged by confocal microscopy (Fig. S6). Widespread punctate staining was observed, confirming the presence of significant autophagosomes in T cells during transfection.
Small molecule inhibitors and activators of autophagy have been investigated as tools to modulate in vitro non-viral gene delivery. The Wang group evaluated the mTOR-dependent autophagy inhibitor 3-methyladenine (3-MA) and activator rapamycin in PEI mediated gene delivery to murine fibroblasts.27 They found that increasing mTOR-dependent autophagy with rapamycin improved transfection efficiency by 20%, whereas inhibiting autophagy with 3-MA reduced transfection efficiency by 80%. The same trends held for the Yang group who evaluated the impact of mTOR-dependent and -independent regulators of autophagy on siRNA knockdown efficiency using chitosan as a gene carrier to a human lung cancer cell line.44 While the mechanism for this phenomenon has not been determined, the Yang group proposes that mTOR-independent autophagosomes, rather than mTOR-dependent, are responsible for polyplex sequestration and reduced transfection efficiency. They posit the “LC3 competing” hypothesis, that by increasing mTOR-dependent autophagy with Rapamycin, mTOR-independent autophagosome formation and polyplex sequestering is reduced.
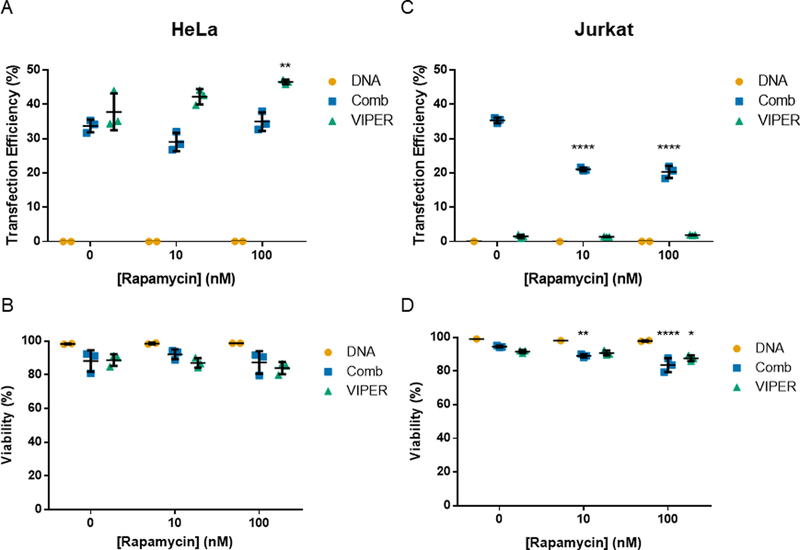
We evaluated these two small molecule regulators of autophagy in the Jurkat human T cell line and the HeLa human cervical endothelial cell line using VIPER and Comb as gene carriers. Rapamycin, an autophagy activator, increased transfection efficiency of VIPER delivered plasmid DNA in HeLa cells at the highest concentration tested (100 nM) (Fig. 5). However, rapamycin treatment reduced transfection efficiency and viability in Jurkat cells transfected using Comb. These results are opposite of what has been observed in many adherent cell lines tested, but is likely due to the mTOR pathway regulating many different facets of T cell function outside of autophagy activation.45 The potential benefits of rapamycin treatment on autophagosome cycling during transfection were most likely offset by the G1 arrest and anergy induction also caused by mTOR signaling in T cells.12,46
Fig. 5.
Transfection of HeLa and Jurkat cells with rapamycin treatment. (A & B) Transfection efficiency and viability of HeLa cells transfected with Comb or VIPER at varying rapamycin concentrations. (C & D) Transfection efficiency and viability of Jurkat cells transfected with Comb or VIPER polymer at varying rapamycin concentrations. Transfection efficiencies are expressed as percentage of GFP-positive cells. Data are shown as mean ± SD (n=3, 2-way ANOVA with Dunnett’s multiple comparisons test, * p<0.05, ** p<0.01, **** p<0.001).
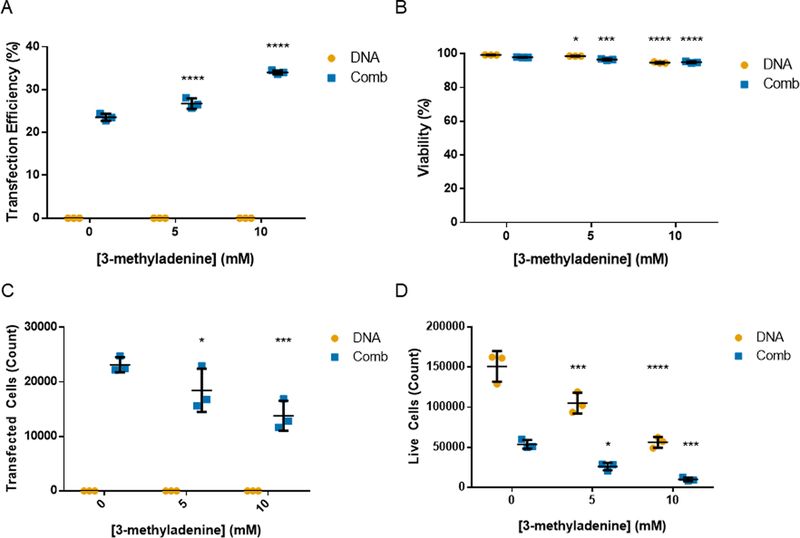
We then tested the autophagy inhibitor 3-MA in Jurkat T cell transfections with Comb to test if inhibiting autophagy would increase transfection efficiency (Fig. 6). Treatment with 3-MA did increase transfection efficiency as measured by percent of cells expressing GFP and had only a slight impact on the viability of cells. To capture a more accurate relative number of transfected cells, we analyzed the same volume of cultured cells for each condition via the Attune flow cytomer that can analyze a set volume of suspended cells. When expressed in terms of total number of cells, treatment with 3-MA significantly reduced the number of live cells, with or without polyplex treatment, and reduced the total number of transfected cells. This potential gain in transfection efficiency is negated by the total reduction in cell number also caused by 3-MA treatment. These results are corroborated by previous studies that report a reduction in murine CD4+ T cell proliferation with 3-MA treatment.47
Fig. 6.
Transfection of Jurkats with 3-MA treatment. (A) Transfection efficiency, (B) viability, (C) transfected cell count, and (D) live cell count of Jurkat cells transfected with Comb at varying 3-methyladenine concentrations. Transfection efficiencies are expressed as percentage of GFP-positive cells. Data are shown as mean ± SD (n=3; 2-way ANOVA with Dunnett’s multiple comparisons, * p<0.05, *** p<0.001, ****p<0.0001).
These results demonstrate that T cells have autophagosomes during the early stages of polyplex transfections and that manipulating autophagy does impact polyplex gene delivery in the Jurkat T cell line. However, the mTOR and PI3K pathways that these small molecules inhibit also control other important pathways key to T cell function and survival. Small molecule regulators of autophagy are likely not a viable method for improving polyplex gene delivery to T cells.
Conclusions
Developing efficient non-viral gene delivery platforms specifically for T cells is an emerging area of interest. The current nature of manufacturing genetically modified T cells lends itself well to non-viral gene delivery agents. The genetic modification process happens ex vivo, removing the need to design gene carriers for in vivo stability or organ specificity. The transfection conditions can be specifically tuned in the ex vivo environment to promote successful delivery, like brief culture periods in serum-free media. In addition, chemically defined polymer transfection agents have reduced lot-to-lot variability compared to viruses yielding a more predictable gene transfer process. In order to design more efficient gene carriers specifically for T cells, there is a need to better understand the unique barriers to gene delivery in T cells.
These studies begin to identify key barriers to efficient gene delivery with cationic polymers in T cells. Our data indicate that the family of interferon induced transmembrane (IFITM) proteins do not play as significant of a role in preventing polyplex endosomal escape as they do in preventing viral escape. We do observe that autophagosomes are present in T cells during transfection. However, applying previously developed methods for modulating autophagy with small molecules to increase transfection efficiency had a deleterious effect on T cell growth and viability.
Both the poor polyplex uptake efficiency and higher endosomal pH of primary T cells dictated the success of the two polymer gene carriers tested. Primary T cells take up polyplexes less efficiently than HeLa or Jurkat cell lines. In addition, the acidification of endosomes in primary T cells is slower and less severe than HeLa cells, reducing the gene transfer efficiency of polymers designed for pH-triggered endosomal escape. These finding motivate the design of new gene carrier systems that can be tailored to these biological traits of T cells.
Supplementary Material
Acknowledgements
We thank Dr. Tsai-Yu Lin (Immune Design) and Dr. Heather Gustafson for helpful suggestions and discussion. Confocal microscopy images were taken at the W.M.Keck Center for Advanced Studies in Neural Signaling at the University of Washington with the help of Dr. Heather Gustafson and Dr. Nathaniel Peters. We thank Prof. Shan-Lu Liu for providing the IFITM overexpressing Jurkat cell lines and Prof. Michael Jensen for providing the parental Jurkat cell line. This work was supported by the National Institutes of Health [1R01CA177272, 2R01NS064404]. B.R.O. was supported by a National Science Foundation Graduate Research Fellowship [DGE-1256082].
Footnotes
Electronic supplementary information (ESI) available.
Conflicts of interest
There are no conflicts to declare.
References
- 1.U.S. Food and Drug Administration, BLA Approv. [Google Scholar]
- 2.U.S. Food and Drug Administration, BLA Approv. [Google Scholar]
- 3.McGovern JL, Wright GP and Stauss HJ, Front. Immunol, 2017, 8, 1–6. [DOI] [PMC free article] [PubMed] [Google Scholar]
- 4.Arellano B, Graber DJ and Sentman CL, Discov. Med, 2016, 22, 73–80. [PMC free article] [PubMed] [Google Scholar]
- 5.Eyquem J, Mansilla-Soto J, Giavridis T, van der Stegen SJC, Hamieh M, Cunanan KM, Odak A, Gönen M and Sadelain M, Nature, 2017, 543, 113–117. [DOI] [PMC free article] [PubMed] [Google Scholar]
- 6.Morsut L, Roybal KT, Xiong X, Gordley RM, Coyle SM, Thomson M and Lim WA, Cell, 2016, 164, 780–791. [DOI] [PMC free article] [PubMed] [Google Scholar]
- 7.Smith TT, Stephan SB, Moffett HF, McKnight LE, Ji W, Reiman D, Bonagofski E, Wohlfahrt ME, Pillai SPS and Stephan MT, Nat. Nanotechnol, , DOI: 10.1038/nnano.2017.57. [DOI] [PMC free article] [PubMed] [Google Scholar]
- 8.Moffett HF, Coon ME, Radtke S, Stephan SB, McKnight L, Lambert A, Stoddard BL, Kiem HP and Stephan MT, Nat. Commun, 2017, 8, 389. [DOI] [PMC free article] [PubMed] [Google Scholar]
- 9.Olden BR, Cheng Y, Yu JL and Pun SH, J. Control. Release, 2018, 282, 140–147. [DOI] [PMC free article] [PubMed] [Google Scholar]
- 10.Schallon A, Synatschke CV, Jérôme V, Müller AHE and Freitag R, Biomacromolecules, , DOI: 10.1021/bm3012055. [DOI] [PubMed] [Google Scholar]
- 11.Lechardeur D, Verkman AS and Lukacs GL, Adv. Drug Deliv. Rev, 2005, 57, 755–767. [DOI] [PubMed] [Google Scholar]
- 12.Kamiya H, Tsuchiya H, Yamazaki J and Harashima H, Adv. Drug Deliv. Rev, 2001, 52, 153–164. [DOI] [PubMed] [Google Scholar]
- 13.Akinc A, Thomas M, Klibanov AM and Langer R, J. Gene Med, 2005, 7, 657–663. [DOI] [PubMed] [Google Scholar]
- 14.Amin ZR, Rahimizadeh M, Eshghi H, Dehshahri A and Ramezani M, Iran. J. Basic Med. Sci, 2013, 16, 150–156. [PMC free article] [PubMed] [Google Scholar]
- 15.Zhou D, Cutlar L, Gao Y, Wang W, Keeffe-ahern JO, Mcmahon S, Duarte B, Larcher F, Rodriguez BJ, Greiser U and Wang W, Sci. Adv, 2016, 2, e1600102. [DOI] [PMC free article] [PubMed] [Google Scholar]
- 16.Zhou D, Gao Y, Aied A, Cutlar L, Igoucheva O, Newland B, Alexeeve V, Greiser U, Uitto J and Wang W, J. Control. Release, 2016, 244, 336–346. [DOI] [PubMed] [Google Scholar]
- 17.Zhou D, Gao Y, Xu Q, Huang X, Greiser U and Wang W, ACS Appl. Mater. Interfaces, 2016, 8, 34218–34226. [DOI] [PubMed] [Google Scholar]
- 18.Yu J, Li M, Wilkins J, Ding S, Swartz TH, Esposito AM, Zheng YM, Freed EO, Liang C, Chen BK and Liu SL, Cell Rep, 2015, 13, 145–156. [DOI] [PMC free article] [PubMed] [Google Scholar]
- 19.Amini-Bavil-Olyaee S, Choi YJ, Lee JH, Shi M, Huang IC, Farzan M and Jung JU, Cell Host Microbe, 2013, 13, 452–464. [DOI] [PMC free article] [PubMed] [Google Scholar]
- 20.Roberts R, Al-Jamal WT, Whelband M, Thomas P, Jefferson M, Van Den Bossche J, Powell PP, Kostarelos K and Wileman T, Autophagy, 2013, 9, 667–682. [DOI] [PMC free article] [PubMed] [Google Scholar]
- 21.Vaughan EE and Dean DA, Mol. Ther, 2006, 13, 422–428. [DOI] [PMC free article] [PubMed] [Google Scholar]
- 22.Cheng Y, Wei H, Tan JKY, Peeler DJ, Maris DO, Sellers DL, Horner PJ and Pun SH, Small, 2016, 12, 2750–2758. [DOI] [PMC free article] [PubMed] [Google Scholar]
- 23.Cheng Y, Yumul RC and Pun SH, Angew. Chemie - Int. Ed, 2016, 55, 12013–12017. [DOI] [PMC free article] [PubMed] [Google Scholar]
- 24.Peeler DJ, Thai SN, Cheng Y, Horner PJ, Sellers DL and Pun SH, Biomaterials. [DOI] [PMC free article] [PubMed] [Google Scholar]
- 25.Feldmann DP, Cheng Y, Kandil R, Xie Y, Mohammadi M, Harz H, Sharma A, Peeler DJ, Moszczynska A, Leonhardt H, Pun SH and Merkel OM, J. Control. Release, 2018, 276, 50–58. [DOI] [PMC free article] [PubMed] [Google Scholar]
- 26.Cheng Y, Wei H, Tan JKY, Peeler DJ, Maris DO, Sellers DL, Horner PJ and Pun SH, Small, , DOI: 10.1002/smll.201502930. [DOI] [PMC free article] [PubMed] [Google Scholar]
- 27.Zhong X, Panus D, Ji W and Wang C, Mol. Pharm, 2015, 12, 932–940. [DOI] [PubMed] [Google Scholar]
- 28.Rejman J, Bragonzi A and Conese M, Mol. Ther, 2005, 12, 468–474. [DOI] [PubMed] [Google Scholar]
- 29.Bayer N, Schober D, Prchla E, Murphy RF, Blaas D, Fuchs R and Irol JV, 1998, 72, 9645–9655. [DOI] [PMC free article] [PubMed] [Google Scholar]
- 30.Deriy LV, Gomez EA, Zhang G, Beacham DW, Hopson JA, Gallan AJ, Shevchenko PD, Bindokas VP and Nelson DJ, J. Biol. Chem, 2009, 284, 35926–35938. [DOI] [PMC free article] [PubMed] [Google Scholar]
- 31.Li L, Wan T, Wan M, Liu B, Cheng R and Zhang R, Cell Biol. Int, 2015, 39, 531–539. [DOI] [PubMed] [Google Scholar]
- 32.Lee H, Son SH, Sharma R and Won Y, 2011, 844–860. [DOI] [PubMed]
- 33.Zhu L, Powell S and Boyes SG, J. Polym. Sci. Part A Polym. Chem, 2015, 53, 1010–1022. [Google Scholar]
- 34.Wang C, Wang Y, Li Y, Bodemann B, Zhao T, Ma X, Huang G, Hu Z, Deberardinis RJ, White MA and Gao J, Nat. Commun, 2015, 6, 1–11. [DOI] [PMC free article] [PubMed] [Google Scholar]
- 35.Luo M, Wang H, Wang Z, Cai H, Lu Z, Li Y, Du M, Huang G, Wang C, Chen X, Porembka MR, Lea J, Frankel AE, Fu Y-X, Chen ZJ and Gao J, Nat. Nanotechnol, 2017, 12, 1–13. [DOI] [PMC free article] [PubMed] [Google Scholar]
- 36.Bento CF, Renna M, Ghislat G, Puri C, Ashkenazi A, Vicinanza M, Menzies FM and Rubinsztein DC, Annu. Rev. Biochem, 2016, 85, 685–713. [DOI] [PubMed] [Google Scholar]
- 37.Jia W, Pua HH, Li Q-J and He Y-W, J. Immunol, 2011, 186, 1564–74. [DOI] [PMC free article] [PubMed] [Google Scholar]
- 38.Xu X, Araki K, Li S, Han J, Ye L, Tan WG, Konieczny BT, Bruinsma MW, Martinez J, Pearce EL, Green DR, Jones DP, Virgin HW and Ahmed R, Nat. Immunol, 2014, 15, 1152–1161. [DOI] [PMC free article] [PubMed] [Google Scholar]
- 39.Pua HH, Dzhagalov I, Chuck M, Mizushima N and He Y-W, J. Exp. Med, 2007, 204, 25–31. [DOI] [PMC free article] [PubMed] [Google Scholar]
- 40.Walsh CM and Edinger AL, Immunol. Rev, 2010, 236, 95–109. [DOI] [PMC free article] [PubMed] [Google Scholar]
- 41.Pua HH, Guo J, Komatsu M and He Y-W, J. Immunol, 2009, 182, 4046–55. [DOI] [PubMed] [Google Scholar]
- 42.Man N, Chen Y, Zheng F, Zhou W and Wen LP, Autophagy, 2010, 6, 449–454. [DOI] [PubMed] [Google Scholar]
- 43.Remaut K, Oorschot V, Braeckmans K, Klumperman J and De Smedt SC, J. Control. Release, 2014, 195, 29–36. [DOI] [PubMed] [Google Scholar]
- 44.Song W, Ma Z, Zhang Y and Yang C, Acta Biomater, 2017, 1–9. [DOI] [PubMed] [Google Scholar]
- 45.Powell JD and Delgoffe GM, Immunity, 2010, 33, 301–311. [DOI] [PMC free article] [PubMed] [Google Scholar]
- 46.Golzio M, Teissié J and Rols MP, Biochim. Biophys. Acta - Biomembr, 2002, 1563, 23–28. [DOI] [PubMed] [Google Scholar]
- 47.Whang MI, Tavares RM, Benjamin DI, Debnath J, Malynn BA, Whang MI, Tavares RM, Benjamin DI, Kattah MG, Advincula R, Nomura DK, Debnath J, Malynn BA and Ma A, Immunity, 2017, 46, 405–420. [DOI] [PMC free article] [PubMed] [Google Scholar]
Associated Data
This section collects any data citations, data availability statements, or supplementary materials included in this article.


