Abstract
Neurons in primary visual cortex are strongly modulated both by stimulus contrast and by fluctuations of internal inputs. An important question is whether the population code is preserved under these conditions. Changes in stimulus contrast are thought to leave the population code invariant, whereas the effect of internal gain modulations remains unknown. To address these questions we studied how the direction-of-motion of oriented gratings is encoded in layer 2/3 primary visual cortex of mouse (with C57BL/6 background, of either sex). We found that, because contrast gain responses across cells are heterogeneous, a change in contrast alters the information distribution profile across cells leading to a violation of contrast invariance. Remarkably, internal input fluctuations that cause commensurate firing rate modulations at the single-cell level result in more homogeneous gain responses, respecting population code invariance. These observations argue that the brain strives to maintain the stability of the neural code in the face of fluctuating internal inputs.
SIGNIFICANCE STATEMENT Neuronal responses are modulated both by stimulus contrast and by the spontaneous fluctuation of internal inputs. It is not well understood how these different types of input impact the population code. Specifically, it is important to understand whether the neural code stays invariant in the face of significant internal input modulations. Here, we show that changes in stimulus contrast lead to different optimal population codes, whereas spontaneous internal input fluctuations leave the population code invariant. This is because spontaneous internal input fluctuations modulate the gain of neuronal responses more homogeneously across cells compared to changes in stimulus contrast.
Keywords: brain states, mouse visual cortex, population codes, two-photon calcium imaging, visual contrast
Introduction
Contrast invariance of orientation or direction tuning functions, i.e., the preservation of tuning function shape across contrasts, is a fundamental property of visual neurons (Sclar and Freeman, 1982; Skottun et al., 1987). This suggests that the brain may use the same groups of cells to extract orientation or direction information across different visual contrasts. Accordingly, Busse et al. (2009) compared population responses across contrasts after averaging cell responses according to preferred orientation (Busse et al., 2009) and concluded that the population code for orientation is preserved across contrasts. Later studies (Graf et al., 2011; Berens et al., 2012) similarly found that neuronal pooling weights for orientation/direction decoding across contrasts are substantially preserved. A consensus has therefore been reached that the population code is preserved across contrasts. However, some other recent studies (Peirce, 2007; Sani et al., 2013) have reported that some cortical cells show larger responses to a range of intermediate contrasts than at 100% contrast; these intermediate-contrast selective cells may in theory encode more information at intermediate contrasts. These observations suggest that it is worth revisiting the concept of contrast invariance to ask specifically whether the population of cells that convey information about orientation or direction of motion remains identical across visual contrasts.
Neural responses are not modulated only by external stimuli. Internal inputs also modulate neural responses under identical external stimulation (Zohary et al., 1994; Shadlen and Newsome, 1998) changing neural population activity (Niell and Stryker, 2010; Polack et al., 2013; Ecker et al., 2014; Reimer et al., 2014; McGinley et al., 2015a,b; Vinck et al., 2015). In fact, Fiser et al. (2004) have argued that most variability in the brain is because of internal activity, while sensory inputs evoke relatively small modulations superimposed on internally driven activity. These observations raise the question how the brain is able to maintain a stable representation of sensory information in the face of large internal fluctuations of neuronal activity. In particular, how internal fluctuations affect the population code for orientation or direction of motion remains an open question.
Below, we addressed these questions by studying the neural population code for moving oriented gratings in layer 2/3 of mouse area V1. We found that the performance of decoders remains essentially unchanged when they are trained and tested across different levels of spontaneously fluctuating internal input, whereas it degrades substantially when they are trained and tested across different stimulus contrasts. The substantial degradation of direction-of-motion decoders trained at different contrasts occurs because the identity of the cells that contribute most to direction decoding is not contrast invariant, but instead changes with contrast. We conclude that: (1) cortical circuits are optimized to maintain the stability of the neural code in the face of spontaneously fluctuating internal inputs, and (2) contrast invariance of the neural code fails substantially at the population level.
Materials and Methods
Animal preparation
All experiments and animal procedures were performed in accordance with guidelines of the National Institutes of Health for the care and use of laboratory animals and were approved by the IACUC at Baylor College of Medicine.
In our study, nine C57BL/6 wild-type and seven Thy1-GCaMP (Thy1-GCaMP6s 4.3; Dana et al., 2014) mice of either sex were used, which were 4–8 weeks old at the time of surgery. During surgery, mice were anesthetized with 1–1.5% isoflurane, and Baytril (5 mg/kg), carprofen (5 mg/kg), and dexamethasone (1.5 mg/kg) were administered subcutaneously to minimize brain swelling (Holtmaat et al., 2009). After attaching a headpost on the skull, a 3-mm-diameter craniotomy was made over the center of visual cortex; 2.7 mm lateral to the midline and 1.5 mm posterior to the bregma. For the nine wild-type mice, GCaMP6s virus (AAV5.Syn.Flex.GCaMP6s.WPRE.SV40, Penn Vector Core) was injected within the craniotomy using a Drummond Nanojector (∼90 nl per site) after diluting 4–8 times with sterile saline. Then, the craniotomy was covered with a glass window.
Imaging
Two-photon experiments were performed 3–4 weeks after the surgery, when GCamp6s expression is optimal. For Thy1-GCaMP mice, the experiments were conducted at 1–2 and/or 10 d after surgery without viral injection.
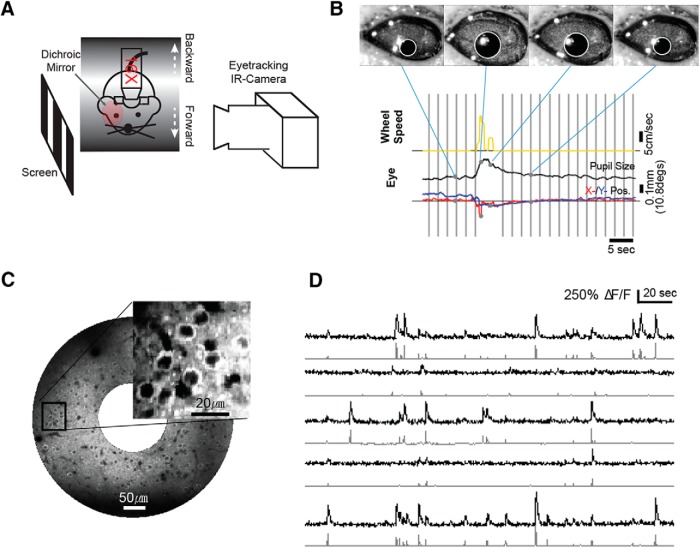
Populations of 50–200 cells located 150–250 μm below the pia were imaged with water-immersion objective lenses (see Fig. 1A,C), either 20×, 0.95 NA (Olympus), or 16×, 0.8 NA (Nikon), in a modified Prairie Ultima IV two-photon laser scanning microscope (Bruker), fed by a Chameleon Ultra II laser (Coherent). Cell populations were imaged at frame rates of ∼7 Hz. Depending on imaging depth, the laser power was kept between 20 mW at the surface and 50 mW at depths <200 μm, at 910 nm wavelength.
Figure 1.
Experimental setup. A, Schematic of experiment setup for awake and sedated animals. Eye tracking was performed for awake animals. B, Monitoring of behavioral state during visual stimulus presentation. Top, Single frames of the pupillometry acquisition video at four time points during the experiment. Bottom, Time-series plots of pupil radius (black), pupil position (x, red; y, blue), and wheel rotation speed (yellow). Gray shades represent the stimulus presentation period of the trials selected for the analysis (trials occurring during movement were excluded; see Materials and Methods). C, Mean fluorescence image from a FOV that expresses GCaMP6s. Inset, Enlarged view from the indicated rectangle. D, Examples of fluorescence traces (top) and corresponding deconvolved spike train activity (bottom).
For experiments (n = 19) with sedated animals (n = 11), 0.05 mg/kg of fentanyl and 0.5 mg/kg dexmedetomidine were injected (Hofer et al., 2006). Imaging starts 20 min following the injection, when animals are sedated and unconscious.
All the experiments were performed after verifying that neuronal population imaged responded to our visual stimulation though a brief retinotopy.
Visual stimulation
Visual stimuli were generated in MATLAB and displayed using Psychtoolbox (Brainard, 1997). Drifting at 2 Hz, square-wave gratings at 0.04 cycles/° were presented for 500 ms followed by an interstimulus interval of 1.5 s during which a full-field gray screen at the same mean luminance was presented. All trials (100–200 trials/condition) were pseudorandomly interleaved. The stimuli were presented on an LCD monitor (Koolertron) at 60 Hz frame rate, positioned 8 cm in front of the right eye, centered at 45 degrees clockwise from the mouse's body axis. The visual angle of the screen spanned 56° elevation and 86° azimuth. The screen was gamma-corrected, and the mean luminance level used was 85 cd/m2. In some early experiments (n = 8), another screen (DELL 2408WFP, Dell) was used, of which visual angle spanned 54° (elevation) × 78°, at the mean luminance level of 80 cd/m2 after gamma correction.
For 28 imaging sessions, which were imaged in different field-of-views (FOVs) from 11 sedated and 6 awake animals, gratings moving in 4 directions (−15° or −10°, 0°, 30°, and 90°) were presented randomly interleaved at 100%, 40% contrast, 100–200 trials per condition per session. For 12 of 28 sessions, 20% contrast was also used.
To assess contrast-dependent population codes for a small stimulus size, we performed nine imaging sessions from additional five sedated animals. For these experiments, a small grating stimuli (i.e., 15° radius) moving to 3 directions (−30°, 30°, and 60°) were presented randomly interleaved at 100%, 30% contrast. The grating stimuli were presented on the aggregate receptive centers of cells imaged within an FOV.
Occasional experiments included grating stimuli spanning the full range of directions (0–330°) at 30° intervals presented pseudorandomly interleaved at 100 or 40% Michelson contrast (Michelson, 1927). Under these conditions, which were used to calculate full tuning functions, each stimulus was presented 30 times.
Monitoring animal behavior
Animal behavior was monitored during awake experiments by tracking wheel rotation and recording ipsilateral eye movements (Fig. 1A,B). While the mouse head was restrained, the mouse was free to move forward or backward on the rotating wheel during experiments. The wheel rotations were measured with an incremental encoder with a resolution of 2500 cycles/revolution (Motel 15T, Encoder Product Company). Eye movements were monitored through a dichroic mirror (FM02, Thorlabs), which was placed between the visual stimulation screen and the mouse eye, using an infrared camera (GC660, Allied Vision Technologies) at 30 frames/s (Fig. 1A). Behavioral data acquisition was synchronized with the presentation of the visual stimulus and the acquisition of imaging frames (Fig. 1B).
Data analysis
Preprocessing.
Movies were x–y-motion-corrected by comparing image frames to the reference image with a subpixel registration method (Guizar-Sicairos et al., 2008). For data from sedated animals, the average of the first 100 image frames was used as the reference image. For the awake data, 100 image frames for which no wheel movements appeared were used. For cell selection, a circular disk or annulus was manually defined to cover the viral expression over a cell body (Chen et al., 2013). After high-pass filtering to get rid of slow signal drifts (cutoff frequency = 0.05 Hz), we corrected the neuropil contamination of the fluorescence signal (F) at the soma by subtracting the mean fluorescence of an adjacent neuropil patch annulus (extending from 7 to 20 μm away from the cell body center), Fn, as follows: Fcorrect = F − S × Fn (Kerlin et al., 2010; Chen et al., 2013; Lee et al., 2017), where S = 0.65 similar to other studies (Chen et al., 2013; Dana et al., 2014) using GCamP6 virus.
Estimation of spike rates.
To estimate the spike rate of each cell, the preprocessed fluorescence signal was normalized within that cell body, pixel by pixel, by calculating (F − F0)/F0 (i.e., ΔF/F). For each pixel, F0 was defined as the mean fluorescence values over the time-series of that pixel. Spike rates were then estimated by applying a method (Lee et al., 2017) we recently developed. Briefly, this method was based on a sparse non-negative linear regression model to estimate spike rates associated with the calcium fluorescence ΔF/F signal by assuming linear calcium dynamics with a time constant, which was adapted from (Chen et al., 2013), to represent the decay time of fluorescence signal in the cell body expressing GCaMP6s (see examples of the deconvolved data in Fig. 1D).
The linear relationship between fluorescence signal reflecting calcium dynamics and estimated spike was given as follows:
where C is a multipixel Matrix of (time-samples × pixels) of ΔF/F signals, P is a convolution matrix of (time-samples × time-samples) that generate the typical calcium dynamics from an spike-rate vector of (time-samples × 1), n, and a is a spatial filter vector of (pixels × 1) that applies to across pixels used in the cell body. The superscript, T, represent the transpose of vector. The convolution matrix was constructed by using the time constant (Chen et al., 2013) for GCaMP6s signal.
With constraining a ≥ 0 for the spatial filter and n ≥ 0 for spike rates, the objective function was given as follows:
where k1 and k2 are the parameters that were automatically optimized while minimizing the objective function (Lee et al., 2017). We then find optimal a and n that minimize the cost function, where n yields the estimated spike rates for that cell.
Measuring visual responses.
For each cell, visual response was calculated trial-by-trial as the increase of the mean ΔF/F signal across pixels corresponding to the cell body that occurs within the first 500 ms of visual stimulation (compared with the 500 ms immediately preceding the onset of the stimulus). The mean contrast-evoked responses of each cell were calculated by averaging all trial responses for that cell in each contrast, for 100 and 40% contrasts, respectively. To be included in subsequent analysis, the contrast-evoked response of a cell had to be >5% at either contrast. In the results we present, “all cells” refers to all the visually responsive cells that pass this criterion.
For selected cells, single-trial responses were calculated for each trial as the average spike response from a four-frame window closely matching the visual stimulus duration. For awake animals, the window computed for the trial response was the same as the window for visual stimulation. For sedated animals, it was centered to the peak of the average visual response (Fig. 2I), as the time course of visually evoked responses were equal to or <1 frame (i.e.,<∼150 ms) prolonged in sedated animals (Haider et al., 2013).
Figure 2.
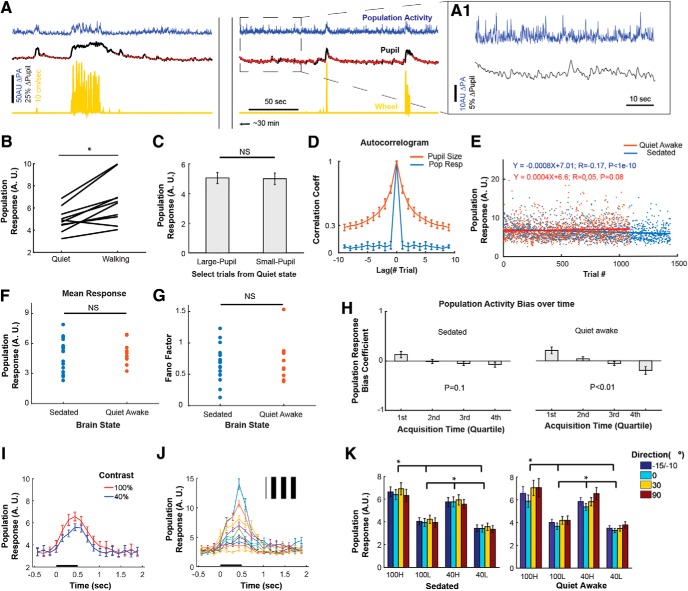
Modulation of neuronal population response by spontaneous internal input and by stimulus contrast. A, Example of population activity (PA; blue), pupil radius (black), and locomotion speed (yellow; forward/backward: ±) during visual stimulation lasting ∼40 min. Red dots over pupil traces denote trials included in the analysis, during quiet awake state. The arbitrary unit (a.u.), which denotes spike rates, is commensurate with the percentage dF/F (Eq. 1). The pupil size radius is normalized to the horizontal eyelid length. PA is clearly modulated during physiological changes such as locomotion or pupil dilation. PA is also modulated in absence of overt behavior changes as shown in the dashed rectangle, shown in expanded from in A1. B, Population response to visual stimulation during quiet versus walking states (>20 cm/s). p < 0.01, Wilcoxon signed rank test. C, Population response to visual stimulation during “large” versus “small” pupil size. The pupil size for each trial was defined as the mean pupil size during visual stimulation of the trial. Large versus small pupil trials consist of the trials that belong to the upper versus the lower half of the distribution of pupillary radius across trials, respectively. Note that pupillary changes are compared only for periods of quiet wakefulness (see Materials and Methods). Not significant in Wilcoxon signed rank test. D, Autocorrelogram of pupil size and population response across trials only for quiet wakeful periods. The autocorrelogram was calculated after subtracting the mean of each signal. Mean ± SEM across awake sessions (n = 10 FOVs) for B–D. E, Example of population responses over trials from a sedated and an awake animal, respectively. During both the brain states, population responses spontaneously fluctuate in a similar extent (i.e., ∼ 5–10 a.u. and few >10 a.u.) and stable over trials (i.e., very small temporal decay). F–H, Comparison of PA during sedation (n = 18) versus quiet wakefulness (n = 10) periods. Mean population response (F) and Fano factor (G). Wilcoxon rank sum tests are used in F and G. H, Population response bias as a function of acquisition time. x-axis: quartile in acquisition time. y-axis: 1 and −1 represent complete-biases by having all trials within each quartile with high and low population activity levels (high: 50% largest trials; low: the remaining), respectively. 0 denoted un-bias between high versus low PAL. Statistical test: Kruskal–Wallis test. Mean ± SEM (n = 18, 10 FOVs for sedated and awake sessions). The maximum mean bias within each acquisition quartile is <0.2, reflecting small changes of population response over time. I, Mean population response to stimulus contrast in a single FOV. The mean population response was obtained by averaging the responses of all visually responsive neurons across all the trials for each contrast, regardless of stimulus direction. Mean ± SEM. J, Illustration of the large trial-to-trial variation in the population response to one stimulus (i.e., 0°, 100% contrast; inset), from the same population shown in I. Each color-coded line represents a population response, averaged across every 10 trials after ranking single-trial population responses by amplitude. Mean ± SEM (n = 10). K, Mean population response amplitudes (a.u.) as a function of contrast (100 vs 40%) and population response level (high vs low). p < 5e−5 in Kruskal–Wallis Test after averaging across stimulus directions. *p < 0.05 in post hoc Tukey tests. Mean ± SEM (n = 18, 10 FOVs for sedated and quiet awake states, respectively).
Selecting epochs for quiet wakefulness and measuring stability of the data.
To minimize effects from different behavior states in our analysis, we included in the analysis epochs either from during quiet wakefulness or from in sedation as follows.
For awake experiments, sessions were first screened by the experimenter to exclude segments with obvious artifacts, such as eye squinting or inappropriate eye opening, excessive stress indicated by the restlessness of the animal. Data selected had to have successful monitoring of eye movements under good eye conditions (e.g., neither eye squinting nor inappropriate eye opening) for at least 30 min of visual stimulation. Then, a second pass of quantitative screening was performed. All trials with large movements were excluded from data analysis. Large movements were defined by either recording the instantaneous rotation speed of the wheel >1 cm/s or the x–y movement of the image frame >2 μm from the reference frame of each movie. When the movies in each experiment session show substantial z drift, resulting in >10% cells identified in the first movie to disappear in the last movie, the entire session was excluded from analysis.
Eye position information was analyzed within the quiet awake state. Pupil size and location (x- and y-coordinates) were tracked with an automated custom-built program. Frame-by-frame supervised inspection of the eye traces followed by statistical analysis was then performed. In the following, statistical thresholds at each step were calculated within trials that survived in the prior steps. First, trials with eye movements whose velocity exceeded 2 SD from the mean were excluded from analysis. Second, trials with large eye position deviations from the median were excluded from analysis. Specifically, trials were excluded when the x- or y-coordinate was < first quartile coordinate − interquartile range (IQR), or > third quartile coordinate + IQR. Typically, 90% of trials that survived this criterion showed <10.2° eye excursions from fixation (Fig. 1B; median excursion = 4.5° at this dataset), commensurate with ∼10% of the stimulus size (∼100° in diameter). This was consistent across sessions. Similarly, trials for which pupil size deviated more than the IQR away from the first or third quartile were excluded from analysis, because they might correspond to relatively extreme states of arousal.
Similar to earlier studies (Niell and Stryker, 2010; Reimer et al., 2014; McGinley et al., 2015a), population activity modulated with walking speed or pupil size (Figs. 1B, 2A,B). Interestingly, population activity was also significantly modulated during quiet wakefulness, in the absence of locomotion, pupil size changes, eye movements or other obvious body movements (Fig. 2A,A1). However, this modulation was not significantly correlated to small changes in pupil size during quiet wakefulness (Fig. 2C). To compare the temporal evolution between population-activity level (PAL) and pupil size, autocorrelogram was calculated after subtracting its mean across trials. Whereas autocorrelogram of pupil size showed substantial correlation in adjacent trials, PAL changed more instantaneous by falling correlation coefficient close to 0 in adjacent trials, reflecting different time scales of neuromodulatory influence between PAL and changes in pupil size (Fig. 2D).
Population activities both from sedation and quite wakefulness fluctuate in a similar extent (Fig. 2E) in mean population response to visual stimulation (Fig. 2F) and its Fano factor (Fig. 2G), which represents relative variation of response.
To measure stability of PALs in time, we divided all the population-response trials into two subcategories: One with high (50%-highest, “H”), the other with low (50%-lowest, “L”) population activity level. Then, we calculated how many trials of population response belong to the high versus to the low PAL conditions in the beginning versus the end of the imaging sessions. Specifically, we divided trials into four quartiles based on when they occurred, and calculated the number of trials with H condition were subtracted with the one with L condition and then normalized with the total number of trials within each quartile. In this measure, therefore, “1” and “−1” represent a complete bias to high and low PAL, respectively, and “0” no bias. This measure over the quartiles shows a positive bias in the first quartile and a negative bias in the fourth quartile (Fig. 2H), implicating slow decays of population response. Even though quiet wakefulness has stronger biases than sedation, the overall decay is still small with the largest bias of 0.2 in the first quartile of quiet wakefulness (Fig. 2H). This implies that population activities acquired are stable both in quiet wakefulness and in sedation during the entire imaging session.
Decoding stimulus direction from population activity.
To discriminate the visual stimulus direction from cell population responses within versus across contrasts, we used a regularized logistic regression model (RLRM) with the L2-norm regularization (Krishnapuram et al., 2005; Bishop, 2006). In this model, the cells' trial-response vector was fed into an input vector r = [r1, r2, ′, rn]T of RLRM, where ri is the ith cell trial-response in estimated spike-rate.
Then, the input vector was classified with the RLRM model as follows:
Here,
θ is stimulus direction, w is a weight vector, and
 |
For the binary classification with equal number of trials per condition,
 |
where
 |
We performed a mean response subtraction (i.e., r − r0) to achieve an unbiased decoder [i.e., ∫wT(r− r0)P(r|θ)P(θ)drdθ = 0]. Our unbiased decoder is comparable to Graf et al.'s (2011), which applied contrast–response-offset correction. Note also that our conclusions shown in the present study remained the same without this bias correction and for z-normalization of individual cell responses.
The L2-norm regularization on w was applied to achieve a maximum a posteriori estimate as follows:
Here, λ is a free parameter searched in a logarithmically linear space between 10−10 and 10 to find the optimal value that results in the maximum decoding performance, using a separate set of data from the training and testing data (see in the next section).
The decoding performance of cell populations for a pair of stimulus directions were assessed and cross-validated by 100 random subsampling tests (80% for training, 10% for optimal λ searching, 10% for testing). The decoding tests were performed: (1) within the same contrast as the training contrast to assess decoding performance for within-contrast direction decoders, or (2) within a contrast different from the training contrast for cross-contrast direction decoders. The same method was also applied to compare decoding performance within versus between PALs. To this end, trials within each stimulus direction and within each contrast were separated into two subgroups, one with high (50%-highest, H), the other with low (50%-lowest, L) average population activity. The average population activity for each trial was computed as the mean response across all cells included within each FOV.
The logistic regression model (LRM) was also used for selecting the most informative cells in stimulus-direction decoding. This was achieved by using an L1-norm regularization technique (instead of the L2-norm) to increase the sparseness of the weight vector (sparse LRM). We then re-evaluated the decoding performance with L2-norm RLRMs through cross-validation for the selected cells. Specifically, we trained a sparse LRM from 80%, randomly selected, training data trials using 10% distinct data trials for λ optimization. A number (n) of cells with the n-highest magnitude of weights were then selected. The contribution of each cell to the output value of LRM before the nonlinear function [i.e., wT(r−r0)] was determined by two factors: (1) the overall response modulation of the cell between conditions used; and (2) its corresponding weight value, wi. The different response modulations across cells were normalized by setting the response variance for each cell across trials to unity before training to fully reflect the extent of cell's contribution to the decoder. Following cell selection, an L2-norm regularized RLRM was trained to find the optimal λ and re-optimize the weights of the selected n-cells using new randomly selected training data (80% trial), as well as distinct λ optimization (10% of trials), and distinct testing (10% of trials) data. This process was repeated 100 times. Note that the data for cell selection and decoder training with an optimal λ were kept strictly separate from the testing data.
Validating contrast- or PAL-invariance for population codes.
To test whether population codes are preserved under changes in contrast, we validated population codes with all-contrast decoders and cross-contrast decoders. All-contrast decoders were built with training decoders with data including 100, 40, and 20% contrast data. In addition, Cross-contrast decoders were built by training decoders with a single contrast data and testing the decoders with data from the other contrast, for example by measuring decoding performance on 40% contrast data with the decoders trained with 100% contrast data.
Testing population codes with all-contrast decoders alone could not validate the contrast-invariance because all-contrast decoders can work well even when the true neural computation is contrast-specific. This is because that if data from a contrast are used both in decoder training and its testing, the trained decoders reflect the statistical properties of the testing data. The same principle is applied to test invariance of population codes when PAL changes. Therefore, we use both all condition and cross-condition decoders to test invariance of population codes between contrasts and between PALs.
Linear direction tuning function fits across contrasts or different population activity levels.
To obtain the response gain of direction tuning functions of each cell between 100 and 40% contrast, we used a linear fit as follows:
where f40(d) and f100(d) represent the tuning functions of a cell at 40 and 100% contrast, respectively; d refers a stimulus direction, and α and β represent a gain and a bias. The tuning functions were calculated from the estimated spike rates.
To prevent an arbitrary non-physiological fitting (e.g., a negative α or a large positive α with a large negative β), we constrained the fitting as follows:
 |
To minimize the cost function with the non-negative constraints, we adapted a log-barrier technique (Boyd and Vandenberghe, 2004; Kim et al., 2007).
Here, f40i and f100i represent a vector composed of the mean evoked responses, f40i(d) and f100i(d), from the ith subsampled set of trials of each cell to stimulus direction (d) at 40% and 100% contrast, respectively, and γ is a free parameter that constrains the magnitude of α and β. In the ith subsampling, 50% trials randomly selected within stimulus direction = d and contrast = c were averaged to generate fci,train and the remaining 50% trials to generate fci,test(d). This random subsampling was performed N = 1000 times, i.e., i = 1, …, N. Then, the training set composed of f40i,train s and f100i,train s was used to search for the optimal γ in a logarithmically linear space between 10−5 and 10 and to estimate the parameters α and β. The testing set of f40i,test and f40i,test was used to evaluate the fit's performance. The same strategy was also applied to obtain the response gains when comparing between different population-activity levels by conditioning trials based on PAL as well as contrast (e.g., f100L = αf100H + β).
For within-contrast fits (e.g., f100 = αf100 + β), training trials obtained from the ith subsampling shown in the previous section were further divided into two subsets to construct Y, X (i.e., Y = αX + β) by averaging 50% trials randomly selected from training trials within each stimulus condition for Y and the remaining 50% trials for X. The same method was applied for testing data.
The bias β was normalized to the maximum response at 100% contrast before plotting in Figures 3 and 4.
Figure 3.
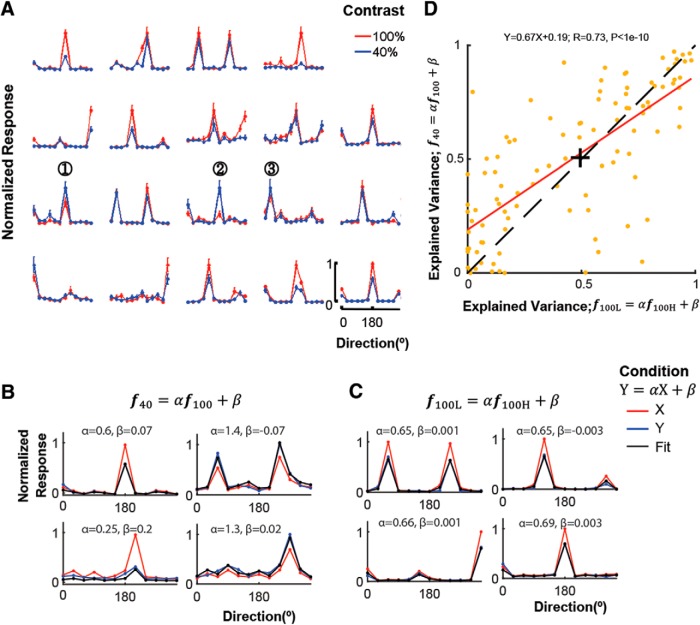
Linear fits of direction tuning function at 100% versus 40% contrast and high versus low population activity (PA). A, The change in gain of direction tuning functions as a function of stimulus contrast is heterogeneous across cells. Red and blue lines show 100%- and 40%-contrast direction tuning curves normalized by the maximum response at 100% contrast for each cell separately. Mean ± SEM (n = 30 trials/direction). Note that while the preferred direction of cells is well preserved across contrasts, the relative scale of the response (gain) between contrasts varies widely across cells. See for example Cells 1–3 whose responses to lower contrast are higher than to 100% contrast supporting. B, C, Fits (black) predicting the direction tuning functions at 40% contrast (f40; blue) from the ones at 100% contrast (f100; red) and at L (f100L; blue) from H (f100H; red), respectively. Such fits are used to extract the parameters α and β. Left, α < 1; right: α >1 for B. α = ∼0.65 for the four example cells for C. D, Tuning invariance across contrasts versus across high and low population activity. The higher the explained variance, the higher the similarity of tuning (extent of tuning invariance) across the two conditions. Although these mechanisms of gain modulation are different, they show a similar tuning invariance pattern across cells: cells showing strong tuning invariance with contrast changes (high EV across contrasts) also show strong tuning invariance with PAL changes (high EV across different population levels of activity). +The point corresponding to the median of the samples. The dashed line denotes y = x.
Figure 4.
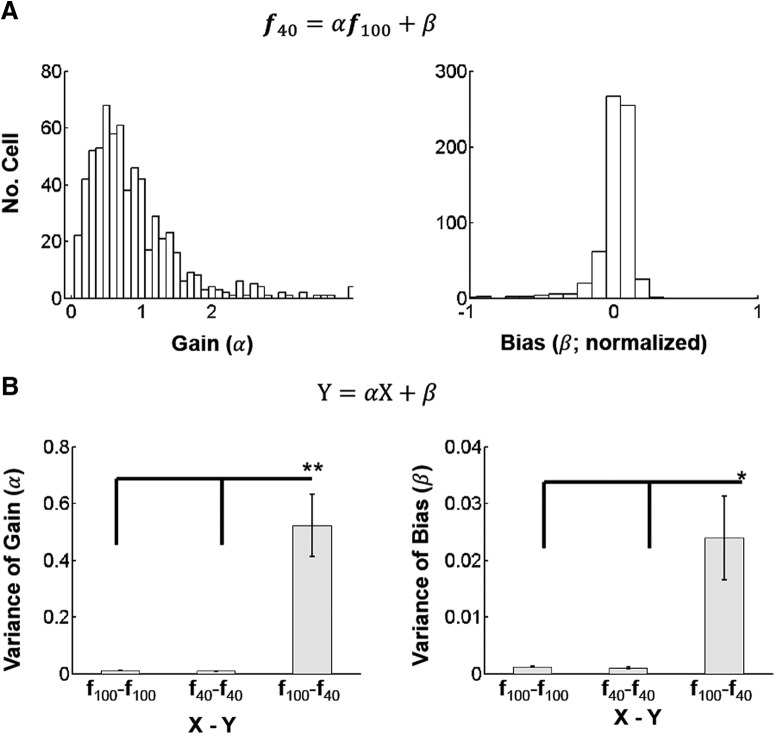
Contrast gain modulation. A, Distribution of gain (α) and bias (β) of all cells across FOVs (n = 653 from 28 FOVs) in the linear fit of f40 = αf100 + β: α (left) and β (right). β was normalized to the maximum tuning response at 100% contrast. Large dispersion of contrast gain parameters (α) occurs across cells. B, The mean variance of the extracted parameters across FOVs when fitted within (f100 − f100, f40 − f40) versus across contrasts (f100 − f40). Only cells whose fits had explained variance >0.5 for each fit (f100 − f100, f40 − f40, and f100 − f40) were included. Mean ± SEM (n = 27, 23, 28 FOVs for f100 − f100, f40 − f40, and f100 − f40). β was normalized to the maximum tuning response at 100% contrast. These plots show that the large dispersion of parameters across cells for the f100 − f40 contrast transitions represents a physiological effect and does not arise as a result of variability of sampling. p < 1e−10, Kruskal–Wallis test for α (left) and β (right). *p < 0.01, **p < 5e−5 in post hoc Tukey tests.
Identifying which cells contribute to direction decoding across conditions.
P(ci | contrast,n) was defined as the probability that the cell ci belongs to the n “most informative” cells, i.e., the cells whose output can discriminate best between the stimulus conditions at the given contrast. Practically, P(ci | contrast,n) was calculated by counting how many times out of 100 cross-validation tests, the cell ci was selected as one of the n most informative cells. Then, the probability for the cell to belong to the n most informative cells at both 100 and 40% contrast was given as follows:
 |
Decoding performance in control data constructed to have identical SNR across different contrasts.
To rule out the possibility that contrast-dependent difference in signal-to-noise ratio (SNR) affects the comparison between within-contrast versus cross-contrast decoders, we generated artificial control data by modifying relative noise levels (i.e., the SNR) of 100%-contrast data to be the same as the one of 40%-contrast data within each stimulus direction for each cell. At the same time we held the mean response within stimulus conditions the same to maintain original direction tuning functions and contrast response gains. We then compared the decoding performance of within-contrast versus cross-contrast decoders derived from these control data.
To generate spike-rate responses, we used the gamma distribution. We chose the gamma distribution rather than Poisson distribution because spike response variance on repeated identical stimulus presentation is often larger than predicted by the Poisson distribution, whose relative dispersion is constant (i.e., variance/mean = 1) This is supported by a recent study, which found the negative binomial distribution (NBD) to be a better model of real spike fluctuations (Goris et al., 2014; the gamma distribution resembles the behavior of NBD for estimated relative spike rates). The mean and variance of the response of each cell within each stimulus condition was calculated at 100 and 40% contrast, respectively. These values from each contrast were then used to create a gamma distribution for each cell, contrast as follows:
 |
where
 |
where x represents the firing rate. The two free parameters, a and b, determine the mean and the variance as ab and b2 respectively. Using this relationship, we generated 1000 random samples for each contrast, with a and b given by a40 and for 100% contrast and a40 and b40 for 40% contrast, respectively. The subscript indicates the contrast used to estimate the corresponding parameter. For 40% contrast, this process generates artificial data that have the same mean and variance as the original data, and for 100% contrast it generates data that have the same original mean obtained at 100% contrast, but signal-to-noise ratio that matched the SNR obtained at 40% contrast. This was performed cell-by-cell across all cells. The entire process was performed 10 times to generate data for cross-validation. The usual procedure was then applied to evaluate decoder performance within and across contrasts, as described above.
Statistical analysis
If not explicitly stated, statistical measures and tests were performed from all the sessions (n = 28; 18, 10 FOVs from sedated, awake animals, respectively) together, as sedated and awake animals gave similar results.
All statistical tests were performed with non-parametric, MATLAB built-in functions. Post hoc Tukey test refers the “tukey-kramer” method in the function called “multcompare”. The figure legends indicate the Bonferroni familywise error (FWE) correction and the SEM.
Results
Internal versus stimulus-contrast driven modulation of visual responses
Neuronal population activity is modulated both by external (i.e., stimulus contrast) and by internal, spontaneously fluctuating, inputs. Here, we compared these two gain-modulation mechanisms in layer 2/3 of mouse area V1. One proxy indicator of internal input modulations are the spontaneous fluctuations that occur in aggregate population activity (Kerr et al., 2005; Lee et al., 2017) during repeated presentations of the same stimulus.
Two stimulus contrasts of 100 and 40% were selected to demonstrate neuronal modulation by visual contrast. This change in contrast elicited neuronal firing rate changes at most commensurate to (in fact somewhat smaller than) changes seen spontaneously with repeated presentations of identical stimuli (Fig. 2I,J). This was demonstrated by conditioning trials within each stimulus condition into two subcategories: One with high (50%-highest, H), the other with low (50%-lowest, L) PAL (Fig. 2K). As shown in the examples of Figure 2, I and J, the mean population response for 100% stimulus contrast but low population activity level (i.e., 100L) was smaller than for 40% contrast and high population activity level (i.e., 40H; Fig. 2K).
Note that we performed our experiments either in a state of quiet wakefulness or under sedation. Under these conditions significant population activity modulations still occur, and are not particularly correlated to pupil size changes in the awake animals. Interestingly, the amplitude of the fluctuations in PAL during quiet wakefulness were commensurate to the ones observed under sedation (Fig. 2E–K) and larger than visually-evoked modulations of neuronal population activity observed with a contrast change from 100 to 40% (see in the previous section). Physiological parameters remained effectively stable for the duration of imaging (Fig. 2E–H; see Materials and Methods).
Internal input fluctuations modulate gains more homogeneously across cells than visual contrast changes
We next investigated how (1) changes in stimulus contrast versus (2) fluctuations of internal inputs manifested by changes in PAL modulate individual cell responses. To measure stimulus contrast gain modulation of each cell, we fit the direction tuning function, f40, at 40% contrast to the one, f100, at 100% contrast as follows: a40 = αf100 + β (see Materials and Methods). Overall, many cells show contrast invariance for direction tuning function (Fig. 3A,B) by showing high explained variance (EV) in the fits: 50% of cells with EV > ∼0.5. Similarly, the fits between high and low PALs, i.e., f100L = αf100H + β, also show similar extents of fitting (Fig. 3C,D). In addition, the stronger cells show contrast-invariance, the stronger cells show PAL-invariance by showing strong linear correlation between EVs of the fits for contrast and for PAL (Fig. 3D). However, this similarity between the fitting extents for contrast and for PAL does not reflect similarity of gain profiles across cells between contrast and PAL by showing similar α s across example cells for PAL (Fig. 3C) but large variability of α s for contrast (Fig. 3B).
To generalize this example in more trials per condition and more FOVs, we performed 100–200 trials per stimulus condition for stimuli spanning 4 directions in 28 FOVs (see Materials and Methods). Again, we fitted the direction tuning function, f40, at 40% contrast to the one, f100, at 100% contrast as above. In these fits, the gain (α) shows large variability across cells, even when fits have high explained variance (>0.5; Fig. 4A, left), whereas the bias (β) remains concentrated near 0 (Fig. 4A, right). The much tighter dispersion of both the parameters seen within contrast persists when fitting data from distinct time periods but for the same contrast (i.e., f100 − f100 and f40 − f40; Fig. 4B). Particularly, as claimed in other studies (Peirce, 2007; Sani et al., 2013), we observed that a substantial percentage of cells (∼28%) show a larger response to 40% contrast than 100% contrast (i.e., cells with gain > 1; Fig. 4A). This observation suggests that even though lowering stimulus contrast reduces the aggregate cell response, single cells can either increase or decrease their response as contrast decreases.
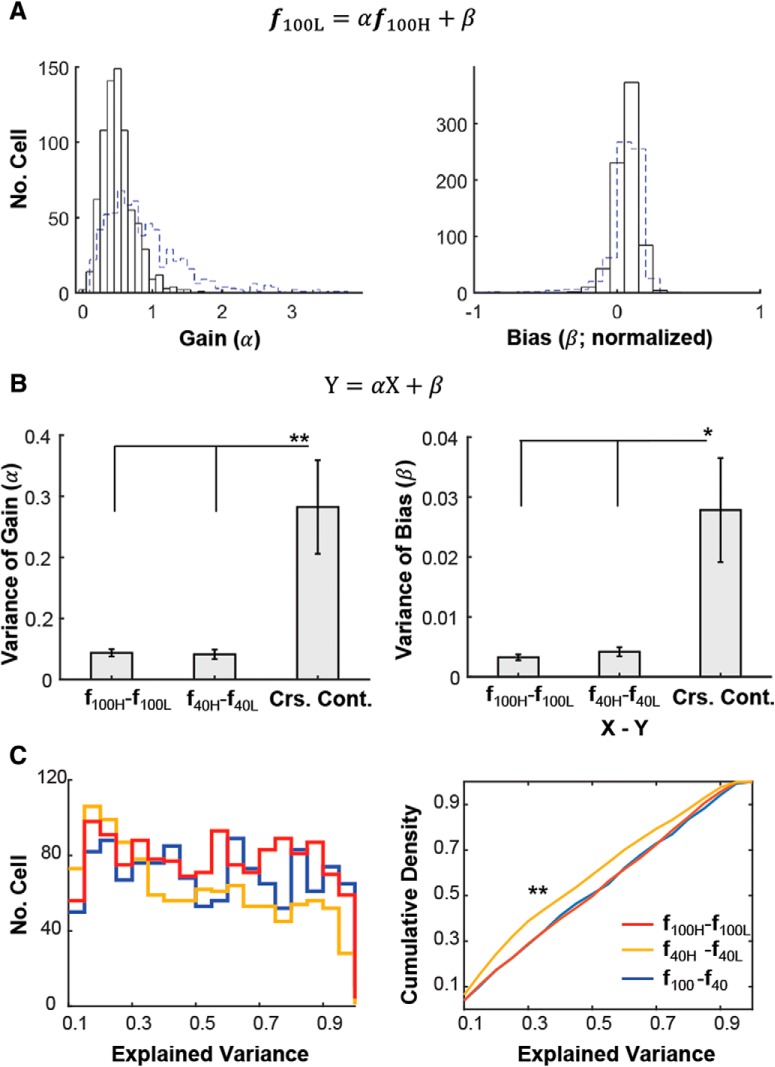
We also measured gain and bias of single-cell responses for spontaneous modulation of global internal inputs, whereas stimulus contrast was kept constant. Similar to Figure 4, direction tuning function of each cell between high and low PALs was linearly fitted after dividing trials into high and low PAL subgroups within each contrast, as shown in Figure 2K. For example, for high and low PALs for 100% contrast, f100L = αf100H + β, where f100L and f100H represent the direction tuning functions of a single cell derived from low and high PAL respectively, for 100% contrast. Interestingly, the linear fit between the two different PAL states yields much narrower gain and bias distributions across cells compared with the change of contrast we used (Fig. 5A,B), even though the population firing rate is modulated by the same or a larger amount during the switch in PAL state (Fig. 2K). This has potentially important implications: single-unit firing is notoriously variable during the repeated presentation of identical stimuli revealing that it is significantly modulated by the fluctuation of internal inputs.
Figure 5.
Spontaneous internal gain modulation and its comparison to contrast gain modulation. A, Distribution of gain (α) and bias (β) of all cells across FOVs (n = 747 from 28 FOVs) in the linear fit of f100L = αf100H + β: α (left) and β (right). β was normalized to the maximum tuning response at 100H (i.e., 100% contrast and high population activity). Blue dashed lines represent the histogram shown in Figure 4 (i.e.,α and β; f40 = αf100 + β). Only cells whose fits had explained variance >0.5 were included. For f100L = αf100H + β (black) versus f40 = αf100 + β (blue dashed line), variances of α s are 0.44 versus 0.05, and variances of β are 0.016 versus 0.006, respectively. p < 1e−30 for α and p < 1e−10 for β in Kolmogorov–Smirnov test. B, Variance of gain (α) and bias (β) modulations across cells within each FOV, arising as a result of a change in population activity level (i.e., f100H − f100L, f40H − f40L) versus stimulus contrast (Crs. Cont.). Crs. Cont., The average variance derived from cross-contrast-fits (i.e., f100H − f40H, f100H − f40L, f40H − f100L, f100L − f40L). Only cells whose fits had explained variance >0.5, which is approximately the median of both EV distributions shown in Figure 3D, were included for both fittings of f100H − f100L and f40H − f40L. Mean ± SEM (n = 26 FOVs). p < 5e−4 and p < 1e−3 for α and β in Kruskal–Wallis test, respectively. *p < 1e−2 and **p < 1e−3 in post hoc Tukey tests, respectively. Note that high ↔ low internal activity fluctuations lead to more homogeneous gain modulations across the L2/3 cell population than changes in stimulus contrast. C, Histogram (left) and cumulative density function (right) of explained variance of the linear fits. Blue: f100 − f40; Red: f100H − f100L; Yellow: f40H − f40L. **p < 1e−5 by Kolmogorov–Smirnov test. Only samples with EV > 0.1 are included in the plot. The similarity between f100H − f100L and f100 − f40 suggests that the different profiles of gain modulation shown in A and B are not because of a difference in tuning-shape invariance of individual cells, nor the exact value of the criterion (EV > 0.5) used to select cells. Even though the fits of f40H − f40L (C left) degrade somewhat at high EV bins, resulting in a CDF for f40H − f40L that is statistically different from the ones for f100 − f40 and f100H − f100L, selected cells with EV > 0.5 still have smaller variance of gain and bias modulation for f40H − f40L (as shown in B). Number of cells selected (with EV > 0.5) was as follows: 24% (496) versus 32% (655) cells for f40H − f40L and f100 − f40, respectively. Note that our conclusions remain robust to reasonable shifts of the EV threshold used for cell selection.
In addition, the large difference in the distribution of gains observed with contrast changes compared with PAL changes was not the result of a difference in the tuning-shape invariance of the individual cells (Fig. 5C), despite of that there are some degradation in the fit of f40L = αf40H + β.
How the gain of these modulations varies across cells will then impact how information is represented in the cortical circuit, and how it can be decoded. Therefore, we turn next to the question of how the different types of gain modulation observed (homogeneous versus heterogeneous across cells) impact population coding.
Different cell ensembles are engaged for direction encoding at different contrasts
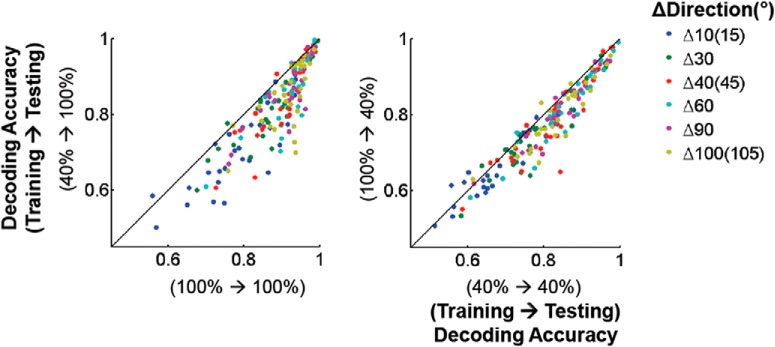
First, we examined whether population codes are preserved across contrasts by comparing how the decoder performed when training and testing trial sets were taken from the same versus across different contrasts. Contrast invariance predicts that decoding performance should be independent of training contrast. Contradicting this, we found that decoding accuracy was better within than across contrasts (Fig. 6). Specifically, when testing with 100%-contrast data, training the decoder with 100%-contrast data outperformed training with 40%-contrast data (Fig. 6, left; p < 1e−9). Conversely, when testing with 40%-contrast data, training with 40%-contrast data outperformed training with 100%-contrast data (Fig. 6, right; p < 2e−3). Together with the larger heterogeneity in contrast-gain across cells shown in Figures 3 and 4, this suggests that strict contrast invariance fails and the underlying rule for optimal population coding is to a considerable degree contrast-specific.
Figure 6.
Direction population code violates contrast invariance. Within-contrast decoders (x-axis) versus cross-contrast (y-axis) decoders tested at 100% (left; p < 1e−9, Friedman test) and 40% contrast (right; p < 2e−3). Each dot represents decoding accuracy from a single FOV (n = 28). Colors represent the difference between decoded directions of stimulus motion (in degrees).
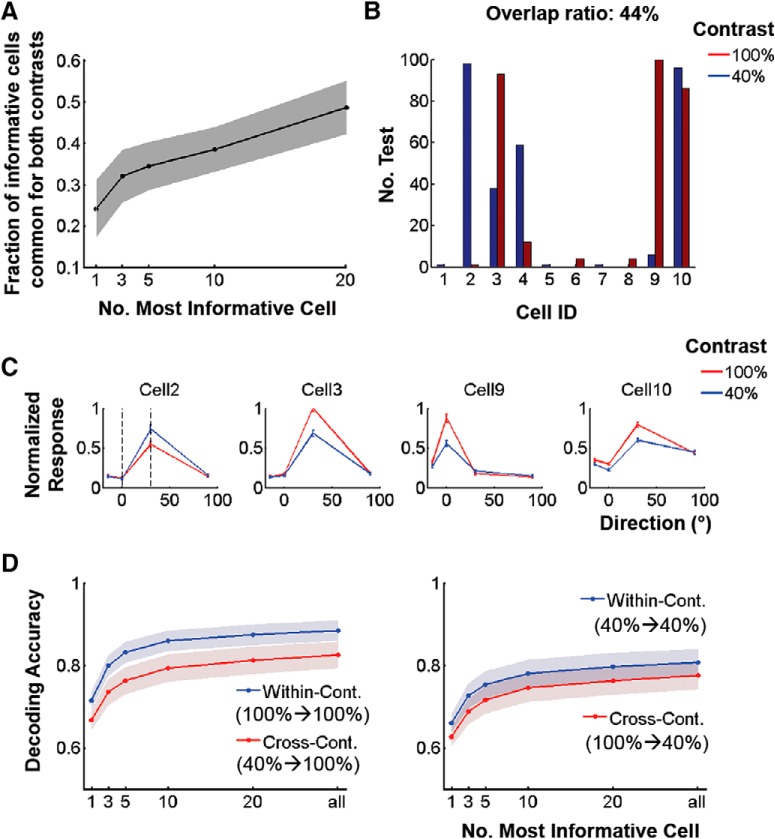
To further confirm that different cell groups are engaged for direction encoding between contrasts, we used a sparse LRM to decode the stimulus direction of motion from the neuronal population activity in layer 2/3 of area V1. Cells were ranked from most to least “informative” depending on the magnitude of the weight with which they contributed (see Materials and Methods). There was only a 25% chance that the same cell would be selected as most informative at both 100 and 40% contrast (Fig. 7A). Figure 7A plots the probability that a cell is selected as one of the n most informative cells for both contrasts as a function of n. Although this probability naturally increases with n, it still remains <50% at n = 20, although decoding performance is nearly plateaued (Fig. 7D). Figure 7, B and C, show an example of contributing cells and their corresponding tuning functions for decoding gratings moving at 0° versus 30°, when n = 3. This example shows that Cell 2, which was almost exclusively selected at 40% contrast (Fig. 7B), responds more strongly to 40% contrast than to 100% contrast at direction = 30° (Fig. 7C). These observations suggest that direction-of-motion information is carried by substantially different populations of cells at low visual contrast compared with high contrast.
Figure 7.
Cells that participate in direction decoding at different contrasts are substantially different. A, Probability for a cell to belong to the first n most informative cells both at 100% and at 40% contrast. B, Example: number out of 100 cross-validation tests for which cells belong to the first three most informative cells for decoding a change of direction = 30°. C, Direction tuning functions of cells selected in B, normalized to the maximum response of Cell 3. Mean ± SEM. The two vertical dash lines represent the two directions decoded. D, Decoding accuracy within (100%→100%; 40%→40%) versus across (40%→100%; 100%→40%) contrasts using only the first n most informative cells as a function of n. Friedman Test p < 1e−10 (left), p < 1e−5 (right). A, D, Solid lines and shadows represent mean (n = 28) and 95% confidence intervals, respectively.
We further compared the amount of information encoded by the most informative cells for within-contrast versus cross-contrast direction decoding. Briefly, from the most informative “n” cells at a given contrast, a regularized LRM was trained to re-optimize the weights only within the cells selected, and then used to test decoding performance within versus across contrast (see Materials and Methods; distinct data were used for testing, cell selection, and classifier training). As expected, decoding performance increases with the number of cells (n) but, consistent with Figure 6, remains significantly better within versus across contrasts for all n (Fig. 7D).
Spontaneous internal modulations leave population codes invariant
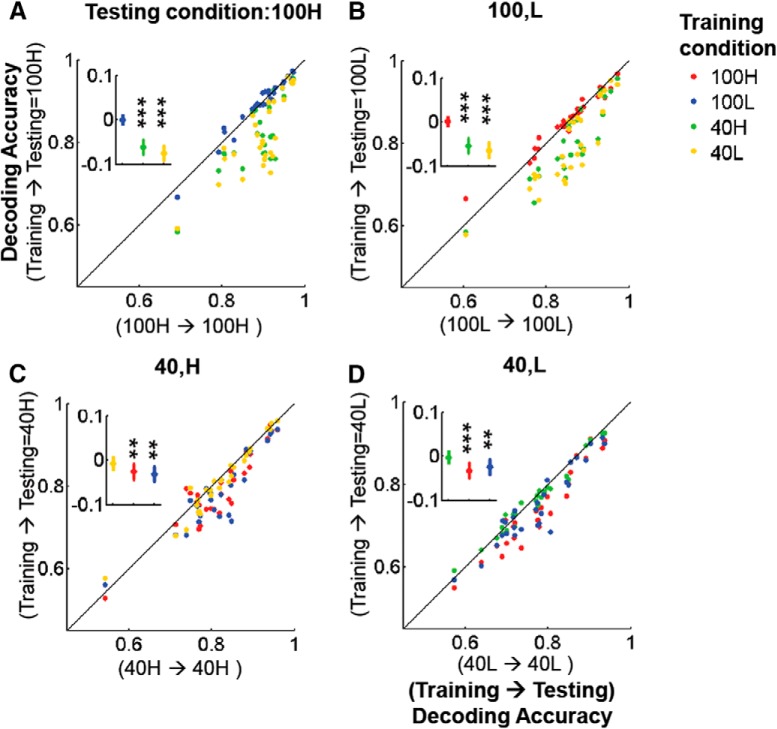
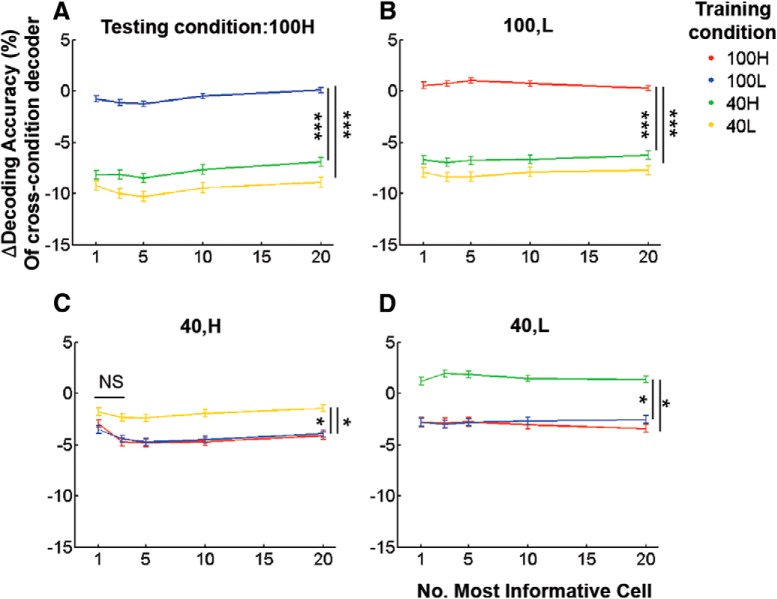
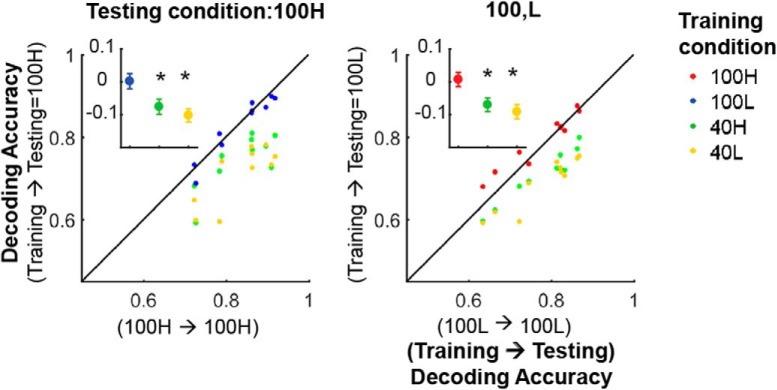
Next, we probed whether the population code for direction-of-motion changes with internal input modulations that occur spontaneously, after separating the data trial-by-trial into high and low PAL groups as shown in Figures 2 and 5. When the direction decoder was trained/tested between the high and low PAL groups within each contrast, decoding accuracies were essentially identical (Fig. 8). This was true for trials at both 100 and 40% contrast (Fig. 8). As a clear example in Figure 8A, when trained with the low PAL data and tested with the high PAL data for 100% contrast, the decoders show almost identical performance compared with decoder trained with the high PAL data (i.e., 100% contrast and high PAL). Significant changes in decoding accuracy were only seen across changes of stimulus contrast, not when population response changed because of the spontaneous fluctuation of internal inputs (Fig. 8). The relative preservation of population codes across spontaneous fluctuations of population activity is closely related to the fact that response gain modulations across V1 L2/3 cells are considerably more uniform under this condition (Fig. 5).
Figure 8.
Internal gain modulations preserve the population code for stimulus direction-of-motion. A–D, Decoding accuracy comparisons when training/testing data are taken across different stimulus contrasts and PALs. Inset, Cross-condition decoding accuracy minus within-condition decoding accuracy. **p < 1e−3, ***p < 1e−4 (FWE, Wilcoxon signed rank test). Note that population code is preserved across high ↔ low internal gain modulations occurring at fixed stimulus contrast, but not across different contrasts. As a stark example, A shows that decoders trained only with 100L data show almost identical performance with decoders trained with 100H (A, blue) but all other cross-contrast decoders(i.e., decoders trained with 40H and 40L data) do not.
As shown in Figure 2, individual cell firing rate fluctuations from trial to trial within each stimulus condition are more extreme during spontaneous internal input modulations than across the changes in stimulus contrast we used. For example, note that population response activity level at 40H (40% contrast and high PAL) is much greater than at 100 L (100% contrast and low PAL). Therefore the differences noted cannot be attributed to potentially weaker firing rate modulations occurring during the spontaneous fluctuation condition.
We further compared decoding performance by the n most informative cells as a function of n, similar to Figure 7D. Decoding performance by the cross-condition decoder was degraded more strongly by modulations of stimulus contrast compared with spontaneous modulations of internal input (Fig. 9A–D). This again confirms that significantly different populations of cells contribute to direction-decoding at the two different contrast levels chosen.
Figure 9.
Decoding performance degrades for changes in contrast, but not for changes in population activity. A–D, Relative performance of cross-condition decoders generated using the first n most informative cells, as a function of n. Y-axis plots change in decoding accuracy: (cross-condition − within-condition)/within-condition. Illustrated differences are significant for all n, except for n = 1,3 in C: Kruskal–Wallis test, p < 1e−7 for A and B, p < 0.05 for C and D. *p < 0.05, ***p < 1e−5 by post hoc Tukey tests.
Other controls further support our conclusions
Contrast-dependent differences in noise characteristics do not explain away contrast-specific codes
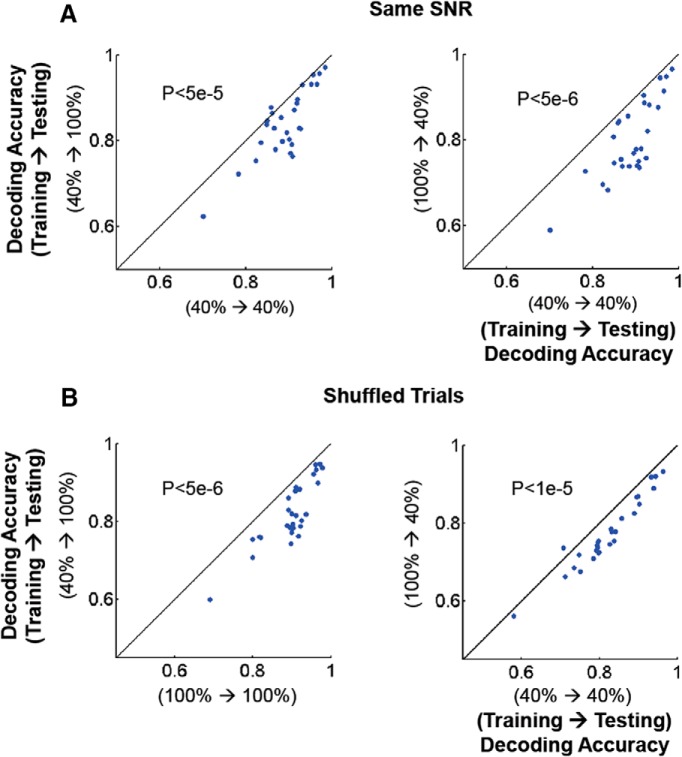
To ensure that different noise levels at 40 versus 100% contrast are not the source of the decoding differences observed, we modified the data cell by cell, keeping the original mean responses, but adjusting noise levels so that SNR remains invariant across contrasts. We again found that within-contrast decoders outperform cross-contrast decoders, reinforcing the conclusion that this effect (Fig. 10A) is not because of different SNR levels across contrasts, but rather to the heterogeneity of contrast gain responses across the population of cells (Figs. 3–5). Neither does destroying noise-correlation structure by randomly shuffling trials, cell by cell, within each stimulus condition influence our result (Fig. 10B).
Figure 10.
Better performance of within-contrast decoders does not result from contrast-dependent noise characteristics. A, Decoding performance of within-contrast (x-axis) versus cross-contrast (y-axis) decoders after adjusting the SNR of 100%-contrast data to match that of 40%-contrast data. Left (y-axis): 100% contrast data are used for testing, 40% for training. Right (y-axis): 40% for testing, 100% for training. B, Decoding performance of within-contrast (x-axis) versus cross-contrast (y-axis) decoders after we destroy the noise correlation structure across neurons. Left, Testing contrast 100%. Right, Testing contrast 40%. To destroy noise correlations trials were shuffled within stimulus conditions and within cells (see Materials and Methods). Each dot indicates average decoding accuracy across all pairs of stimulus directions. Statistical test, Wilcoxon signed rank test.
Contrast-specific decoders still outperform cross-contrast ones for a small stimulus
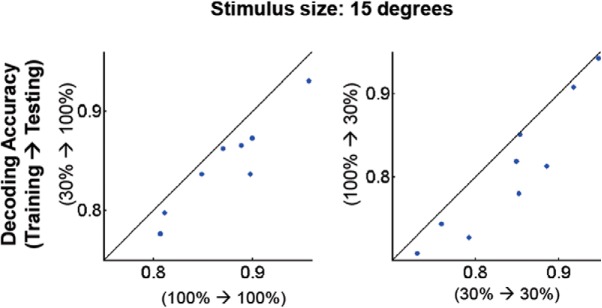
Neuronal response decreases as stimulus size increases beyond their receptive field size (Allman et al., 1985). This effect is more obvious for high contrast (Sceniak et al., 1999) and thus intermediate contrast stimulation may evoke stronger responses than high contrast stimulation in some cells. Therefore, one may wonder whether our finding is only valid when the large stimulus size was used. To this end, we stimulated cells by presenting on the aggregate center of their receptive fields a small stimulus (i.e., 15° radius), which was only slightly larger than the typical receptive field size (i.e., ∼10–12°; Smith and Häusser, 2010) of mouse V1 cells. We also lowered the low contrast condition to 30% to increase the number of cells that do not exhibit surround suppression. We found that contrast-specific decoders outperformed cross-contrast ones (Fig. 11), because they had with the full-field stimulus. Therefore contrast-dependent surround suppression effects do not explain away out observations.
Figure 11.
Superior performance of within-contrast decoders does not appear to strongly depend on stimulus size. We tested decoding performance of within-contrast (x-axis) versus cross-contrast (y-axis) decoders for stimuli of a smaller size of stimulus (i.e., 15° in radius; the usual full field stimulus = ∼55 × ∼80°). Each dot indicates average decoding accuracy across all pairs of stimulus directions. n = 9 FOVs; statistical test, Wilcoxon signed rank test. For both tests, p < 0.005.
Contrast-specific decoders outperform contrast-independent decoders
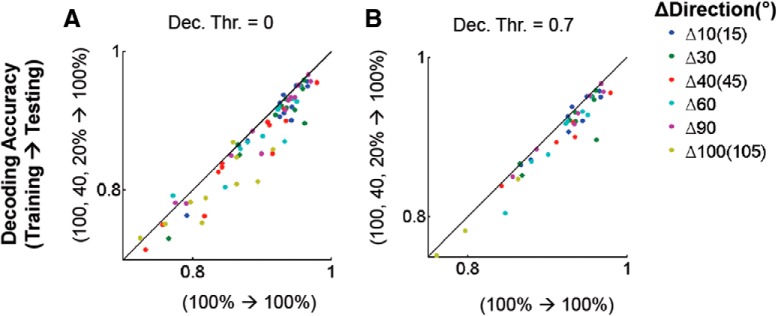
To test whether a universal pooling rule (decoder) could perform well across contrasts, we trained classifiers using data from all contrasts together then tested them at one of the contrasts. Our analysis again showed that contrast-specific decoders outperform contrast-independent decoders (Fig. 12). These observations strongly suggest that the population code for the direction-of-motion of moving gratings is not strictly invariant across modulations of stimulus contrast.
Figure 12.
Suboptimal decoding performance of contrast-independent direction decoders. A, Decoding performance between contrast-specific (x-axis) versus contrast-independent (y-axis) decoders. Each dot depicts decoding accuracy from each pair of directions in a FOV (n = 12). Friedman test p < 0.05. B, Decoding performance comparison presented only for pairs for which within-contrast decoding accuracy was >0.7 at all three contrasts. This suggests that the weaker performance of contrast-independent decoders compared with contrast-specific decoders did not result from poor signal-to-noise data entering at low contrasts. Wilcoxon signed rank test p < 0.005. Decoding accuracy for the surviving pairs was normalized with (Contrast-independent − Within-Contrast)/Within-Contrast for each pair of directions and averaged across pairs of directions within each FOV before the statistical test.
Testing additional versions of linear models supports our conclusion that population codes are not contrast variant
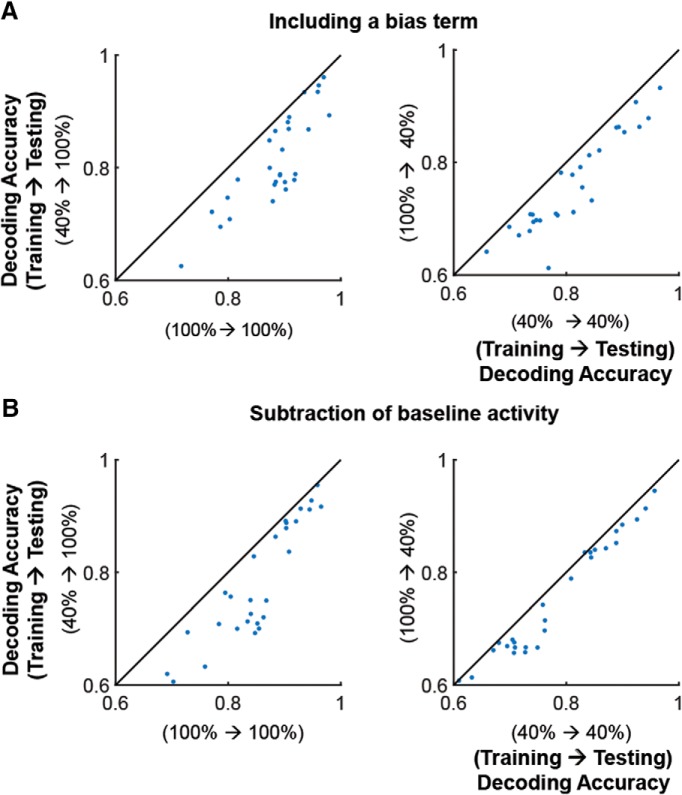
We tested two additional linear models: (1) by including a bias term (b) in Equation 3, i.e., using σ(wTr + b); and (2) by applying a subtractive normalization of neuronal responses trial by trial (i.e., subtracting the spontaneous spike-rate averaged over 3 frames immediately preceding the presentation of the visual stimulus trial-by-trial). For both models, contrast-specific decoders outperformed cross-contrast decoders (Fig. 13).
Figure 13.
Better performance of within-contrast decoders does not result from using the specific linear model stated in Equation 3. A, Decoding performance of within-contrast (x-axis) versus cross-contrast (y-axis) decoders by using a linear decoder including a bias term of b in the linear model σ(wTr + b) (see the difference from Eq. 3). B, Decoding performance of within-contrast (x-axis) versus cross-contrast (y-axis) decoders after subtracting baseline activity before visual stimulation from visual response in single trials/cells. Left, Testing contrast 100%. Right, Testing contrast 40%. Each dot indicates average decoding accuracy across all pairs of stimulus directions. Statistical test, Wilcoxon signed rank test. p < 5e−6 for all the cases.
The conclusions remained the same when including the quiet awake data only
Figures 3–9 showed the results by pooling data both during quiet wakefulness and in sedation. We stress that analysis of data only from the quiet awake state reached the same conclusion (Fig. 14).
Figure 14.
Within-condition versus cross-condition decoders from awake data only; x-axis: within-condition decoders, y-axis: cross-condition decoders. All figure conventions follows the ones for Figure 8. Population code is preserved between 100H and 100L, but not between contrast 100 and 40%. *p < 0.01 (FWE, Wilcoxon signed rank test). See Figure 8 for all the datasets including sedated and awake data.
Discussion
Our observations support the idea that the population code for the direction-of-motion of moving gratings is not strictly invariant with changes in stimulus contrast. Rather, substantially different populations of neurons encode sensory information at low contrast versus high contrast. This arises because of the heterogeneity of contrast gain responses across cells and shows that contrast invariance fails at the population level. On the other hand, the population code is invariant to large fluctuations in V1 neuron firing rates induced by spontaneous internal activity. Even though these firing rate fluctuations are larger in amplitude than the ones induced by the contrast change we used here, they do not have a pronounced effect on the structure and fidelity of the optimal decoder.
Changes in stimulus contrast do not leave population codes invariant
We chose to compare 100 to 40% contrast because mouse V1 neurons respond well and mice discriminate orientations successfully at these contrasts (Long et al., 2015). The functional properties of mouse V1 neurons observed in the present study agree with earlier studies including that the preferred direction is preserved across contrasts (Sclar and Freeman, 1982; Skottun et al., 1987; Finn et al., 2007). Notably, our observation that a fraction of cells show larger responses at lower contrast is also in agreement with prior studies (Peirce, 2007; Sani et al., 2013). Approximately 28% cells responded more strongly to 40% contrast than 100% contrast in our data (Fig. 4A, left), perhaps because contrast changes alter the balance between center and surround. This is commensurate to prior reports that ∼20–28% such cells can be identified in monkey V1/2 (Peirce, 2007) and V4 (Sani et al., 2013).
Our study demonstrated that the population code for grating direction-of-motion deviates significantly from invariance when stimulus contrast is changed. This is manifested by (1) the degradation of decoding performance when training/testing decoders from trials taken across contrasts (Fig. 6), and (2) the relatively large fraction of distinct cells that contribute to direction-decoding at different contrasts (Fig. 7). Furthermore, controlling for different noise levels and noise correlations across contrasts preserved these conclusions (Fig. 10). Finally, our results were consistent across different stimulus sizes, suggesting they were not a trivial by-product of differences in contrast-dependent spatial integration (Fig. 11).
The fact that optimal population codes vary with visual contrast raises the question whether the brain need implement a different code depending on contrast. It is likely that the population code changes continuously with contrast, following a trajectory in a high-dimensional space determined by the cells' contrast gain response functions. We argue that the heterogeneity of contrast gain response functions across the cell population is the main reason behind the failure of contrast invariance (Figs. 3–5). Similar to May and Zhaoping (2011), we hypothesize that the diversity of contrast gain responses across cells may confer an advantage as the same group of neurons is able to encode stimulus orientation/direction and contrast simultaneously. Alternatively, strict contrast invariance would imply that a different group of cells is needed to encode visual contrast itself. To the best of our best knowledge, no cells have been found that are exclusively contrast selective in visual cortex.
Reconciliation with prior results
Prior studies concluded that neuronal populations encode orientation/direction in a contrast-invariant manner. Busse et al. (2009) claimed that the population orientation tuning functions (POTF) were contrast invariant by averaging the responses of cell groups with similar orientation preference after normalizing individual cell responses. This method quenches the large diversity of contrast gain responses across cells, which we argue is the source of failure of contrast invariance, and is therefore in no direct conflict with our results. Similarly, Berens et al. (2012) reported that pooling weights, which were used for linear population decoding, are preserved across contrasts. However, in this study pooling weights were again averaged across cells with similar orientation preference, thereby smoothing out potential heterogeneities.
Another study (Graf et al., 2011) suggests that neural population direction code is invariant across contrasts even though they report substantial degradation for cross-contrast linear population decoding, a result similar to that shown in our study. To justify this conclusion they assumed that some cells responding vigorously to high contrast do not respond at low contrast, degrading decoding performance at low contrast when the high contrast data were used to train decoders. Although this phenomenon inevitably happens at low enough contrast, it does not explain the observations we make here: (1) we observed degradation in cross-contrast performance even when training at low and testing at high contrast, which cannot be readily explained by the above mechanism; (2) we explicitly chose to compare cross-contrast decoding across a smaller contrast transition (100% to 40% and vice versa), thus minimizing the potential problem discussed by Graf et al. (2011); (3) we did in fact observe a substantial number of cells that do respond more strongly at lower contrast (Figs. 3A, 4), and therefore contribute more substantially to decoding at lower versus higher contrasts (Fig. 7); and finally (4) controlling for the SNR of responses preserved out conclusions (Fig. 10).
Spontaneous fluctuations in population activity preserve the population code
Neural responses vary during the repeated presentation of identical stimuli because they are modulated by internal inputs. Such inputs could represent changes of brain state (Niell and Stryker, 2010; Polack et al., 2013; Fu et al., 2014; Reimer et al., 2014; McGinley et al., 2015a; Vinck et al., 2015) or simply reflect spontaneous modulations occurring within a stable brain state. Internal inputs that cause modulations reflected in global population activity and correlation structure (Lin et al., 2015; Okun et al., 2015; Rabinowitz et al., 2015; Schölvinck et al., 2015) may impact population coding (Arandia-Romero et al., 2016). This raises the question of how population codes “survive” the ever-present modulations driven by internal inputs that may have little to do with the “external” stimulus being encoded.
Our study investigated this question and found that “internal” and external inputs have different effect on population codes. Specifically, we found that the population code for direction-of-motion is largely preserved across spontaneous internal input modulations (Figs. 8, 9), but not across changes in stimulus contrast that produce commensurate (actually smaller; Fig. 2) firing rate variations (Figs. 8, 9). We suggest that the reason for this difference is that internal input fluctuations appear to modulate gain more homogeneously across the population of layer 2/3 area V1 cells (Fig. 5). Further analysis on the most informative cells also revealed that changes in spontaneous population activity preserve population codes (Fig. 9). Our results are in general agreement with two recent studies, which found that: (1) groups of neurons comodulate with spontaneous fluctuation of population activity, which does not depend on the similarity of the neurons' preferred orientation (Okun et al., 2015); and (2) brain-state related neuronal fluctuations that occur spontaneously and are thereby uncorrelated with the stimulus do not impact decoding performance (Moreno-Bote et al., 2014). This suggests that population codes may be largely shared across internal states that modulate neuronal responses along multidimensional trajectories uncorrelated with the signal change.
Potential limitations
Overall, a spontaneous change in population activity level affects the population code much less than a stimulus contrast change from 100 to 40%. This occurs even though L2/3 aggregate firing rates change more in the former case (Fig. 2). Although our data argue that neural code appears to be remarkably robust to internal input fluctuations, we do not necessarily mean to imply invariance is perfect. Further study is needed to test the limits of this invariance. Furthermore, we cannot exclude the possibility that there may be a small subpopulation of cells that behave differently under internal fluctuations, as argued recently by Arandia-Romero et al. (2016). However, when considering the contribution of all neurons in area V1 layer 2/3 together, the neural code is robust to spontaneous modulations in population activity (Figs. 8, 9).
We note that population activity level, though it is known to reflect certain behavioral and brain-state changes (Niell and Stryker, 2010; Lee and Dan, 2012; Polack et al., 2013; Fu et al., 2014; Reimer et al., 2014), may have limitations as a surrogate measure of the internal input state. However, we believe that it is sufficient to support our claims. We base this on prior results showing that spontaneous neuronal PALs comodulate strongly with simultaneously recorded neighboring neuropil activity as well as EEG and ECoG activity (Kerr et al., 2005; Lee et al., 2017), often used to assess brain state (Lee and Dan, 2012). It is also important to note that we investigated the effect of internal input fluctuations occurring spontaneously, while animals are sedated or in the quiet-wakefulness state. It is interesting to consider in the future how active changes in brain state, such as modulations of attention, impact the conclusions we have drawn here.
Conclusion
The present study demonstrates that gain modulation induced by stimulus–contrast changes are heterogeneous across cells and reshape population codes, whereas gain responses induced by the fluctuation of internal inputs are more homogeneous and do not.
Footnotes
This work was supported by a Research Award from the Simons Foundation SFARI Research Award #402047 and by NINDS R21-NS096640 to S.M.S. We thank Drs. Emmanouil Froudarakis and Jake Reimer for helpful input regarding awake experiments, and Dr. Ryan Ash for editing suggestions.
The authors declare no competing financial interests.
References
- Allman J, Miezin F, McGuinness E (1985) Stimulus specific responses from beyond the classical receptive field: neurophysiological mechanisms for local-global comparisons in visual neurons. Annu Rev Neurosci 8:407–430. 10.1146/annurev.ne.08.030185.002203 [DOI] [PubMed] [Google Scholar]
- Arandia-Romero I, Tanabe S, Drugowitsch J, Kohn A, Moreno-Bote R (2016) Multiplicative and additive modulation of neuronal tuning with population activity affects encoded information. Neuron 89:1305–1316. 10.1016/j.neuron.2016.01.044 [DOI] [PMC free article] [PubMed] [Google Scholar]
- Berens P, Ecker AS, Cotton RJ, Ma WJ, Bethge M, Tolias AS (2012) A fast and simple population code for orientation in primate V1. J Neurosci 32:10618–10626. 10.1523/JNEUROSCI.1335-12.2012 [DOI] [PMC free article] [PubMed] [Google Scholar]
- Bishop CM. (2006) Pattern recognition and machine learning. New York: Springer. [Google Scholar]
- Boyd SP, Vandenberghe L (2004) Convex optimization. Cambridge, UK; New York: Cambridge UP. [Google Scholar]
- Brainard DH. (1997) The psychophysics toolbox. Spat Vis 10:433–436. 10.1163/156856897X00357 [DOI] [PubMed] [Google Scholar]
- Busse L, Wade AR, Carandini M (2009) Representation of concurrent stimuli by population activity in visual cortex. Neuron 64:931–942. 10.1016/j.neuron.2009.11.004 [DOI] [PMC free article] [PubMed] [Google Scholar]
- Chen TW, Wardill TJ, Sun Y, Pulver SR, Renninger SL, Baohan A, Schreiter ER, Kerr RA, Orger MB, Jayaraman V, Looger LL, Svoboda K, Kim DS (2013) Ultrasensitive fluorescent proteins for imaging neuronal activity. Nature 499:295–300. 10.1038/nature12354 [DOI] [PMC free article] [PubMed] [Google Scholar]
- Dana H, Chen TW, Hu A, Shields BC, Guo C, Looger LL, Kim DS, Svoboda K (2014) Thy1-GCaMP6 transgenic mice for neuronal population imaging in vivo. PloS one 9:e108697. 10.1371/journal.pone.0108697 [DOI] [PMC free article] [PubMed] [Google Scholar]
- Ecker AS, Berens P, Cotton RJ, Subramaniyan M, Denfield GH, Cadwell CR, Smirnakis SM, Bethge M, Tolias AS (2014) State dependence of noise correlations in macaque primary visual cortex. Neuron 82:235–248. 10.1016/j.neuron.2014.02.006 [DOI] [PMC free article] [PubMed] [Google Scholar]
- Finn IM, Priebe NJ, Ferster D (2007) The emergence of contrast-invariant orientation tuning in simple cells of cat visual cortex. Neuron 54:137–152. 10.1016/j.neuron.2007.02.029 [DOI] [PMC free article] [PubMed] [Google Scholar]
- Fiser J, Chiu C, Weliky M (2004) Small modulation of ongoing cortical dynamics by sensory input during natural vision. Nature 431:573–578. 10.1038/nature02907 [DOI] [PubMed] [Google Scholar]
- Fu Y, Tucciarone JM, Espinosa JS, Sheng N, Darcy DP, Nicoll RA, Huang ZJ, Stryker MP (2014) A cortical circuit for gain control by behavioral state. Cell 156:1139–1152. 10.1016/j.cell.2014.01.050 [DOI] [PMC free article] [PubMed] [Google Scholar]
- Goris RL, Movshon JA, Simoncelli EP (2014) Partitioning neuronal variability. Nat Neurosci 17:858–865. 10.1038/nn.3711 [DOI] [PMC free article] [PubMed] [Google Scholar]
- Graf AB, Kohn A, Jazayeri M, Movshon JA (2011) Decoding the activity of neuronal populations in macaque primary visual cortex. Nat Neurosci 14:239–245. 10.1038/nn.2733 [DOI] [PMC free article] [PubMed] [Google Scholar]
- Guizar-Sicairos M, Thurman ST, Fienup JR (2008) Efficient subpixel image registration algorithms. Opt Lett 33:156–158. 10.1364/OL.33.000156 [DOI] [PubMed] [Google Scholar]
- Haider B, Häusser M, Carandini M (2013) Inhibition dominates sensory responses in the awake cortex. Nature 493:97–100. [DOI] [PMC free article] [PubMed] [Google Scholar]
- Hofer SB, Mrsic-Flogel TD, Bonhoeffer T, Hübener M (2006) Prior experience enhances plasticity in adult visual cortex. Nat Neurosci 9:127–132. 10.1038/nn1610 [DOI] [PubMed] [Google Scholar]
- Holtmaat A, Bonhoeffer T, Chow DK, Chuckowree J, De Paola V, Hofer SB, Hübener M, Keck T, Knott G, Lee WC, Mostany R, Mrsic-Flogel TD, Nedivi E, Portera-Cailliau C, Svoboda K, Trachtenberg JT, Wilbrecht L (2009) Long-term, high-resolution imaging in the mouse neocortex through a chronic cranial window. Nat protocols 4:1128–1144. 10.1038/nprot.2009.89 [DOI] [PMC free article] [PubMed] [Google Scholar]
- Kerlin AM, Andermann ML, Berezovskii VK, Reid RC (2010) Broadly tuned response properties of diverse inhibitory neuron subtypes in mouse visual cortex. Neuron 67:858–871. 10.1016/j.neuron.2010.08.002 [DOI] [PMC free article] [PubMed] [Google Scholar]
- Kerr JN, Greenberg D, Helmchen F (2005) Imaging input and output of neocortical networks in vivo. Proc Natl Acad Sci U S A 102:14063–14068. 10.1073/pnas.0506029102 [DOI] [PMC free article] [PubMed] [Google Scholar]
- Kim S-J, Koh K, Lustig M, Boyd S, Gorinevsky D (2007) An interior-point method for large-scale l1-regularized least squares. IEEE J Sel Top Signal Process 1:606–617. 10.1109/JSTSP.2007.910971 [DOI] [Google Scholar]
- Krishnapuram B, Carin L, Figueiredo MA, Hartemink AJ (2005) Sparse multinomial logistic regression: fast algorithms and generalization bounds. IEEE Trans Pattern Anal Mach Intell 27:957–968. 10.1109/TPAMI.2005.127 [DOI] [PubMed] [Google Scholar]
- Lee SH, Dan Y (2012) Neuromodulation of brain states. Neuron 76:209–222. 10.1016/j.neuron.2012.09.012 [DOI] [PMC free article] [PubMed] [Google Scholar]
- Lee S, Meyer JF, Park J, Smirnakis SM (2017) Visually driven neuropil activity and information encoding in mouse primary visual cortex. Front Neural Circuits 11:50. 10.3389/fncir.2017.00050 [DOI] [PMC free article] [PubMed] [Google Scholar]
- Lin IC, Okun M, Carandini M, Harris KD (2015) The nature of shared cortical variability. Neuron 87:644–656. 10.1016/j.neuron.2015.06.035 [DOI] [PMC free article] [PubMed] [Google Scholar]
- Long M, Jiang W, Liu D, Yao H (2015) Contrast-dependent orientation discrimination in the mouse. Sci Rep 5:15830. 10.1038/srep15830 [DOI] [PMC free article] [PubMed] [Google Scholar]
- May KA, Zhaoping L (2011) Exploring the roles of saturating and supersaturating contrast-response functions in conjunction detection and contrast coding. J Vis 11(9):11 1–15. 10.1167/11.9.11 [DOI] [PubMed] [Google Scholar]
- McGinley MJ, David SV, McCormick DA (2015a) Cortical membrane potential signature of optimal states for sensory signal detection. Neuron 87:179–192. 10.1016/j.neuron.2015.05.038 [DOI] [PMC free article] [PubMed] [Google Scholar]
- McGinley MJ, Vinck M, Reimer J, Batista-Brito R, Zagha E, Cadwell CR, Tolias AS, Cardin JA, McCormick DA (2015b) Waking state: rapid variations modulate neural and behavioral responses. Neuron 87:1143–1161. 10.1016/j.neuron.2015.09.012 [DOI] [PMC free article] [PubMed] [Google Scholar]
- Michelson A. (1927) Studies in optics. Chicago: Chicago UP. [Google Scholar]
- Moreno-Bote R, Beck J, Kanitscheider I, Pitkow X, Latham P, Pouget A (2014) Information-limiting correlations. Nat Neurosci 17:1410–1417. 10.1038/nn.3807 [DOI] [PMC free article] [PubMed] [Google Scholar]
- Niell CM, Stryker MP (2010) Modulation of visual responses by behavioral state in mouse visual cortex. Neuron 65:472–479. 10.1016/j.neuron.2010.01.033 [DOI] [PMC free article] [PubMed] [Google Scholar]
- Okun M, Steinmetz N, Cossell L, Iacaruso MF, Ko H, Barthó P, Moore T, Hofer SB, Mrsic-Flogel TD, Carandini M, Harris KD (2015) Diverse coupling of neurons to populations in sensory cortex. Nature 521:511–515. 10.1038/nature14273 [DOI] [PMC free article] [PubMed] [Google Scholar]
- Peirce JW. (2007) The potential importance of saturating and supersaturating contrast response functions in visual cortex. J Vis 7(6):13 1–10. 10.1167/7.6.13 [DOI] [PMC free article] [PubMed] [Google Scholar]
- Polack PO, Friedman J, Golshani P (2013) Cellular mechanisms of brain state-dependent gain modulation in visual cortex. Nat Neurosci 16:1331–1339. 10.1038/nn.3464 [DOI] [PMC free article] [PubMed] [Google Scholar]
- Rabinowitz NC, Goris RL, Cohen M, Simoncelli EP (2015) Attention stabilizes the shared gain of V4 populations. eLife 4:e08998. 10.7554/eLife.08998 [DOI] [PMC free article] [PubMed] [Google Scholar]
- Reimer J, Froudarakis E, Cadwell CR, Yatsenko D, Denfield GH, Tolias AS (2014) Pupil fluctuations track fast switching of cortical states during quiet wakefulness. Neuron 84:355–362. 10.1016/j.neuron.2014.09.033 [DOI] [PMC free article] [PubMed] [Google Scholar]
- Sani I, Santandrea E, Golzar A, Morrone MC, Chelazzi L (2013) Selective tuning for contrast in macaque area V4. J Neurosci 33:18583–18596. 10.1523/JNEUROSCI.3465-13.2013 [DOI] [PMC free article] [PubMed] [Google Scholar]
- Sceniak MP, Ringach DL, Hawken MJ, Shapley R (1999) Contrast's effect on spatial summation by macaque V1 neurons. Nat Neurosci 2:733–739. 10.1038/11197 [DOI] [PubMed] [Google Scholar]
- Schölvinck ML, Saleem AB, Benucci A, Harris KD, Carandini M (2015) Cortical state determines global variability and correlations in visual cortex. J Neurosci 35:170–178. 10.1523/JNEUROSCI.4994-13.2015 [DOI] [PMC free article] [PubMed] [Google Scholar]
- Sclar G, Freeman RD (1982) Orientation selectivity in the cat's striate cortex is invariant with stimulus contrast. Exp Brain Res 46:457–461. 10.1007/BF00238641 [DOI] [PubMed] [Google Scholar]
- Shadlen MN, Newsome WT (1998) The variable discharge of cortical neurons: implications for connectivity, computation, and information coding. J Neurosci 18:3870–3896. 10.1523/JNEUROSCI.18-10-03870.1998 [DOI] [PMC free article] [PubMed] [Google Scholar]
- Skottun BC, Bradley A, Sclar G, Ohzawa I, Freeman RD (1987) The effects of contrast on visual orientation and spatial frequency discrimination: a comparison of single cells and behavior. J Neurophysiol 57:773–786. 10.1152/jn.1987.57.3.773 [DOI] [PubMed] [Google Scholar]
- Smith SL, Häusser M (2010) Parallel processing of visual space by neighboring neurons in mouse visual cortex. Nat Neurosci 13:1144–1149. 10.1038/nn.2620 [DOI] [PMC free article] [PubMed] [Google Scholar]
- Vinck M, Batista-Brito R, Knoblich U, Cardin JA (2015) Arousal and locomotion make distinct contributions to cortical activity patterns and visual encoding. Neuron 86:740–754. 10.1016/j.neuron.2015.03.028 [DOI] [PMC free article] [PubMed] [Google Scholar]
- Zohary E, Shadlen MN, Newsome WT (1994) Correlated neuronal discharge rate and its implications for psychophysical performance. Nature 370:140–143. 10.1038/370140a0 [DOI] [PubMed] [Google Scholar]


