

Abstract
Crigler‐Najjar syndrome type 1 (CN1) is an autosomal recessive disease caused by a marked decrease in uridine‐diphosphate‐glucuronosyltransferase (UGT1A1) enzyme activity. Delivery of hUGT1A1‐modRNA (a modified messenger RNA encoding for UGT1A1) as a lipid nanoparticle is anticipated to restore hepatic expression of UGT1A1, allowing normal glucuronidation and clearance of bilirubin in patients. To support translation from preclinical to clinical studies, and first‐in‐human studies, a quantitative systems pharmacology (QSP) model was developed. The QSP model was calibrated to plasma and liver mRNA, and total serum bilirubin in Gunn rats, an animal model of CN1. This QSP model adequately captured the observed plasma and liver biomarker behavior across a range of doses and dose regimens in Gunn rats. First‐in‐human dose projections made using the translated model indicated that 0.5 mg/kg Q4W dose should provide a clinically meaningful and sustained reduction of >5 mg/dL in total bilirubin levels.
Study Highlights.
WHAT IS THE CURRENT KNOWLEDGE ON THE TOPIC?
☑ In vivo mechanism of action and expected clinical pharmacology of a novel hUGT1A1‐modRNA formulated as lipid nanoparticle to treat CN1 is unknown.
WHAT QUESTION DID THIS STUDY ADDRESS?
☑ We report a QSP model that integrates preclinical data from studies in Gunn rats with known physiological differences between humans and Gunn rats to provide a deeper understanding of the mechanisms of hUGT1A1‐modRNA and to guide design of the first‐in‐human clinical studies.
WHAT DOES THIS STUDY ADD TO OUR KNOWLEDGE?
☑ To our knowledge, this is the first in vivo pharmacology‐based QSP model to connect bilirubin production, metabolism, and elimination, to mRNA therapeutic delivered by a lipid nanoparticle.
HOW MIGHT THIS CHANGE DRUG DISCOVERY, DEVELOPMENT, AND/OR THERAPEUTICS?
☑ Projections from the QSP model support the potential of hUGT1A1‐modRNA as a novel treatment option for patients with CN1 via reduction of pathogenic bilirubin levels.
Crigler Najjar syndrome type 1 (CN1) is a chronic congenital condition of unconjugated hyperbilirubinemia with a prevalence 0.6/million.1 Due to the absence of uridine‐diphosphate‐glucuronosyltransferase (UGT1A1) activity in patients with CN1, the hydrophobic unconjugated bilirubin clears slowly, which causes its accumulation in the circulation, deposition into tissues, and transport through the blood brain barrier. The accumulation of unconjugated bilirubin in the brain puts patients with CN1 at high risk for bilirubin‐induced neurological deficits (i.e., kernicterus/bilirubin‐induced neurologic damage), leading to speech impairment, ataxia, and death if untreated. This is especially true with sustained bilirubin levels in excess of 20 mg/dL or where the bilirubin:albumin ratio is >0.7.
Phototherapy (8–12 hours/day) is the standard of care treatment for patients with CN1, effective in infants and children under 10 years old. Phototherapy blue light converts bilirubin to photobilirubin, lumirubin, and other oxidation products that are more rapidly eliminated compared to unmodified bilirubin.2 However, treatment becomes less effective with age, and ultimately patients with CN1 require a liver transplant.3, 4, 5 Remarkably, data from patients with less severe forms of UGT1A1 deficiency, such as Crigler Najjar syndrome type 2 (CN2) or Gilbert syndrome, indicates that even partial restoration of UGT1A1 activity may allow discontinuation of phototherapy. In patients with CN2, bilirubin levels can range from 5–23 mg/dL with <10% UGT1A1 activity of healthy controls and these patients generally do not have bilirubin‐induced neurologic damage and consequently do not require liver transplants. Patients with Gilbert syndrome maintain bilirubin levels below 4 mg/dL with 10–35% UGT1A1 activity of healthy controls and remain healthy.
A new hUGT1A1‐modRNA therapy discussed in this report aims to enable hepatic expression of functional UGT1A1 enzyme to restore the normal bilirubin clearance pathway. The hUGT1A1‐modRNA has been formulated within a proprietary lipid nanoparticle (LNP) to enable hepatic delivery and subsequent expression of UGT1A1 protein in hepatocytes. In healthy individuals, UGT1A1 is expressed in the liver, bile duct, stomach, and colon and specifically catalyzes the covalent linkage of glucuronic acid to one or both propionic acid side chains of bilirubin. Unconjugated bilirubin is formed as a breakdown product of heme and circulates as albumin bound form. As illustrated in Figure 1, once bilirubin enters the hepatocyte via a transport protein, it is transported to the smooth ER where it is conjugated by UGT1A1 to form bilirubin monoglucuronides and diglucuronides (DGTs), which imparts solubility and allows secretion via the bile duct. A fraction of the hepatocyte bilirubin DGT conjugates are secreted back into the circulation for eventual reuptake by downstream hepatocytes in what is termed “hepatocyte hopping.”
Figure 1.
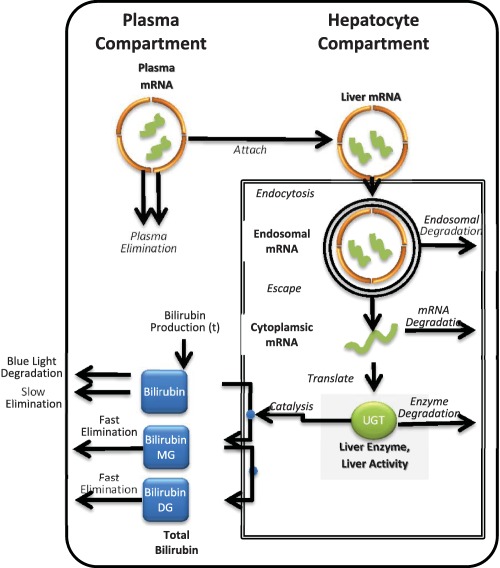
Schematic for the quantitative systems pharmacology (QSP) model of hUGT1A1‐modRNA. The QSP model describes: the elimination of lipid nanoparticle (LNP) from the plasma due to liposomal instability, the uptake of LNP by endocytosis into liver hepatocytes, the release of mRNA from the endosome into the cytoplasm, the transcription of the mRNA to produce uridine‐diphosphate‐glucuronosyltransferase (UGT1A1 protein, and the glucuronidation of bilirubin by UGT1A1 leading to the increased clearance of bilirubin). DG, diglucuronides; MG, monoglucuronides.
This report presents a quantitative systems pharmacology (QSP) model that was developed using in vitro and in vivo pharmacology data for hUGT1A1‐modRNA in preclinical studies and the anticipated pharmacology of hUGT1A1‐modRNA in patients with CN1. The anticipated human pharmacology of hUGT1A1‐modRNA is complex due to the multistep mechanism of action that involves absorption of the LNP into the liver, translation of the mRNA into UGT1A1, and ultimately the enzymatic activity of UGT1A1 to modify bilirubin and promote its elimination. As a result, the activity of hUGT1A1‐modRNA is anticipated to extend beyond the time that hUGT1A1‐modRNA can be detected in the plasma. The processes determining the kinetics of the enzymatic response (e.g., LNP stability in the plasma, mRNA turnover in hepatocytes, and UGT1A1 protein turnover) are complex and require a mechanistic modeling approach to shed light on hUGT1A1‐modRNA mode action in vivo, and to enable translation of preclinical data to clinic. The QSP model contains detailed multistep mechanisms of hUGT1A1‐modRNA, particularly capturing the delay and extended time course of each step that leads to a prolonged pharmacodynamic response. The model was initially calibrated and benchmarked to multidose studies in the Gunn Rat.6 The model adequately predicts the observed bilirubin kinetics observed over a range of doses and dose regimens. Finally, the model was translated to humans to make first‐in‐human dose projections to provide guidance on efficacious dosing regimen.
METHODS
Animals
The care and use of animals were carried out in accordance with protocols approved by Alexion Pharmaceutical's Institutional Animal Care and Use Committee. Animals used in this study were Gunn rats, Gunn‐UGT1a1j/BluHsdRrrc (Rat Resource & Research Center, Columbia, MO). Following weaning, rats were maintained on standard chow ad libitum with plenty of fresh, clean water available at all times and maintained under 12‐hour light/dark cycles. The test article is a modified mRNA molecule, produced using a cell‐free manufacturing process, encoding for the native human UGT1A1 protein encapsulated in LNP. To assess the effect of mRNA and LNP formulation, an mRNA molecule encoding for the luciferase protein was used and phosphate‐buffered saline‐treated animals were utilized as negative control. All articles were administered i.v. via the tail vein.
Measuring plasma and tissue pharmacokinetics and of hUGT1A1‐modRNA in Gunn rats
Hybridization enzyme‐linked immunosorbent assay, also known as the Quantigene 2.0 branched‐DNA assay, was used to quantitatively measure hUGT1A1‐modRNA levels in plasma and liver. This method utilizes hUGT1A1‐modRNA sequence‐specific probe sets to specifically capture the hUGT1A1‐modRNA from plasma and liver lysates on to the assay plates. Sequence of kit‐specific probes was used to measure the mRNA levels as luminescence signal readouts. The luminescence signal obtained from the assay is proportional to the mRNA concentration in the samples, which is back calculated against a calibration curve generated from a standard serial dilution of the test articles in respective matrices.
Measuring plasma total bilirubin levels in plasma of Gunn rats
Plasma total bilirubin was measured using the Total Bilirubin Reagent kit (catalog #OSR6512) in the Beckman Coulter Clinical Analyzer. The assay was a human‐specific, commercially available reagent manufactured by Beckman Coulter for the AU2700/AU640 automated clinical chemistry analyzers. These reagents were fit‐for‐purpose validated for use with rat serum and plasma. The assay itself is a variation of the classical diazo method. A stabilized diazonium salt, 3,5‐dichlorophenyldiazonium tetrafluoroborate, reacts with bilirubin to form azobilirubin, which absorbs at 570/660 nm. The absorbance at 570/660 nm is proportional to the bilirubin concentration in the sample.
Single dose pharmacokinetic/pharmacodynamic study in Gunn rats
The pharmacokinetics (PKs) and pharmacodynamics (PDs) of hUGT1A1‐modRNA were evaluated in a single dose study in Gunn rats. A single bolus dose of 0.3 mg/kg of hUGT1A1‐modRNA was administered. Plasma samples were taken for PK analysis at 0, 0.5, 3, 6, 8, 12, 24, 48, and 72 hours postdosing. In addition, livers were harvested at 6, 12, 24, 48, and 72 hours postdosing for tissue PK analysis. Noncompartment PK analysis was performed to obtain exposure (peak plasma concentration (Cmax) and area under the curve (AUC)) information in plasma and liver (data not shown).
Multiple dose PD study in Gunn rats
The PDs of hUGT1A1‐modRNA were evaluated in a multiple dose study. The study included male and female animals as well as adolescent and adult animals. Plasma samples were serially sampled for bilirubin analysis at 0, 0.5, 3, 6, 8, 12, 24, 48, and 72 hours postdosing. Livers were harvested after termination at 6, 12, 24, 48, and 72 hours postdosing and UGT1A1 protein expression was measured in liver homogenates. As no clear gender or age differences were noted in the PK data, all data from the four groups were pooled together for model calibration. However, for visual clarity when plotting, only mean and SD is shown for the observed data in the figures.
QSP model construction
A QSP model was developed based on known mechanisms of LNP stability, biodistribution, attachment to hepatocytes, endocytic uptake, intracellular unpacking of LNPs, protein expression of UGT1A1, and enzymatic modification of bilirubin leading to its increased clearance.7, 8, 9 All reactions are modeled with zero, first, and second order mass action reactions. These reactions and associated parameters (rate constants and compartment volumes) are provided as Supplementary Material.
All models were implemented using KroneckerBio version 0.4. Simulation runs, parameter estimation, and parameter scans were performed using MATLAB version 2015b (Mathworks, Natick, MA). KroneckerBio is open source software and is maintained at https://github.com/kroneckerbio. The version of KroneckerBio used for these simulations was tested prior to use and is archived by Applied BioMath.
QSP model calibration
The model was simultaneously fit to the pooled data from the single dose PK/PD study and from the repeat dose PD study using a maximum likelihood estimator. Global nonlinear least‐squares fitting was performed using the KroneckerBio command FitParameters with a constant plus linear error model. A separate error model was estimated for each dataset to account for differences in the sample SDs within each dataset. Parameters that were not practically identifiable were fixed at their initial values obtained or inferred from the literature. Post hoc analysis was performed to confirm that the optimum was an isolated minimum. Visual predictive checks were performed to evaluate model fits.
RESULTS
QSP model development
A QSP model was constructed (Figure 1) to include key PK, distributional, enzymatic, transport, and degradation processes involved in the hUGT1A1‐modRNA mode of action in vivo. Specifically, the model includes: (1) elimination of LNP from the plasma due to liposomal instability; (2) the uptake of LNP by endocytosis into liver hepatocytes; (3) release of mRNA from the endosome into the cytoplasm; (4) the transcription of the mRNA to produce UGT1A1 protein; and (5) glucuronidation of bilirubin by UGT1A1 leading to (6) increased clearance of bilirubin. Key model outputs corresponding to the experimentally measured endpoints are: (1) plasma levels of intact LNP; (2) the mRNA levels in the liver; (3) the UGT1A1 expression in the liver; and (4) total plasma bilirubin (unmodified and modified). The full set of mechanisms built in the model and corresponding parameters are provided in Table 1 8–15 (Gunn rats and patients with CN1). A single set of parameters was able to describe all Gunn Rat studies. One parameter (kprod) was used to describe the higher bilirubin production rates in juvenile rats based on natural history studies with Gunn rats (data not shown) and bilirubin levels in the luciferase control. All other parameters were kept constant between studies.
Table 1.
QSP model parameters for Gunn rat and human subjects
| Description | Parameter | Gunn rat | Human | Units | Estimated or fixed | Lit values |
|---|---|---|---|---|---|---|
| First order elimination of LNP | kw | 2.41E‐05 | 2.41E‐05 | 1/s | Estimated | No published rat data but kw = 4e‐5‐3e‐4 in mice9 |
| Drug distribution (Vc → Vp) | k12 | 4.79E‐05 | 4.79E‐05 | 1/s | Estimated | Not published |
| Drug distribution (Vp → Vc) | k21 | 2.65E‐07 | 2.65E‐07 | 1/s | Estimated | Not published |
| Drug attachment | ka | 1.17E‐05 | 1.17E‐05 | 1/s | Estimated | Lit range 4e5‐1.4e48 |
| Drug endocytosis | ke | 7.70E‐05 | 7.70E‐05 | 1/s | Estimated | Lit range 4e5‐1e38 |
| Endosomal degradation | de | 9.32E‐05 | 9.32E‐05 | 1/s | Estimated | No published rat value but data from mice9 show the majority (50–70%) of mRNA escapes the endosome. This suggesting this parameter is lower in these studies. |
| Escape from endosome | kl | 1.93E‐05 | 1.93E‐05 | 1/s | Estimated | |
| mRNA degradation | dmRNA | 1.07E‐05 | 1.07E‐05 | 1/s | Estimated | 2.1e‐5 median human mRNA12 |
| Translation rate | kt | 17.73 | 17.73 | 1/s | Estimated | Not published |
| Cytoplasmic protein degradation | dUGTc | 6.76E‐06 | 6.76E‐06 | 1/s | Estimated | 1.9e‐5 1/s in rat hepatocytes (Emi 2002) 4e‐6 median human protein12 |
| Elimination of bilirubin | kclearBil | 3.5E‐06 | 1.23E‐6 | 1/s | Fixed | Gunn rat,10 human data11 |
| Elimination of monoglucuronide bilirubin | kclearMGT | 3.5E‐05 | 1.23E‐5 | 1/s | Fixed | Assumed equal to DGT |
| Elimination of diglucuronide bilirubin | kclearDGT | 3.5E‐05 | 1.23E‐5 | 1/s | Fixed | Assumed 10× unmodified elimination rate |
| Protein binding on rate | kon | 0.001 | 0.001 | nM−1*s−1 | Fixed | Typical protein–protein on‐rate15 |
| Enzyme kcat rate for glucuronidation | kcat | 0.0011 | 0.0011 | 1/s | Fixed | Measured in liver microsomes13 |
| Protein unbinding off‐rate | koff | 0.2589 | 0.2589 | 1/s | Fixed | Computed from Km = 0.20 uM and Km = (koff + kcat)/kon15 |
| Production rate of unmodified bilirubin | kprod | Variable | Variable | 1/s | Estimated | Set to match the steady‐state bilirubin levels in the modeled individual or group. In juvenile rats, this was a time‐varying quantity fit to match the luciferase control group. |
DGT, diglucuronide; LNP, lipid nanoparticle; QSP, quantitative systems pharmacology; UGT, uridine‐diphosphate‐glucuronosyltransferase.
Model calibration to single dose PK/PD study and repeat dose PD study
The QSP model was calibrated to two datasets. The first dataset came from a single dose PK/PD study in adolescent and juvenile Gunn rats (Figure 2). In this study, plasma and liver PKs of hUGT1A1‐modRNA were measured following a single 0.3 mg/kg dose of hUGT1A1‐modRNA. Plasma bilirubin levels were measured at all PK time points and terminal liver samples were collected and analyzed for UGT1A1 mRNA expression at a smaller set of time points. The second dataset came from a multiple dose study in adult Gunn rats following five doses of 0.1, 0.2, and 0.5 mg/kg of hUGT1A1‐modRNA administered every 2 weeks (Q2W), or 0.5 mg/kg administered every 4 weeks (Q4W). An LNP containing luciferase mRNA was administered at 0.5 mg/kg Q2W as a vehicle control. Total bilirubin levels were serially sampled predose through day 84.
Figure 2.
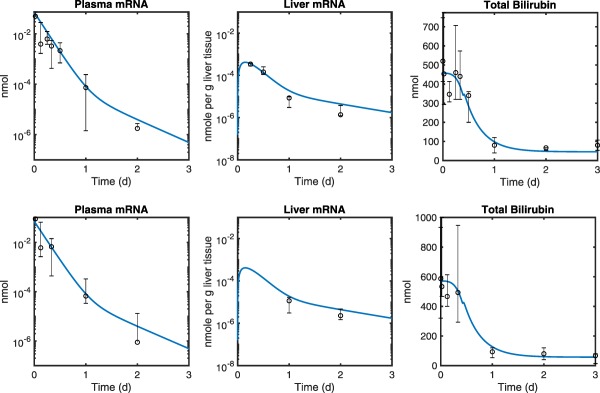
The quantitative systems pharmacology model fits (blue lines) overlaid with experimental data in a single dose (0.3 mg/kg) pharmacokinetic/pharmacodynamic study with ALXN1540 in Gunn rats. Plasma and liver mRNA measurements along with total bilirubin levels were compared in both adult (A, N = 4–5) and juvenile (B, N = 5) Gunn rats. Markers represent the median and error bars denote the range of replicate data values at each time point. Plasma samples were serially collected from individual animals. Liver samples were collected upon termination. The solid blue line is a global fit to the collected data that pools both the juvenile and adult animal data. The only parameter different between the two groups was the initial total bilirubin level, which is higher in the juvenile group.
The data from the two studies were fit using a global maximum‐likelihood method. A sensitivity analysis using parameter scanning, 10× up and down from the best fit estimates, was used to identify parameters that were not practically identifiable (Supplementary Figure S1), and, hence, fixed to their initial estimates obtained or inferred from the literature. Furthermore, a systematic sensitivity analysis based on area under the absolute sensitivities was performed to explore the impact of model parameters on the time course of total bilirubin levels in rat studies (Supplementary Figure S2). Table 1 8–15 presents the model parameters estimated from the rat data or fixed/inferred using the literature data. A 20% parameter variation around the estimated or fixed values captured the data variability observed in the rat studies indicating the magnitude of uncertainty in parameter values (data not shown). The parameter vs. objective function curves for protein binding on‐rate constant (kon), protein binding dissociation rate constant (koff), and elimination rate of monoglucuronide bilirubin (kclearMGT) were found to be flat indicating that the model fit is not sensitive to the value of these parameters over this range. Whereas, the elimination rate of bilirubin (kclearBil) and elimination rate of DGT bilirubin (kclearDGT) are highly sensitive. There are one‐sided sensitives for first order elimination rate of LNP (kw) and drug distribution rate constant from plasma to tissue (k12) indicating that a higher value for these parameters is less likely than a lower value.
The plasma half‐life of LNP was determined to be ∼8 hours (kw = 2.41E‐05 1/s). The mRNA degradation rate in the liver was estimated to be ∼18 hours (dmRNA = 1.07E‐05), a value consistent with the cytoplasmic half‐life of hUGT1A1‐modRNA (13.4 hours; 18.4–10.4 mean and 95% confidence interval) estimated in the Gunn rat in a separate study using liver tissue (Supplementary Figure S3). The literature values that exist for model parameters are in good agreement with the estimated values.8, 9, 10, 11, 12, 13, 14, 15, 16 The best fits (Figures 2 and 3) and model diagnostics (Supplementary Figures S4 and S5) indicate that the model adequately describes the PK and PD data. Of note, a time varying change in the bilirubin level was seen in the luciferase control group in which the plasma bilirubin levels dropped from day 0 to day 21 in all animals. In a subsequent study (data not shown) similar behavior was observed in a larger set of animals that was seen to be an age effect, and part of the natural history of Gunn rats. To account for this effect in the model, a time varying production rate was fit to describe this background change in the bilirubin level. It was assumed the treated groups would have this same time varying production rate.
Figure 3.
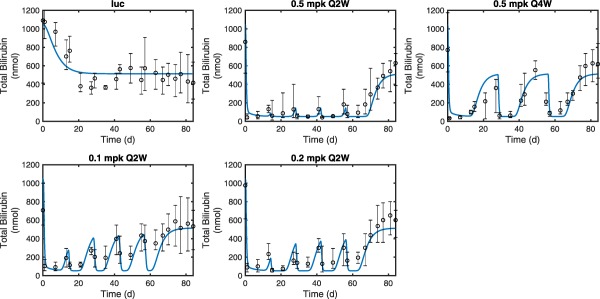
The quantitative systems pharmacology model fits (blue lines) overlaid with experimental measurements of total bilirubin in a repeat dose pharmacodynamic study in Gunn rats (N = 4–5 per time point). Luciferase (luc) control treatment (top left) was used to compare against multiple dose levels (0.1, 0.2, and 0.5 mg/kg) with two different dosing schedules for 0.5 mg/kg (Q2W vs. Q4W). Markers represent the median and error bars denote the range of replicate data values at each time point.
Prediction of plasma bilirubin and UGT1A1 levels in escalating single dose Gunn rat PD study
To test the predictive quality of the QSP model, the model was used to make naive predictions of total bilirubin reduction in an additional Gunn rat study not included during the model calibration. In this study, a single bolus dose of hUGT1A1‐modRNA was given at 0.1, 0.2, and 0.5 mg/kg. Serial blood samples were collected and analyzed for total plasma bilirubin concentrations. In addition, terminal tissue samples were collected on days 1, 3, 7, 9, 11, and 14 for animals dosed with 0.1 and 0.2 mg/kg and days 1, 2, 7, 10, 14, and 21 for the group dosed with 0.5 mg/kg and analyzed for liver UGT1A1 protein expression (arbitrary scale) by capillary electrophoresis. As the latter was not quantitative, these data were treated as proportional to UGT1A1 concentration. An optimal proportionality constant was used to relate model output in absolute units to the arbitrary scale of the expression data. Although there was a luciferase control group included in the previous study that could be used to estimate the changing production rate of bilirubin over time, there was no similar group in this study. As the animals were older in this study, and bilirubin production levels stabilize in older animals, a constant bilirubin production rate was assumed that was consistent with a natural history study. The comparison of the model prediction to the data is shown in Figure 4. As shown, the model predictions are in general agreement with the observed data. For all three dose levels, a similar initial reduction of bilirubin is predicted, but dose levels differ in the predicted duration in which bilirubin levels are held at the nadir level. Note that total bilirubin and UGT1A1 mRNA expression time course data from this study were not used at the calibration stage.
Figure 4.
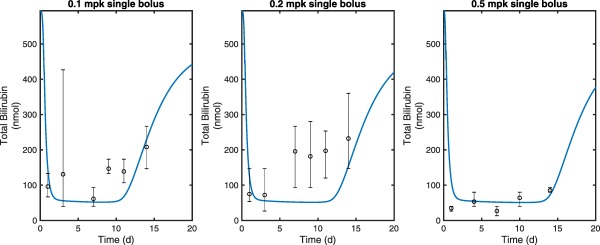
The quantitative systems pharmacology model fits (blue lines) overlaid with experimental measurements of total bilirubin from escalating single dose (0.1, 0.2, and 0.5 mg/kg) pharmacodynamic study of ALXN1540 in Gunn rats (N = 4–6 per time point). Markers represent the median and error bars denote the range of individual data values at each time point.
Translation of the QSP model to predict response in the CN1 subjects
The QSP model was humanized based on a hybrid approach that involved utilization of human‐specific parameters as well as those fixed to the estimates from Gunn rats. The main parameters that are anticipated to be different between Gunn rats and patients with CN1 are the production and clearance rates of unmodified bilirubin. The production, biodistribution, and elimination of bilirubin have been studied by carbon‐14 isotype labeling in healthy volunteers, in a patient with jaundice, and in the Gunn rat model10, 11, 17 (Supplementary Table S1). Schmid and Hammaker11 measured the half‐life of C14‐labeled bilirubin in a single 4½ year old subject with congenital nonhemolytic jaundice to be 156 hours, compared to the elimination half‐life of 0.45 hours found in healthy human subjects.17 Gunn rats also exhibit a prolonged elimination half‐life of 55 hours for bilirubin, which is much longer than that of healthy humans, but is 2.8‐fold faster than the one measured in the congenital nonhemolytic jaundice subject. In contrast to the elimination rates, the production rate of bilirubin was remarkably similar between the three datasets, ranging from 3–3.8 mg/kg/day. The full human and Gunn rat parameter sets are provided in Supplementary Table S1. Consistent with these data, in our model, we used bilirubin half‐life of 156 hours for patients with CN1, which results in a slower rebound of bilirubin during the recovery period after dosing.
In contrast to the bilirubin synthesis and clearance rate, other parameters used in the QSP model represent biophysical interactions or cellular processes that are expected to be preserved between humans and rats and fixed as such in the human model (Table 1). For example, as the major clearance route of plasma LNP is thought to be LNP instability,8, 9 the elimination rate was assumed to be the same in humans and Gunn rats. For a subset of parameters (e.g., UGT1A1 catalytic rate (kcat) and UGT1A1 protein half‐life), measurements from human primary cells, in vitro human hepatocytes, or liver microsomes were available.14 In such cases, measured values were similar to those fixed based on the rat estimates, providing confidence in the translation approach. Physiological value of 3L was used for the plasma volume in the human model.
First‐in‐human dose projections for hUGT1A1‐modRNA
To predict the lowering effect on plasma bilirubin at various doses and dose regimens of hUGT1A1‐modRNA, a series of first‐in‐human dose simulations were conducted. Doses ranged from 1.0·10−5 to 1.0 mg/kg were administered as a single dose, once weekly (Q1W), every other week (Q2W), every 3 weeks (Q3W), or every 4 weeks (Q4W). Figure 5 a‐e shows predicted bilirubin levels vs. time. In addition to the time course, a dose response plot (Figure 5 F) shows dose vs. bilirubin levels at the end of the dose interval (or at day 7 for the case of the single dose). We used a sustained 5 mg/dL reduction of bilirubin levels as a benchmark for a clinically relevant reduction of bilirubin (dashed line). Based on these simulations, it is possible to achieve a transient 5 mg/dL reduction in total bilirubin with a single dose of 0.005 mg/kg. Likewise, a dose of 0.5 mg/kg Q4W is predicted to result in a sustained 5 mg/dL reduction of total bilirubin. These simulation results suggest 0.5 mg/kg Q4W as a likely efficacious dosing regimen in patients with CN1. Figure 5 F shows that giving the drug more frequently causes a supraproportional reduction in the dose required to maintain 5 mg/dL reduction in total bilirubin. In particular, an ∼25‐fold reduction in the dose required to maintain a 5 mg/dL reduction in bilirubin by switching from Q4W to Q3W. Likewise, a Q1W dose of 0.005 mg/dL is predicted to result in a >15 mg/dL reduction in total bilirubin. These results suggest that a future multiple ascending dose study in patients with CN1 should explore Q1W and Q4W for clinical efficacy.
Figure 5.
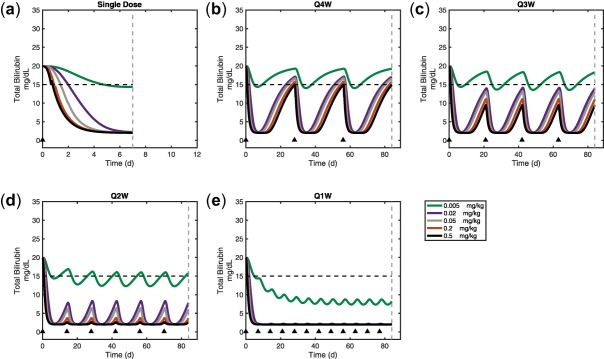
First‐in‐human predictions of bilirubin lowering for a dose range of a single dose, or every 1, 2, 3, or 4 weekly doses of ALXN1540 (a, b, c, d, e, respectively). Model predicted human dose response curve for steady‐state, trough bilirubin levels for each dosing schedule (f). Dose times are marked with a black triangle. Time point for dose response value is denoted by the dashed lines in subplots a–e.
DISCUSSION
A QSP model of hUGT1A1‐modRNA mechanism of action in vivo was built and calibrated using in vitro and in vivo pharmacology data and preclinical PK/PD studies, and subsequently utilized to provide insight into the mechanism of action of hUGT1A1‐modRNA, to support translation from preclinical to clinical studies, and ultimately to support first‐in‐human studies. This model described complex kinetics processes starting from drug dosing to bilirubin lowering in plasma. Using the model, we were able to link: (1) the dose of hUGT1A1‐modRNA to (2) plasma and tissue PK (mRNA) to (3) UGT1A1 protein expression in hepatocytes to (4) conjugated and unconjugated bilirubin levels in the plasma.
The majority of the model parameters were estimated from data collected in Gunn rats, a rodent model of CN1 disease. This model was used to make successful quantitative predictions in Gunn rats. The model was then translated to provide dosing guidance for patients with CN1. Results from the translated human model predicted that lowering bilirubin levels by 5 mg/dL seems to be feasible with a dose of 0.5 mg/kg Q4W. A significant (and nonlinear) reduction in total dose can be achieved by dosing more frequently (0.002 mg/kg Q3W is predicted to have a similar sustained reduction of bilirubin as 0.5 mg/kg Q4W). These results are robust to 20% parameter perturbations in all model parameters (Supplementary Figure S6). A 20% variation in parameter values also captured the data variability seen in Gunn rat studies (data now shown), justifying the magnitude of parameter uncertainty used to predict the human response.
Overall, the model provides a mechanistic explanation for the various phases of the PD response (total bilirubin) observed in Gunn rats and predicted PD for patients with CN1 (Figure 6). Prior to dosing, baseline bilirubin levels are a function of the balance between bilirubin synthesis and clearance. Upon dosing, UGT1A1 expression drives down bilirubin levels with the maximum slope being defined by the clearance rate of doubly modified conjugated bilirubin (the DGT). At a sufficiently high drug dose, the produced UGT1A1 is in excess of the amount needed to convert newly synthesized bilirubin. The nadir level of bilirubin is determined by the bilirubin synthesis rate and the clearance rate of DGT. The duration of time for which this nadir level is maintained is determined by the peak level of mRNA delivered to the liver, and the half‐lives of liver mRNA and protein. When there is insufficient UGT1A1 to maintain nadir levels of bilirubin, the level rebounds. The rebound rate is determined by bilirubin synthesis rate and endogenous bilirubin clearance. Note that a significant interspecies difference is expected in this phase, with an anticipated slower rebound in patients with CN1 due to slower bilirubin turnover kinetics.
Figure 6.
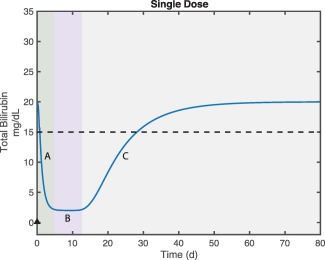
Explanation of bilirubin response phases. The green region (A) shows postdose bilirubin reduction where excess uridine‐diphosphate‐glucuronosyltransferase (UGT1A1) expression leads to decline in total bilirubin. As most bilirubin is converted to the diglucuronide form, the slope is determined by the clearance rate of the diglucuronide. The purple region (B) shows the new steady state of total bilirubin. As the majority of bilirubin is in diglucuronide form the nadir level is determined by the balance of bilirubin production and the clearance rate of the diglucuronide. Gray region (C) captures the phase during which there is insufficient UGT1A1 to maintain the nadir bilirubin levels the total bilirubin returns to the original steady state. The majority of the bilirubin in this phase is unmodified so the kinetics is determined by the balance of bilirubin production and clearance of unmodified bilirubin.
As might be expected, the model is able to show that it is not necessary to maintain sustained plasma mRNA in order to maintain nadir levels of bilirubin. However, and somewhat counterintuitively, the model also shows that sustained bilirubin lowering can be maintained without maintaining sustained liver mRNA or UGT1A1 expression. This effect is due to the slow kinetics of bilirubin production, which leads to a slow recovery of baseline levels. If doses are given with sufficient frequency, it is possible to maintain clinically relevant reductions in bilirubin without maintaining sustained UGT1A1 expression. In general, the drug doses needed to maintain nadir bilirubin levels are similar between Gunn rats and patients with CN1, despite much higher starting bilirubin levels in CN1 subjects compared with Gunn rats. The difference in baseline bilirubin levels in CN1 subjects vs. Gunn rats is primarily due to differences in the elimination half‐life of bilirubin (156 vs. 55 hours; Table 1 8–15) as compared to the production rate, which is more similar (3.0 vs. 3.25 mg/kg/day).
In summary, this work presents the development of a QSP model to describe the PK/PD of hUGT1A1‐modRNA. A traditional PK model with allometric scaling, such as the one used for small molecules18 or biologics,19, 20 has not been explored for the modRNA platform given the lack of precedence for such a novel approach. Allometric coefficients derived from large datasets containing small molecules or biologics are not directly applicable to the modRNA platform because the inherent kinetics of the target plays an important role in the selection of an optimal dose and dose regimen. Moreover, the predicted dose regimen is determined by a combination of drug characteristics and biological mechanisms (e.g., the intracellular half‐life of mRNA and UGT1A1) that are unlikely to be scaled allometrically based on body weights or surface areas. A QSP model‐based approach is likely to provide greater predictive power than the empirical PK/PD approaches because QSP models can take advantage of datasets from multiple settings (e.g., in vitro and in vivo) and multiple species/indications (e.g., rats, healthy volunteers, and CN1 subjects) to provide deeper insights into drug mechanisms and pharmacology. For example, the QSP model has the ability to incorporate key target related parameters (bilirubin synthesis, conversion, and clearance rates) that have been previously measured in Gunn rats,10 in healthy human subjects,17 and in one nonhemolytic jaundice subject.11 Additionally, the model can project consequences of these parameters, which in this case are nonlinear, and not anticipated to follow typical allometric scaling rules. Ultimately, such mechanistic model can be used to make more informed clinical decisions.
Source of Funding
This study was funded by Alexion Pharmaceuticals.
Conflict of Interest
J.T., P.S., N.B., M.H., M.L., K.M., L.S., S.S., and X.G. are/were Alexion Employees and own Alexion Stock. J.A., J.B., L.L., B.M., and A.W. are employees of Applied BioMath LLC.
Author Contributions
J.A., J.P.T., P.S., N.B., M.H., M.L., L.S.J., and X.G. wrote the manuscript. M.L. and S.S. designed the research. J.T., N.B., M.H., M.L., K.M., and L.S. performed the research. J.A., L.L., B.M., and A.W. analyzed the data.
Supporting information
Supplementary Material
Model code
Raw data and model files
Acknowledgment
We would like to acknowledge Douglas A. Lauffenburger, PhD, for initial discussions on the model and project strategy.
References
- 1. van der Veere, C.N. et al Current therapy for Crigler‐Najjar syndrome type 1: report of a world registry. Hepatology 24, 311–315 (1996). [DOI] [PubMed] [Google Scholar]
- 2. Stokowski, L.A. Fundamentals of phototherapy for neonatal jaundice. Adv. Neonatal Care 6, 303–312 (2006). [DOI] [PubMed] [Google Scholar]
- 3. Ambrosino, G. et al Isolated hepatocyte transplantation for Crigler‐Najjar syndrome type 1. Cell Transplant. 14, 151–157 (2005). [DOI] [PubMed] [Google Scholar]
- 4. Ribes‐Koninckx, C. et al Clinical outcome of hepatocyte transplantation in four pediatric patients with inherited metabolic diseases. Cell Transplant. 21, 2267–2282 (2012). [DOI] [PubMed] [Google Scholar]
- 5. Strauss, K.A. et al Management of hyperbilirubinemia and prevention of kernicterus in 20 patients with Crigler‐Najjar disease. Eur. J. Pediatr. 165, 306–319 (2006). [DOI] [PubMed] [Google Scholar]
- 6. Vogl, T.P. , Cheskin, H.S. , Blumenfeld, T.A. & Sugai, G.K. Bilirubin dynamics in the Gunn rat. Dose response of intermittent and continuous phototherapy. Biol. Neonate. 38, 106–112 (1980). [DOI] [PubMed] [Google Scholar]
- 7. Christensen, J. et al Biodistribution and metabolism studies of lipid nanoparticle‐formulated internally [3H]‐labeled siRNA in mice. Drug Metab. Dispos. 42, 431–440 (2014). [DOI] [PubMed] [Google Scholar]
- 8. Ligon, T.S. , Leonhardt, C. & Radler, J.O. Multi‐level kinetic model of mRNA delivery via transfection of lipoplexes. PLoS One 9, e107148 (2014). [DOI] [PMC free article] [PubMed] [Google Scholar]
- 9. Mui, B.L. et al Influence of polyethylene glycol lipid desorption rates on pharmacokinetics and pharmacodynamics of siRNA lipid nanoparticles. Mol. Ther. Nucleic Acids 2, e139 (2013). [DOI] [PMC free article] [PubMed] [Google Scholar]
- 10. Calvert, R.T. , Hulshoff, A. , Buice, R.G. & Kostenbauder, H.B. Bilirubin dynamics in the Gunn rat during phototherapy. J. Pharm. Sci. 67, 205–209 (1978). [DOI] [PubMed] [Google Scholar]
- 11. Schmid, R. & Hammaker, L. Metabolism and disposition of C14‐bilirubin in congenital nonhemolytic jaundice. J. Clin. Invest. 42, 1720–1734 (1963). [DOI] [PMC free article] [PubMed] [Google Scholar]
- 12. Schwanhausser, B. et al Global quantification of mammalian gene expression control. Nature 473, 337–342 (2011). [DOI] [PubMed] [Google Scholar]
- 13. Udomuksorn, W. et al Influence of mutations associated with Gilbert and Crigler‐Najjar type II syndromes on the glucuronidation kinetics of bilirubin and other UDP‐glucuronosyltransferase 1A substrates. Pharmacogenet. Genomics 17, 1017–1029 (2007). [DOI] [PubMed] [Google Scholar]
- 14. Zhou, J. , Tracy, T.S. & Remmel, R.P. Bilirubin glucuronidation revisited: proper assay conditions to estimate enzyme kinetics with recombinant UGT1A1. Drug Metab. Dispos. 38, 1907–1911 (2010). [DOI] [PMC free article] [PubMed] [Google Scholar]
- 15. Schlosshauer, M. & Baker, D. Realistic protein‐protein association rates from a simple diffusional model neglecting long‐range interactions, free energy barriers, and landscape ruggedness. Protein Sci. 13, 1660–1669 (2004). [DOI] [PMC free article] [PubMed] [Google Scholar]
- 16. Emi, Y. , Omura, S. , Ikushiro, S. & Iyanagi, T. Accelerated degradation of mislocalized UDP‐glucuronosyltransferase family 1 (UGT1) proteins in Gunn rat hepatocytes. Arch. Biochem. Biophys. 405, 163–169 (2002). [DOI] [PubMed] [Google Scholar]
- 17. Berk, P.D. , Howe, R.B. , Bloomer, J.R. & Berlin, N.I. Studies of bilirubin kinetics in normal adults. J. Clin. Invest. 48, 2176–2190 (1969). [DOI] [PMC free article] [PubMed] [Google Scholar]
- 18. Hosea, N.A. et al Prediction of human pharmacokinetics from preclinical information: comparative accuracy of quantitative prediction approaches. J. Clin. Pharmacol. 49, 513–533 (2009). [DOI] [PubMed] [Google Scholar]
- 19. Wang, J. , Iyer, S. , Fielder, P.J. , Davis, J.D. & Deng, R. Projecting human pharmacokinetics of monoclonal antibodies from nonclinical data: comparative evaluation of prediction approaches in early drug development. Biopharm. Drug Dispos. 37, 51–65 (2016). [DOI] [PubMed] [Google Scholar]
- 20. Singh, A.P. et al Quantitative prediction of human pharmacokinetics for mAbs exhibiting target‐mediated disposition. AAPS J. 17, 389–399 (2015). [DOI] [PMC free article] [PubMed] [Google Scholar]
Associated Data
This section collects any data citations, data availability statements, or supplementary materials included in this article.
Supplementary Materials
Supplementary Material
Model code
Raw data and model files