

Abstract
The emergence of systems neuroscience tools requires parallel generation of objective analytical workflows for experimental neuropathology. We developed an objective analytical workflow that we used to determine how specific autonomic neural lineages change during postnatal development. While a wealth of knowledge exists regarding postnatal alterations in respiratory neural function, how these neural circuits change and develop in the weeks following birth remains less clear. In this study, we developed our workflow by combining genetic mouse modeling and quantitative immunofluorescent confocal microscopy and used this to examine the postnatal development of neural circuits derived from the transcription factors NKX2.2 and OLIG3 into three medullary respiratory nuclei. Our automated FIJI-based image analysis workflow rapidly and objectively quantified synaptic puncta in user-defined anatomic regions. Using our objective workflow, we found that the density and estimated total number of Nkx2.2-derived afferents into the PreBötzinger Complex significantly decreased with postnatal age during the first three weeks of postnatal life. These data indicate that Nkx2.2-derived structures differentially influence PreBötzinger Complex respiratory oscillations at different stages of postnatal development.
Keywords: PreBötzinger Complex, Retrotrapezoid Nucleus, Post-Inspiratory Complex, Nkx2.2, Olig3
INTRODUCTION
Interpretation of visual microscopy data so that we may identify differences between groups lies at the heart of both clinical and research neuropathology. In this regard, conversion of visual data into numerical data amenable to statistical hypothesis testing represents an ongoing challenge. The quantity of data extracted from modern microscopy techniques is challenging for human observers to objectively and repetitively quantify. In this regard, the quantification of punctated morphologies in the central nervous system (CNS) is particularly laborious and prone to such inter-observer and intra-observer biases characteristic of human quantification of microscopy data. In this manuscript we describe a workflow utilizing the open-source software package FIJI which facilitates such quantification.
In the last 20 years, our mechanistic understanding of respiratory neural network development has increased dramatically. We now know that there are at least three oscillating brainstem networks that control breathing. The PreBötzinger Complex (PreBötC) establishes and generates the respiratory rhythm and is required for the inspiratory phase of breathing (Feldman & Del Negro, 2006). Strong evidence derived from electrophysiological recordings as well as calcium imaging modalities indicates that the mouse PreBötC becomes functionally detectable at E15.5 (Thoby-Brisson, Trinh, Champagnat, & Fortin, 2005). The PreBötC is part of the larger Ventral Respiratory Column (VRC), a cluster of nuclei integral to the coordination of autonomic signals and respiration (Smith, Abdala, Borgmann, Rybak, & Paton, 2013). The VRC contains interneurons responsible for the inspiratory and expiratory phases of respiration. A second respiratory oscillator, the parafacial respiratory group (pFRG), activates during the expiratory and pre-inspiratory phases of breathing driving rhythmogenesis in the developing organism (Feldman & Del Negro, 2006). pFRG neurons also play a key role in central chemosensation (Dubreuil et al., 2009). The pFRG exists ventrolateral to the facial nucleus in the mouse medulla and initiates rhythmogenesis at E14.5 (Thoby-Brisson et al., 2009). While the PreBötC develops normally in the presence of a genetically mutated pFRG, the frequency of outputs from the PreBötC and pFRG changes when these two respiratory centers are separated from each other. The Retrotrapezoid Nucleus (RTN), a loose collection of Paired-like homeobox2b (Phox2B)-expressing neurons located in the ventral lateral medulla between the seventh cranial nerve nucleus (nVII) and pial surface, represents a major contribution to the pFRG (Guyenet & Mulkey, 2010). Using a unique horizontal slice preparation, Anderson et al. demonstrated the existence of a third respiratory oscillator, the Post-Inspiratory Complex (PiCo) (Anderson et al., 2016), a collection of glutamatergic and cholinergic neurons located dorsomedial to the PreBötC and facilitate the post-inspiratory control of breathing. Exactly how developing neural circuits integrate independent respiratory oscillatory networks in the PiCo, PreBötC and/or RTN/pFRG remains elusive.
OLIG3 and NKX2.2 are transcription factors that play pivotal roles in rhombencephalic patterning. NKX2.2, a homeodomain transcription factor expressed by progenitors on the developing ventral neural tube, patterns the developing embryo in response to Sonic Hedgehog signaling (Briscoe, Pierani, Jessell, & Ericson, 2000). The earliest Nkx2.2 detection occurs between E8.5 and E9.5 in the developing mouse neural tube (Balderes, Magnuson, & Sussel, 2013; Shimamura, Hartigan, Martinez, Puelles, & Rubenstein, 1995). The Allen Brain Atlas illustrates strong Nkx2.2 expression throughout the developing hindbrain during embryonic development beginning at E11.5 (http://developingmouse.brain-map.org/gene/show/17855). Nkx2.2 expression governs neuronal specification, and its expression suppresses motor neuron generation whilst promoting V3 interneuron development. NKX2.2 also facilitates hindbrain serotonergic neuron generation (Alenina, Bashammakh, & Bader, 2006). OLIG3, a basic helix-loop-helix transcription factor expressed in the dorsal neural tube, promotes the development of interneurons and select precerebellar neurons, including climbing fiber neurons of the inferior olivary nucleus and mossy fiber neurons (Z. Liu et al., 2008; Zechner et al., 2007). OLIG3 is first expressed in the Central Nervous System (CNS) at embryonic day 9.25 and continues through early postnatal development (Storm et al., 2009). The Allen Brain Atlas also illustrates strong Olig3 expression in the embryonic hindbrain (http://developingmouse.brain-map.org/gene/show/60856). In regard to CNS respiratory control, dorsal respiratory column (DRC) development requires Olig3 expression. There, Olig3-derived DRC neurons modulate breathing by relaying input from the peripheral chemoreceptors to the respiratory oscillators (Storm et al., 2009).
While the existing literature contains ample information about the pre- and perinatal development of the respiratory oscillators, exactly how developing neural circuits integrate independent respiratory oscillatory nuclei remains elusive. Furthermore, much remains unknown concerning how innervations of specific neural lineage to and between these structures change in the postnatal epoch. A prior hindrance to answering these questions was a lack of standardized approaches to quantifying such events making the objective quantification of punctated morphologies such as synapses a significant challenge. In this study, we aimed to create an objective method with which changing innervations from specific neural circuits could be quantified over the developmental epoch.
Here, we present a methodology which enables the quantification of neural circuit innervations. We used specific brainstem respiratory nuclei, including RTN/pFRG, PreBötC and PiCo, as a system in which to verify the methodology. To achieve this, we used a transgenic mouse model previously validated by our laboratory to label synaptic structures with GFP and HA-tag early in development (Gokozan et al., 2016). We used a tiling confocal microscopy to generate large, high-resolution images that were imported into the open source platform, FIJI, for quantification of HA-tagged synaptic vesicles. With this technique, we found evidence showing that afferent inputs from Nkx2.2-derived neurons into the RTN/pFRG and PiCo remain stable in density and quantity during the first three weeks of postnatal life; however, the number and density of Nkx2.2-derived afferents into the PreBötC significantly decreases over this time period. This automated workflow is designed to objectively quantify punctated structures found in experimental neuropathology research.
MATERIALS AND METHODS
Experimental Animals and Animal Husbandry Procedures
Procedures utilizing mice were performed in accordance with The Ohio State University Institutional Animal Care and Use Committee guidelines (protocol number: 2012A00000162-R1). Nkx2.2-Cre mice (MGI:5290102, Tg(Nkx2–2*-cre)1Mtse) or Olig3-Cre mice (MGI:3841452, Olig3tm1(cre)Ynka) were bred with a transgenic reporter, here identified as tracer mice, (Jax No. 010590, B6;129-Iis1tm1(CAG-Bgeo,-tdTomato/TEVP,-SV2B/GFP)Nat/J; the contributing investigator is Jeremy Nathans, MD, PhD) to determine the developmental changes in innervation to medullary structures involved in respiration. This mouse expresses a synaptic vesicle protein 2b (SV2B), which begins expression throughout the CNS at E12.0, fused to a GFP/HA-tag reporter. This fusion protein is under the control of the ubb promoter (Figure 1) (Bartholome et al., 2017; Crèvecœur et al., 2013; Ryu, Park, Rossi, Weissman, & Kopito, 2012). Tobacco etched viral protein (TEVP) cleaves the SV2B-GFP protein from a second reporter protein at a TEVP cleavage site (Figure 1). TEVP is a well characterized enzyme with strong catalytic activity at physiologic pH and body temperature (Waugh, 2011). The Nkx2.2-Cre BAC and Olig3-Cre targeted insertion transgenic models have been well-characterized previously (Vue et al., 2009; 2013; Hui Wang, Lei, Oosterveen, Ericson, & Matise, 2011). The transgenic phenotype of the tracer mouse in the presence of Cre recombinase is illustrated in Figure 1. Details of the tracer mouse have been described previously by our group (Gokozan et al., 2016). GFP/HA-positive structures show punctated morphologies. GFP colocalization with the presynaptic marker, Synapsin-1, in Cre recombined tissue provided a basic validation of the tracer mouse model (Figure 1C). All interbreeding was done with heterozygous tracer mice. The following genotypes were verified by PCR (Terra PCR Direct Red Dye Premix #639286, Clontech Laboratories, Mountain View, CA, USA) : Nkx2.2-Cre (fwd 5’-CGT TCA CCG GCA TCA ACG TTT-3’ rev 5’-GCG GCA TGG TGC AAG TTG AAT-3’; band = 233 base pairs), Olig3-Cre (fwd 5’-TTC AGG CAC ACA CCA ATG TGC-3’ rev 5’-ATC ACT CGT TGC ATC GAC CGG-3’; band = 300 base pairs), and tracer (primer 1 5’-GCA ACG TCG ACG TTA AAC TGC CCG-3’ primer 2 5’-CGC TAT TTA TGC AGC GTC TGT TGC-3’ primer 3 5’-ATG ACT AAT ACG TAG ATG TAC TGC CA-3’; mutant band = 831 base pairs, wild type band = 397 base pairs).
Figure 1. Genetic Construct of Tracer Mouse Model.

A Schematic representing the genetic construct of the tracer mouse. This mouse model has a targeted insertion with a beta-galactosidase-nuclear localization (B-gal NLS) cassette followed by 3 stop codons at the 3′ end and flanked by two cis-loxp sites 2 kb upstream of the ubb gene. To induce Cre-mediated recombination, tracer mice were interbred with Nkx2.2-Cre and Olig3-Cre mice. After Cre-mediated excision occurs, a single large protein is made that contains (from N- to C- terminal) a tdTomato-tobacco etched viral protease (TEVP)-myc epitope tag, a TEVP cleavage site, synaptic vesicle protein-GFP-hemagglutinin fusion protein. Following translation, a TEVP-dependent cleavage occurs leading to generation of two different cleavage products. B Illustration of the Olig3-Cre; tracer or Nkx2.2-Cre; tracer models. When recombination occurs in neurons, the amino terminal protein containing tdTomato-TEVP labels all axons and dendrites (red), whereas the SVP2b-GFP fusion protein labels all presynaptic protein accumulations (green). C 63X oil image of GFP+ synapses (green) in Olig3-Cre; tracer+ tissue shows colocalization with Synapsin-1 (red), a marker of presynaptic terminals. Scale bar = 5µm.
Tissue processing
Neonatal (P0/1) and postnatal (P21) mice were anesthetized using a mixture of ketamine (100mg/kg) and xylazine (10mg/kg) in sterile saline. Pups were perfused transcardially using a pump, first with 10mL phosphate-buffered saline (PBS), then with 5mL 4% paraformaldehyde (PFA) in PBS. Brains were collected and drop-fixed in 4% PFA/PBS at 4ºC overnight, equilibrated in 30% sucrose/PBS and OCT embedded. OCT-embedded brains underwent cryosectioning (Microm HM 505 E, Microm Laboratories, Walldorf, Germany) and were transferred to a 96-well plate. Sections were stored in 0.01% sodium azide PBS at 4ºC until further use.
Immunostaining
Hindbrains were cryosectioned coronally at 50µm from the caudal medulla through the pontomedullary junction using the Allen Brain Atlas as a reference (Figure 2). As pup size during P0/1 to P21 is dependent on litter size (Chahoud & Paumgartten, 2009), genetics, and other environmental factors, we did not attempt to identify these structures relative to specific anatomical landmarks. Furthermore, as cryosection angle determines the overall 2D area and structure shape, we relied on evaluation of specific landmarks such as the 7th cranial nerve for the RTN, and the Nucleus Ambiguus for the PiCo and PreBötC. For quality control, cryosections were visualized on a fluorescent dissecting microscope to verify recombination. Tissue sections were antigen retrieved with 10mM citrate buffer (pH 6.0) at 80°C for 30 minutes by floating a tissue culture plate in a water bath then washed with PBS + 0.1% Triton X-100 (#02300221, MP Biomedicals, Solon, OH, USA) three times for ten minutes each wash. Sections were then blocked with 10% horse serum (#06750, Stem Cell Technologies, Vancouver, British Columbia, Canada) and 0.1% Triton X-100 in 1X PBS before incubation with primary antibody solution (5% horse serum, 0.1% Triton X-100 in 1X PBS) overnight at 4°C. Sections were washed with PBS + 0.1% Triton X-100 three times for ten minutes each wash before incubation with secondary antibody solution (5% horse serum, 0.1% Triton X-100, DAPI [#D1306, Invitrogen, Carlsbad, CA, USA, 1:1000, RRID:AB_2629482, excitation: 358nm, emission 461nm]) for two hours at 20°C in the dark. Secondary antibodies were used at 1:1000 and obtained from Invitrogen (Alexa Fluor 488-conjugated donkey anti-rabbit secondary antibody [Molecular Probes, A-21206, RRID:AB_141708, excitation: 495nm, emission 519nm] , Alexa Fluor 488-conjugated goat anti-chicken secondary antibody [Molecular Probes, A-11039, RRID:AB_142924, excitation: 495nm, emission 519nm], Alexa Fluor 594-conjugated goat anti-rabbit secondary antibody [Thermo Fisher Scientific, A-11037, RRID:AB_2534095, excitation: 590nm, emission 617nm], Alexa Fluor 647-conjugated anti-goat secondary antibody [Molecular Probes, A-21447, RRID:AB_141844, excitation: 650nm, emission 668nm]). Sections were washed with PBS two times then with dH2O once for ten minutes each wash and coverslips were mounted with ProLong Gold Antifade Mountant (#P36934, Invitrogen, Eugene, OR, USA). Table 1 delineates antibodies used in this study. We found better signal to noise and better penetration with the anti-HA antibody than the anti-GFP antibody. Therefore, we utilized the anti-HA antibody for all quantifications.
Figure 2. Schematic of medullary landmarks used to identify respiratory oscillators.

A Sagittal view of mouse medulla with key labeled structures (PreBötC = PreBötzinger Complex, RTN/pFRG = Retrotrapezoid Nucleus/Parafacial Respiratory Group, PiCo = Post-Inspiratory Complex, NA = Nucleus Ambiguus, nVII = seventh cranial nerve nucleus). Grey box represents sectioned area of medulla. B, C, D Schematics of coronal sections with key features used to identify respiratory oscillators. B Coronal section through medulla at level of nVII. Green structure represents RTN/pFRG as typically selected for analysis with pink structure representing nVII. B1 40x tiled image of medulla with yellow outline around RTN/pFRG with dashed white line around nVII. PHOX2B, a marker of a subpopulation of RTN/pFRG neurons in green (white arrows), ChAT in white, DAPI in blue. C Coronal section through medulla. Yellow structure represents PiCo as typically selected for analysis with the SQM with blue structure representing NA. C1 40x tiled image of medulla with yellow outline around PiCo with dashed white line delineating NA. VGLUT2, a marker of PiCo neurons in green (white arrows), ChAT in white, DAPI in blue. D Coronal section through caudal medulla. Teal structure represents PreBötC as typically selected for analysis with blue structure representing NA. D1 40x tiled image of caudal medulla with dashed white line delineating NA and yellow outline around PreBötC. NK1R, a marker of a subpopulation of PreBötC neurons in green (white arrows), ChAT in white, DAPI in blue. Scale bar = 100µm. E and F show average sizes of the structures quantified at different stages. (G) Estimated volumes of the structures studied in this report are plotted as box whisker plots (solid line within the clear box denotes population median, clear box denotes the interquartile rage, and the whiskers denote 1.5 times the interquartile range, p values obtained from paired t-test are embedded within the graph).
TABLE 1.
Primary Antibodies
| Antigen | Description of Immunogen | Source, host species, clonality, catalog No., lot No. | Concentration used | RRID | References |
|---|---|---|---|---|---|
| Anti-HA | Triple HA fusion to T7 gene 10 protein, made in E. coli. Triple HA fusion to T7 gene 10 protein, made in E. coli |
Kind gift of Dr. Jeremy Nathans, Johns Hopkins University; rabbit polyclonal. Antibody generated in Nathans Laboratory |
1:50,000 | Not available | (Gokozan et al., 2016) |
| Anti-ChAT | Human placental enzyme | Millipore, goat polyclonal, AB144P, lot number: 2843074 |
1:300 | AB_2079751 | (Paxinos & Franklin, 2012) |
| Anti-GFP | Recombinant full length GFP | Abcam, chicken polyclonal, AB13970, lot number: GR-236651-13 |
1:2000 | AB_300798 | (Enjin et al., 2010; Jarvie & Hentges, 2012) |
| Anti-NK1R | Synthetic peptide corresponding to a 23-amino acid sequence (385-407) of the C-terminal region of Rat Substance P Receptor (NK-1) |
Millipore, rabbit polyclonal, AB5060, lot number: 2739470 |
1:500 | AB_2200636 | (Mulkey et al., 2007; Piggins, Samuels, Coogan, & Cutler, 2001) |
| Anti-PHOX2B | Synthetic peptide corresponding to the C- terminal region of Human PHOX2B (250-C- terminus) |
Abcam, rabbit polyclonal, AB183741, lot number: GR280576–4 |
1:500 | Not available | (Ke et al., 2015) |
| Anti-Synapsin-1 | Synthetic peptide corresponding to residues around Gln483 of human synapsin-1 protein |
Cell Signaling Technology, rabbit monoclonal, #5297S, lot number: 3 |
1:500 | AB_2616578 | (Pellett et al., 2015; Simhal et al., 2017) |
| Anti-VGLUT2 | Synthetic peptide corresponding to the C- terminal region of Mouse VGLUT2 conjugated to KLH (NP_543129.3) |
Abcam, rabbit polyclonal, AB84103, lot number: GR119225–1 |
1:100 | AB_10674784 | Allen Brain Atlas |
| Anti-Myc | Monoclonal antibody is produced by immunizing animals with a synthetic peptide corresponding to residues 410–419 of human c-Myc (EQKLISEEDL). |
Cell Signaling, 2276 | 1:500 | Not Available | (Filézac de L’Etang et al., 2015) |
Abbreviations: HA = human influenza haemagglutinin, ChAT = Choline Acetyltransferase, GFP = Green Fluorescent Protein, NK1R = Neurokinin 1 receptor, VGLUT2 = Vesicular Glutamate Transporter 2, PHOX2B = Paired-like homeobox 2b
Microscopy and Image Analysis
Fluorescent images were captured on a Carl Zeiss Axio Imager Z.1 with LSM700 confocal microscope with a motorized stage using 10x/0.3 NA, 40x/1.3 NA Oil DIC, and 63x/1.4 NA Oil DIC objectives. Z-stacks with a 4µm step size spanning the entire thickness of the section were taken at 40x magnification with a pinhole of 1 Airy unit, scan speed of 8, resolution of 1024×1024, and pixel resolution of 6.3983pixels/µm. Images were tiled with 10% overlap and stitched by Zen software (2011, Black, v. 7,0,0,285) into a 3D image.
Z-stacks were analyzed from .czi files in FIJI (v1.0, RRID:SCR_002285) to count the number of HA+ synapses in PreBötC, PiCo and RTN/pFRG (Figure 2). Sections were matched to the best of our ability with a stereotaxic developing mouse brain atlas to determine distance from the bregma (Paxinos, Watson, Koutcherov, Wang, & Halliday, 2006). Choline acetyltransferase (ChAT) staining was used to identify structural landmarks adjacent to the respiratory oscillators, including the Nucleus Ambiguus for PreBötC and PiCo and the nVII for RTN/pFRG. At the beginning of the Synapse Quantification workflow, the automated process pauses for input of user-defined Regions of Interest (ROIs), which were drawn around PreBötC and RTN/pFRG based on stereotaxic coordinates and around PiCo based on anatomic location recently described by Anderson et al. (2016). All ROIs were compared to the developing mouse atlas and the morphology of adjacent ChAT+ structures. In a neonatal mouse the PreBötC is ~250–300µm long (PreBötC + VRG is 840 µm long according to newborn atlas) along the rostrocaudal axis (P. A. Gray et al., 2010; Ruangkittisakul et al., 2006), the PiCo is ~250µm long (Anderson et al., 2016), and the RTN/pFRG is ~600µm long (Paxinos et al., 2006). After the ROI is confirmed, the workflow becomes automated once more and completes all analyses and quantifications without further input.
The FIJI-based, Synapse Quantification Macro (SQM) is publicly available at the online repository, figshare in a file set entitled “Synapse Quantification FIJI Macro” (the raw SQM script is provided in Supplement 1). Included in the file set is a concise guide detailing how to run the SQM and highlighting aspects of the code that can be modified for different needs. In FIJI, maximum intensity projections were created for two-step Z-stacks in tissue from neonatal pups and three-step Z-stacks in tissue from postnatal pups. Non-specific staining and uneven background was removed from the green channel using the “Despeckle” function and the rolling ball method of background subtraction (radius: 10.0 pixels). Automatic thresholding was applied using the Image “MaxEntropy” method (Kapur, Sahoo, & Wong, 1985). Finally, the “Watershed” particle segmentation algorithm was run to separate very close objects before running the “Analyze Particles” function (10–200 pixels2, circularity 0.00–1.00) to count the number of thresholded particles within the ROIs. During SQM development, algorithm outputs were compared with experienced human observers in order to select objects that appeared synaptic and excluding noise and non-synaptic structures (Fauzi et al., 2015).
Human versus Automated Quantification of Synaptic Labelling
Due to the unavailability of a ground truth, we compared the performance of two independent and experienced observers with the performance of the SQM. This approach has been commonly utilized in studies aiming to compare novel image analysis methodologies (Akakin, Gokozan, Otero, & Gurcan, 2015; Fauzi et al., 2015; Kaya et al., 2017; Nijhof et al., 2016). Two independent observers counted sixteen fields taken from the tiled images of the PiCo from neonatal and postnatal Nkx2.2-Cre; tracer-positive animals. These fields were smaller than the stitched images that were used for innervation analyses.
These sixteen images were modified in FIJI to create three additional sets of images with different, artificial distortions: blur (Smooth function), noise (Salt and Pepper function), and color-inversion (Invert LUT function). All images in each set were counted once per day for three days in a randomized order, with a washout period of at least twelve hours between each quantification session. We also quantified these four sets of images concurrently using the SQM in order to compare the reliability and feasibility of automated quantification with manual counting of particles by experienced users. Observers were blinded to the source of the PiCo image, to their previous performance and to the results of human or computer participants. All quantifications were performed using the cell counter feature in FIJI on a laptop computer.
To test the accuracy of the SQM relative to human observers with a known ground truth, we generated scatter plots of varying size black dots on a gray background. This was done with the intention of making it easy for the human observer to review. To achieve this, we utilized the ggplot2 package of R and generated these with the following code:
a_x = runif(x, min = 1, max = 1000)
b_y = runif(y, min = 1, max = 1000)
dfx = data.frame(a_x, b_y)
png(file = “mygraph_x.png”, width = 4000, height = 3500)
ggplot(dfx, aes(a_x, b_y, size = runif(x, min = 1, max = 2))) + geom_point() + theme(panel.grid.major = element_blank(), panel.grid.minor = element_blank())
dev.off()
Ten files were generated where the “x” and “y” values for each plot were the following: 100, 145, 230, 275, 300, 498, 565, 656, 892, and 1000. These were randomized and delivered to two human observers for analysis in three sets and converted to .tiff files for compatibility with the SQM. Sets were counted after a 24-hour washout period. Accuracy and variance of the two human observers and the SQM were evaluated. These quantifications were performed using the cell counter feature of FIJI without user magnification. Users were not directed to increase the magnification during sampling.
Statistical Analysis
Lin’s concordance correlation coefficient was calculated to describe the reproducibility between methods of counting (Lin, 1989; P. F. Watson & Petrie, 2010). Agreement between the mean observer counts for observer 1, observer 2 and the SQM results were displayed graphically (Figure 7). A one-way analysis of variance (ANOVA) was used to compare the particle density and estimated number of Nkx2.2 and Olig3-derived afferents into the regions of interest (PreBötC, PiCo and RTN) at both the neonatal and postnatal time points. The number of images per animal varied depending on the number of slices containing the structures of interest. All pairwise comparisons were performed and significance was determined based on a Tukey’s adjusted alpha level. Standard error of the mean (SEM) was calculated after averaging the values obtained from all animals within a group. All analyses were done using Rv3.4.1 (R Foundation for Statistical Computing, 2016) and Stata 14 (StataCorp, LLC, College Station, TX).
Figure 7. Automated versus manual Quantification of HA+ particles in tiled confocal images.

Sixteen 400 × 400 pixel fields were taken from maximum intensity projection confocal images of Nkx2.2-Cre; tracer Post-Inspiratory Complex at P1 and P21. A Counts of original images by observer 1, observer 2 and the SQM over 3 days. B-E Representative images with quantified particles as overlays. B example of an unquantified field. C HA+ particles quantified by the SQM (yellow circles). D HA+ particles quantified by observer 1 (cyan circles). E HA+ particles quantified by observer 2 (magenta circles). F-H illustrate agreement analyses between observer 1, observer 2 and the SQM. Lin’s concordance correlation coefficient (ccc) is given along with the 95% confidence interval (CI) for each analysis.
RESULTS
High-resolution confocal image acquisition of the three respiratory oscillators in murine hindbrain represents unique challenges to image analysis.
Our experimental objectives were to develop a workflow capable of determining the extent to which innervation into three respiratory nuclei changed during postnatal development. We validated our experimental transgenic approach by confirming colocalization of the presynaptic terminal marker, Synapsin-1, with the GFP signal in mice expressing Cre recombinase. GFP+/Synapsin-1+ synapses are clearly visible in the dorsal hindbrain of Olig3-Cre; tracer+ mice. GFP-HA single-positive puncta represent the translation of SV2B-GFP-HA fusion protein in Olig3+ cells. To determine how the innervation patterns of Nkx2.2- and Olig3-derived neurons develop in the first three weeks after birth, we systematically sectioned the full thickness of the medulla, from the rostral cervical spinal cord to the pontomedullary junction at neonatal and postnatal time points (P0/1 and P21, respectively) in two different transgenic mouse genotypes (Nkx2.2-Cre; tracer and Olig3-Cre; tracer) (Figure 2). 50µm sections were collected and every third section was stained with antibodies against ChAT and HA-tag. ChAT stained structural landmarks including Nucleus Ambiguus (NA) and seventh cranial nerve nucleus (nVII), while the HA-tag labeled the synapses of tracer mice neurons derived from Cre-expressing cells. PiCo neurons are known to be cholinergic and thus express ChAT (Anderson et al., 2016). HA+ synapses were found in close proximity to ChAT+ neurons in the PiCo, which provided further validation to the experimental paradigm used to quantify Nkx2.2- and Olig3-derived innervations into medullary hindbrain structures (Figure 3).
Figure 3. HA+ particles are found innervating ChAT+ PiCo neurons.

Coronal sections of mouse medulla at the level of the Post-Inspiratory Complex (PiCo) reveals HA+ particles closely adjacent to ChAT+ neurons (white arrowheads) in tissue collected from (A) Olig3-Cre; tracer and (B) Nkx2.2-Cre; tracer mice. HA-tag in green, ChAT in red. Images tiled at 40x. (C) Examples of a spectrum of CHAT immunoreactive cells also stained with HA and Myc of CHAT positive cells in the PICO.
This systematic staining of hindbrain resulted in the imaging of 1,405 confocal Z-stacks stitched together into 73 tiled images for analysis in Nkx2.2-Cre; tracer animals. When these images were stitched together into larger composite images, we determined that we had captured PreBötC, PiCo and RTN/pFRG at both the neonatal and postnatal time points (Table 2). Similarly, 799 Z-stacks were collected and stitched into 45 tiled images in Olig3-Cre; tracer animals, and PreBötC, PiCo, and RTN had been capture at both time points. Some authors have championed the implementation of traditional stereological techniques to confocal photomicroscopy which require manual quantification of confocal Z-stack files (Kubínová & Janáček, 2015). However, we found that these goals presented a daunting challenge in manual image analysis and quantification. We therefore set forth to generate an automated FIJI-based Synapse Quantification Macro to interpret these data and compared the SQM counts with manual counts.
TABLE 2.
Number of Z-stacks, Tiled Structures Captured, and Animals Included for each Genotype and Time Point
| Nkx2.2-Cre; tracer | Olig3-Cre; tracer | |||||||||||
|---|---|---|---|---|---|---|---|---|---|---|---|---|
| P1 | P21 | P1 | P21 | |||||||||
| Z-Stacks | Tiled Images | Number of Animals |
Z-Stacks | Tiled Images | Number of Animals |
Z-Stacks | Tiled Images | Number of Animals | Z-Stacks | Tiled Images | Number of Animals | |
| PreBötC | 266 | 12 | 3 | 505 | 20 | 3 | 141 | 8 | 2 | 213 | 8 | 2 |
| PiCo | 33 | 5 | 3 | 49 | 4 | 2 | 26 | 4 | 2 | 35 | 4 | 2 |
|
RTN/ pFRG |
115 | 8 | 3 | 235 | 14 | 3 | 111 | 8 | 2 | 208 | 10 | 2 |
| Other | 179 | 9 | - | 23 | 1 | - | 19 | 1 | - | 46 | 2 | - |
| Total | 593 | 34 | - | 812 | 39 | - | 297 | 21 | - | 502 | 24 | - |
Confocal Z-stacks acquired with a 40x/1.3NA objective at 1024×1024 resolution and stitched with 10% overlap by Zeiss tiling software into structures for analysis (PreBötC = PreBötzinger Complex, PiCo = Post-Inspiratory Complex, RTN = Retrotrapezoid nucleus, pFRG = Parafacial Respiratory Group).
An automated FIJI-based macro for systematically counting HA+ particles.
Presynaptic terminals vary widely in their size and morphology based on their location, function, activity level and a variety of other factors (Ackermann, Waites, & Garner, 2015; Jin & Garner, 2008). The average synaptic bouton has been reported anywhere from 0.5–6µm in diameter, making their detection and quantification difficult without an objective measure of analysis (Graham & Redman, 1994; Whittaker & Gray, 1962). To this end, we developed the SQM, which rapidly and objectively counts the number of HA+ particles in a user-defined ROIs, which were drawn based on the morphology of the tissue section and neighboring structural landmarks (Nucleus Ambiguus for PreBötC and PiCo, nVII for RTN/pFRG) (Paxinos et al., 2006). Illustrations of this workflow for quantifying HA+ particles in PreBötC, PiCo, and RTN/pFRG are illustrated in Figures 4, 5, and 6, respectively. In all instances, HA+ particles could be easily appreciated after image processing. We thus concluded that our tiled and stitched confocal Z-stacks captured at 40x showed sufficient resolution to capture the HA-labelled vesicles in sufficient detail for downstream analysis.
Figure 4. PreBötzinger Complex Analysis workflow using the Automated FIJI-based Synapse Quantification Macro.
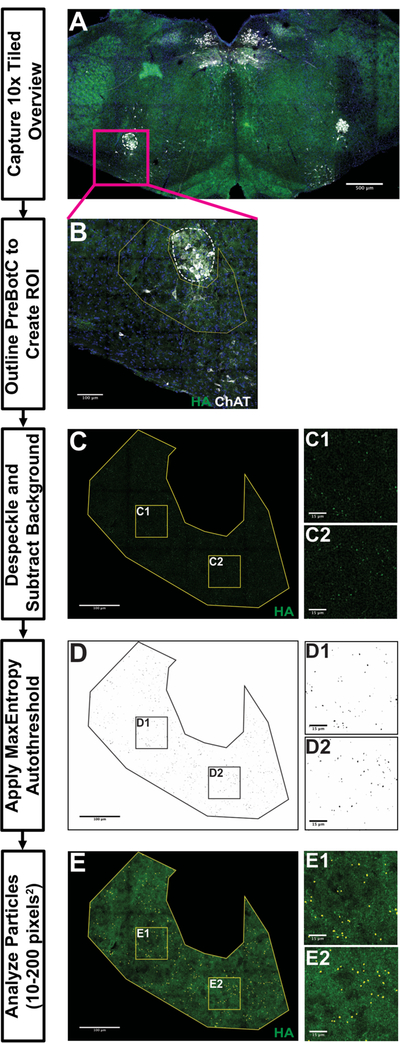
10x tiled overview image in A illustrates the landmarks used to identify sections containing PreBötzinger Complex (PreBötC). 40x tiled images in B-E provide an example workflow for processing PreBötzinger images for analysis. B demonstrates a region of interest (ROI) with a yellow line manually drawn around PreBötC using maximum projection, composite image (dashed white line around Nucleus Ambiguus [NA], blue is DAPI, green is HA-tag and white is Choline Acetyltransferase). Boxed areas in C-E are locations of representative fields from C, D and E to allow better visualization of HA+ particles analysis. C illustrates ROI after despeckling and background subtraction. D provides an example of ROI following MaxEntropy thresholding and watershedding. E demonstrates the particles counted by a particle analysis (small, circles). Scale bar lengths denoted in each image (A = 500µm, B, C, D, E = 100µm, insets = 15µm).
Figure 5. Post-Inspiratory Complex Analysis workflow using the Automated FIJI-based Synapse Quantification Macro.
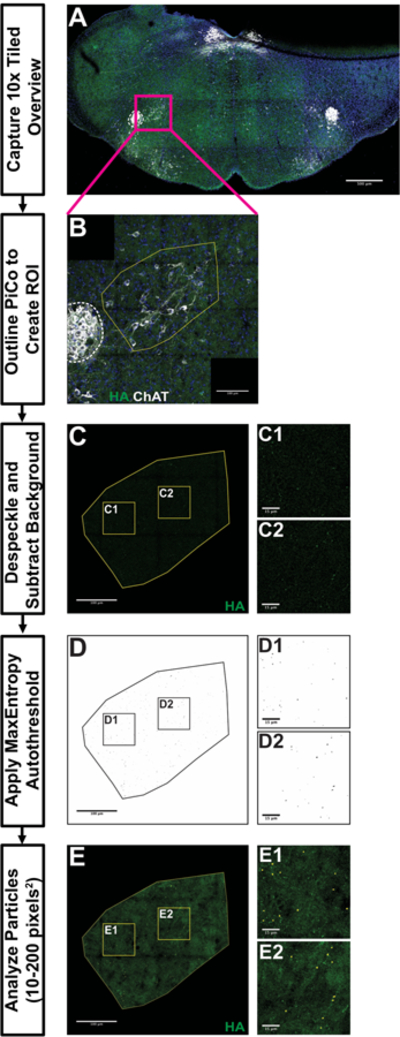
10x tiled overview image in A illustrates the landmarks used to identify sections containing Post-Inspiratory Complex (PiCo). 40x tiled images in B-E provide an example workflow for processing PiCo images for analysis. B demonstrates a region of interest (ROI) with a yellow outline manually drawn around PiCo using maximum projection, composite image (dashed white line around Nucleus Ambiguus [NA], blue is DAPI, green is HA-tag and white is Choline Acetyltransferase). Boxed areas in C-E are locations of representative fields from C, D and E to allow better visualization of HA+ particles analysis. C illustrates ROI after despeckling and background subtraction. D provides an example of ROI following MaxEntropy thresholding and watershedding. E demonstrates the particles counted by a particle analysis (small, circles). Scale bar lengths denoted in each image (A = 500µm, B, C, D, E = 100µm, insets = 15µm).
Figure 6. Retrotrapezoid Nucleus Analysis workflow using the Automated FIJI-based Synapse Quantification Macro.
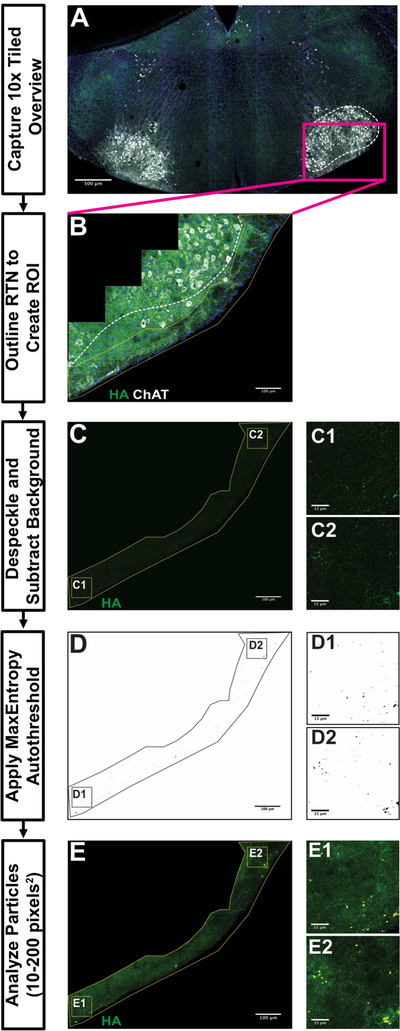
10x tiled overview image in A illustrates the landmarks used to identify sections containing Retrotrapezoid Nucleus (RTN). 40x tiled images in B-E provide an example workflow for processing RTN/pFRG images for analysis. B demonstrates a region of interest (ROI) with a yellow outline manually drawn around RTN/pFRG using maximum projection, composite image (dashed white line around 7th cranial nerve nucleus [nVII], blue is DAPI, green is HA-tag and white is Choline Acetyltransferase). Boxed areas in C-E are locations of representative fields from C, D and E to allow better visualization of HA+ particles analysis. C illustrates ROI after despeckling and background subtraction. D provides an example of ROI following MaxEntropy thresholding and watershedding. E demonstrates the particles counted by a particle analysis (small, circles). Scale bar lengths denoted in each image (A = 500µm, B, C, D, E = 100µm, insets = 15µm).
The SQM can be utilized to process images, starting with raw confocal data and ending with particle analysis in an ROI. The SQM first creates maximum intensity projections of the Z-stack as well as a composite of the channels, as no significant differences in particle density or number were found with or without maximum intensity projections (data not shown). These images are used to manually draw an ROI around the structure present in the section. ROI designation occurs by user input, as much variation exists between mice in both size and shape of hindbrain structures. After specifying the appropriate, unilateral ROI, the SQM automatically splits the channels and crops the image to the user-defined ROI in the channel of interest for quantification. This cropped region undergoes despeckling and background subtraction to reduce the immunofluorescent staining noise. The MaxEntropy autothreshold is applied and the watershed process separates particles closely adjacent to each other. Finally, a particle analysis detects particles 10–200 pixels-squared in size. The SQM automatically saves the particles as an ROI set. The processing of a 5,000×5,000-pixel image occurs in about one minute. We conclude that this image processing represents an efficient way of quantifying large datasets derived from tiled confocal photomicroscopy.
Inter- and intraobserver variability impedes objective interpretation of confocal imaging data.
To determine the extent of agreement between manual counting and the SQM, two observers quantified four sets of sixteen fields taken from neonatal and postnatal PiCo tiled structures (Figure 7). Briefly, set 1 contained the original, unaltered images while sets 2, 3, and 4 contained images that were modified to be blurrier, noisier, and color-inverted, respectively. Lin’s concordance correlation coefficient (ccc) was calculated to describe the deviation of the SQM and the observers from perfect concordance. The ccc ranges from 0 to ±1 with values approaching +1 indicating concordance and values approaching −1 indicating discordance. General interpretations of concordance values <0.89, 0.9–0.94, 0.95–0.99 are poor, moderate and substantial, respectively (McBride, 2005). The counts for each observer were averaged over three days and plotted with the SQM counts with the agreement line are depicted in Figure 7F–H. The ccc between the SQM and observer 1 was 0.454, between the automated to observer 2 was 0.613 and between observer 1 and observer 2 was 0.638 for quantification of the unaltered, original images (Table 3). There was better agreement between the automated and manual methods of counting with fewer particles per field; the differences between the manual counts and the automated counts are much larger with higher numbers of objects in each field. The ccc between the SQM and the observers did not greatly change with adjustments to the images (Table 3), and the agreement between observer 1 and observer 2 was much better with color inversion of the images. The concordance between the automated counts while counting the four sets of images was very high regardless of how the image was adjusted (Table 4). However, the individual counts of human observers changed greatly with different alterations to the image, demonstrating that high intraobserver variability with human quantification is not improved by image modification (Supplemental 2). In summary, quantifications by the SQM did not differ greatly after adjustments to blurriness, noisiness, or image color, and that manual quantification of punctated morphology is unreliable. We therefore conclude that the SQM represents a superior strategy to manual counting by human observers.
TABLE 3.
Summary of Lin’s concordance Correlation Coefficient
| Original | Blurry | Noisy | Inverted | |||||
|---|---|---|---|---|---|---|---|---|
| Comparison | CCC | 95% CI | CCC | 95% CI | CCC | 95% CI | CCC | 95% CI |
| Auto/Obs1 Mean | 0.454 | 0.280, 0.629 | 0.551 | 0.363–0.739 | 0.497 | 0.310–0.683 | 0.683 | 0.507–0.859 |
| Auto/Obs2 Mean | 0.613 | 0.448, 0.779 | 0.750 | 0.621–0.880 | 0.582 | 0.408–0.756 | 0.561 | 0.363–0.758 |
| Obs1 Mean /Obs2 Mean | 0.638 | 0.440, 0.837 | 0.771 | 0.617–0.926 | 0.861 | 0.763–0.959 | 0.942 | 0.902–0.981 |
Lin’s concordance correlation coefficient (CCC) was calculated between the Automated FIJI-based Synapse Quantification Macro and the mean particle count of observer 1 (Obs1), the SQM and the mean particle count of observer 2 (Obs2), and the mean counts of Obs1 and Obs2. The 95% confidence interval for each comparison is also included. Analyses were performed on four sets of images with different adjustments: unaltered images, increased blurriness, increased noise, and color inversion.
TABLE 4.
Comparisons of Automated Counts After Image Adjustment
| Automated Blurry | Automated Grainy | Automated Inverted | ||||
|---|---|---|---|---|---|---|
| Comparison | CCC | 95% CI | CCC | 95% CI | CCC | 95% CI |
| Automated | 0.940 | 0.879–1.00 | 0.964 | 0.927–1.00 | 0.967 | 0.934–1.00 |
| Automated_Blurry | 0.973 | 0.946–1.00 | 0.970 | 0.940–1.00 | ||
| Automated_Grainy | 0.982 | 0.963–1.00 | ||||
Summary of Lin’s CCC for the automated counts by the Automated FIJI-based Synapse Quantification Macro. Table provides comparisons of the automated counts by the SQM between the different image sets. A 95% confidence interval is also provided. There is a high level of concordance for each of these measures (CCC > 0.94 for all).
It is worth noting that for images with less than 50 particles, the SQM spent a mean five seconds analyzing each image, while for images with more than 50 particles the SQM spent a mean 23 seconds analyzing each image. By comparison, the mean time spent by observer 2 was 1 minute and 20 seconds analyzing each image regardless of particle density. From these data, we estimated that manual counting of all tiled structures in our dataset would take a little over 42.5 hours, whereas the automatic counting of the structures would take just over 1.7 hours using a basic laptop computer (MacBook Pro, 2.6GHz i7 Intel Core, 8GB RAM). Thus, the SQM does not only eliminate the variation in counts, but also reduces the time spent analyzing the particles. We conclude that this approach represents an efficient mechanism by which to quantify HA+ synaptic vesicles in the respiratory oscillators.
In the absence of a ground truth, estimations of quantification accuracy of human and computer-based computations are not possible. We therefore decided to test the capacity of the algorithm and two human observers to quantify black computer-generated dots of varying size off of a grey background. A black dot on a gray background represents easy contrast to the human observer relative to the confocal imaging data quantified above. To achieve this, we generated 10 random scatter plots of dots of random sizes using the ggplot2 package in R and compared our human observers to the algorithm. This allowed the generation of random images with a known ground truth. We then scrambled the images into three sets for experimental blindness, and had the human observers count the files manually in ImageJ with a 24-hour wash-out period between counts. Accuracy and intraobserver variance are plotted in Figure 8. We note that at low numbers and low density, human observers show low variance and higher accuracy than the SQM. However, as the number and density of the dots increased, intraobserver variance in counting values rapidly became a significant concern. Also, human accuracy significantly drifts downwards. At counts over 300, the SQM was as accurate as the human observers (Figure 8B). We conclude that in high particle density, the SQM is just as accurate or more relative to human observers and shows no variance between counts.
Figure 8: Accuracy and Intraobserver Variance of Human Observers and SQM in random scatterplots.

Ten scatterplots were generated utilizing the R code shown in the Methods subsection. (A) Accuracy is calculated by the following equation: [(|actual number-observer counted number|)/actual number]%. Accuracy is in Y-axis, count number is in X-axis. (B) Variance of each observer calculated in Xcel (var.s function) on Y-axis and Count number on X-axis.
Nkx2.2- and Olig3-derived cells show innervation of respiratory pattern generators.
To determine the extent to which Nkx2.2- and Olig3-derived afferents innervate the PreBötC, PiCo, and RTN/pFRG, the number of HA+ particles was quantified in each of these structures. These data are graphed in Figure 9. To identify the background noise obtained from our immunofluorescence methodology, we performed identical workflows using anti-HA antibody in tracer mice lacking Cre recombinase, which would not result in expression of the GFP-HA positive synaptic particles (genetic negative). We note that the experimental groups showed at least a 5-fold increase in density over the genetic negative experiments (neonatal genetic negative control experiments showed 3.99 × 10⁻⁵ ± 1.83 ×10⁻⁵ particles/µm3 in PreBötC, 2.39 ×10⁻⁵ ± 6.04 ×10⁻⁶ particles/µm3 in PiCo and 1.80 × 10⁻⁵ ± 4.26 ×10⁻⁶ particles/µm3 in RTN/pFRG) (Burry, 2011). These data demonstrate robust inputs from NKX2.2-derived synapses into the respiratory oscillators. We conclude that the PreBötC, PiCo and RTN/pFRG receive Nkx2.2- and Olig3-derived innervations at the neonatal stage.
Figure 9. Automated Quantification of Nkx2.2- and Olig3-derived projection density and estimated total counts in hindbrain respiratory centers.

Mean ± SEM of HA+ particle density and estimated total counts in three hindbrain respiratory structures ((PreBötC = PreBötzinger Complex, RTN/pFRG = Retrotrapezoid Nucleus/Parafacial Respiratory Group, PiCo = Post-Inspiratory Complex) at P1 and P21. A-B the density of Nkx2.2-derived innervations was significantly greater at P1 in the PreBötC compared with P21 PreBötC (p=0.047) and P21 RTN (p=0.042) by Tukey HSD comparison, but no significant differences were found in Olig3-derived innervation density in any of the three structures at P1 or P21. C-D the estimated total count of Nkx2.2-derived synapses was significantly greater at P1 in the PreBötC compared with P1 PiCo (p=0.009), P21 PreBötC (p=0.035), P21 PiCo (p=0.018), and P21 RTN (p = 0.014) by Tukey HSD comparison, but no significant differences were found in estimated Olig3-derived synapses in any of the three structures at P1 or P21. E-F The distribution of HA-positive puncta in each animal studied is plotted for the NKX2.2 and OLIG3-cre, respectively. The point of 0 on the x-axis of both graphs is at the commencement of the RTN. Y axis plots density.
Nkx2.2-derived innervation in the PreBötC during postnatal development.
Having validated our experimental and analytical methodologies, we next compared the mean densities and mean estimated total counts of HA+ particles in the PreBötC, PiCo and RTN/pFRG at P0/1 and P21 to identify the extent to which innervation by Nkx2.2- and Olig3-derived afferents into the three respiratory oscillators changed during postnatal development. In postnatal Nkx2.2-Cre; tracer animals, the density of HA+ particles in the PreBötC, PiCo and RTN/pFRG had decreased in each structure compared to the density of PreBötC innervations at the neonatal age (Figure 9). The innervation of Nkx2.2-derived afferents into the PreBötC at P1 was significantly higher than at P21 (p = 0.047 obtained from ANOVA/ TukeyHSD test). Similarly, we estimated the total count of HA+ synapses within each of the three respiratory oscillators (number of counts / µm multiplied by µm thickness of Z-plane) and there was a significant decrease in the total estimated number of synapses in the postnatal PreBötC (2.30 ×10⁴ ± 1.37 ×10⁴) compared to the total estimated count in the neonatal PreBötC (7.74 ×10⁴ ± 1.29 ×10⁴, p = 0.035) (Figure 9). In contrast, there was no significant change in either the estimated total count or the density of Olig3-derived particles in any of the three respiratory oscillators at the postnatal stage when compared to neonatal stage. P21 genetic negative control experiments showed no significant changes in estimated total counts or density of HA-labeled particles when compared to neonatal genetic negatives. We calculated post-hoc a general difference that can be detected and found that large differences between the Nkx2.2 groups (6-fold) can be ascertained with over 90% power, a coefficient of variance of 0.2 and an alpha of 0.003 (to adjust for multiple testing). This post-hoc power analysis strongly supports the conclusion that Nkx2.2-derived afferents undergo dynamic developmental changes in the first three weeks of postnatal life since the magnitude of difference is larger than the 6-fold threshold value calculated in our power analysis. We also conclude that the extent of the differences identified in the Olig3 group would require an exceedingly large number of animals to demonstrate differences between the P0/1 and P21 groups.
DISCUSSION
Automated Image Analysis for Experimental Neuropathology Research
The ability to quantify lineage-specific afferents into specific brainstem respiratory neurons is a crucial first step in determining how neural circuits involved in such functions as respiration change during developmental epochs. Extracting numerical data from neuroanatomical images for downstream use in statistical hypothesis testing represents a common challenge for many neuroanatomists and neuropathologists. However, the methods by which these data are counted have historically been labor-intensive, prone to observer bias and inter/intra-observer variability, and difficult to implement without significant visual literacy. Manual quantification of neural structures is fraught with caveats. First, the observer must decide what constitutes a structure depending on the object being quantified. If the object is large and more readily distinguishable (cells, nuclei) this challenge may be more easily overcome; however, if the object is small or complex (synapses, dendrites) this task can become nearly unachievable in large scale studies due to observer fatigue, as was demonstrated in our head-to-head comparison of the SQM versus the human observer. Second, the criteria that each observer creates to identify what does and does not constitute a structure can vary widely, leading to variable quantifications amongst research groups that hampers scientific reproducibility and rigor. This results in lack of a ground truth upon which to validate automated image analysis workflows. In these instances, it is imperative to compare the concordance of automated workflows to human observers so that one achieves an automated workflow that is as concordant to human observers as humans are to each other (Fauzi et al., 2015; Goceri et al., 2017; Kaya et al., 2017). Third, the manual quantification of a significant number of structures is laborious and time-consuming. Automated quantification provides objective criteria by which to judge structures, are not prone to fatigue or attention drift, and can process many more objects within a given time period when compared with manual quantification. We also endorse that these methodologies should be developed on open-source platforms so that other investigators may implement them at low cost. Furthermore, utilizing open-source software increases research transparency.
Recent advances in automated methods of synapse analysis utilize a variety of quantification methodologies. For instance, neuroproteomics examines the proteins contained within synapses and synaptic vesicles in order to quantify or characterize synapses and their components (Patrizio & Specht, 2016). However, while these methods may yield detailed information about the morphology and function of synapses, they do not inherently provide information about neural lineages or circuits. Other studies have employed unbiased stereology on immunofluorescent confocal images (Mokin & Keifer, 2006). Our laboratory previously utilized unbiased stereology to quantify HA+ innervations to the area postrema (Gokozan et al., 2016). We have previously applied this unbiased stereology expertise to the quantification of structures stained with immunofluorescent labeling but found the methodology difficult to employ and less intuitive than the workflow presented in the current study. Furthermore, in other studies we have found significant interobserver disagreement in the quantification of fluorescent imaging data (Kaya et al., 2017).
Technical Considerations
A number of technical points should be considered concerning the automated quantification of fluorescently-labeled synaptic structures for experimental neuropathology research. First, as mouse brain myelination surges postnatally in the first week of life, tissues collected from mice at the neonatal and postnatal time points react differently to histological protocols (Freude et al., 2008). For instance, hindbrains from both time points studied were cryosectioned at 50µm, antigen-retrieved, and immunolabelled prior to imaging. However, postnatal tissue exhibited shrinkage of ~39µm in thickness during processing while neonatal tissue shrunk ~45µm. For this reason, images captured from P0/1 animals contained two planes with a total z-axis of 4µm while images from P21 animals contained three planes with a total z-axis of 8µm. Differences in HA+ particles counted between neonatal and postnatal tissues should not be attributed to the varying heights of P0/1 and P21 image z-stacks, as this difference had to do with inherent differences in tissue chemistry rather than cryosection thickness.
The fact that PreBötC, PiCo and RTN/pFRG structures are primarily defined by physiologic properties rather than anatomic location represents a second technical challenge we faced. We therefore used a combination of anatomy and biomarker expression to select broad ROIs that would include the structures of interest. This sampling approach was validated by performing immunohistochemical stains of PreBötC for NK1R, PiCo for VGlut2, and RTN for Phox2B demonstrated that we could reliably identify sections containing the structure of interest based on the presence of these functional biomarkers. By co-labelling sections for both HA and ChAT, we utilized the morphology of the neighboring Nucleus Ambiguus while drawing ROIs in the area of the PreBötC and PiCo, and the nVII to draw the ventral RTN ROI. Based on these criteria, we measured the number of HA+ particles in sections that spanned an average of 283µm in the PiCo, 585µm in the RTN/pFRG, and 690µm in the PreBötC. As the newborn mouse PreBötC is estimated to extend 250–300µm along the rostrocaudal axis of the hindbrain, it is likely that some of the HA+ particles quantified in our study included synapses innervating regions surrounding the PreBötC, both caudally (VRG) and rostrally (Bötzinger Complex). Future studies should utilize newly discovered functional markers of PreBötC neurons to aid in the selection of sections containing PreBötC versus those containing VRG or Bötzinger Complex.
To develop our SQM methodology, we used a transgenic approach to fluorescently label Nkx2.2- and Olig3-derived neurons via expression of tdTomato-TEVP-myc-tag in axons/dendrites and GFP-HA-tag in presynaptic terminals. While we have shown that this method is useful in conjunction with an automated method for quantifying HA-tagged synapses, it is possible that only a subset of the counted synapses was derived from well-documented Nkx2.2- or Olig3-derived respiratory groups. Alternative methods for lineage tracing include the stereotactic injection of chemical tracers or viruses that allow precise labeling of neural circuits. However, this is unfeasible to implement in neurodevelopmental studies due to the technical challenges of targeting specific neurons via in utero injections. Intersectional transgenic mouse models could become useful in delineating neural circuits as the expression of two or more genes may be required to label the target population. Nevertheless, application of the SQM using intersectional genetic approaches would be a useful tool for targeting specific neural lineages involved in the development of respiratory circuits.
PreBötzinger Complex afferent inputs dynamically change during development.
Survival in the ex utero environment depends on the maturity of autonomic neural circuits that control such physiological functions as breathing, thermoregulation and heart rate, amongst others. From a neuroanatomical perspective, this maturation includes processes such as postnatal myelination and synaptic pruning (Semple, Blomgren, Gimlin, Ferriero, & Noble-Haeusslein, 2013). These processes are particularly pertinent to the development of the neural circuits that control ventilation. For instance, healthy neonates respire independently immediately after birth, which necessitates the appropriate development of respiratory neuronal circuitry throughout late embryonic and postnatal epochs. However, neonates exhibit paradoxical respiratory reflexes during this stage of immaturity. The hypoxic ventilator response underscores these postnatal developmental changes. In adults, acute moderate hypoxia induces a biphasic hypoxic ventilator response, which consists of an initial strong increase in respiratory drive (Phase I) followed by a secondary reduction in respiratory activity (Phase II) ultimately reaching a steady state minute ventilation of ~25–40% above the normoxic baseline (Teppema & Dahan, 2010). In contrast, across multiple mammalian species, including humans, acute hypoxia during neonatal life results in an initial increase in respiratory drive followed by a substantial attenuation of minute ventilation and, at times, complete apnea during Phase II (Moss, 2000). Furthermore, compelling evidence from multiple groups have demonstrated dynamic changes in brainstem respiratory nuclei during postnatal development. For instance, evaluation of dendritic spines by Golgi impregnation demonstrates a rapid decline in spine density in medullary respiratory neurons during postnatal development (Takashima & Becker, 1986). NTS respiratory neurons also show immature morphologies, including growth cones and primitive electrophysiological properties (Denavit-Saubié et al., 2004). Furthermore, rats show a dynamic shift from excitatory neurotransmitter expression to inhibitory neurotransmitter expression occurs at P12 (Wong-Riley & Liu, 2005). Thus, autonomic circuits change dynamically during the post-natal epoch. Some have even suggested that immature respiratory networks underlie the pathological mechanisms contributing to developmental breathing disorders such as Sudden Infant Death Syndrome and Apnea of Prematurity (Hunt & Brouillette, 1987). These data indicate that it would be imperative to map the dynamic developmental changes that occur in brainstem circuits throughout post-natal development. In summary, the physiology literature extensively supports the notion that autonomic circuits undergo dynamic postnatal change.
Nkx2.2 specifies the development of serotonergic neurons (Alenina et al., 2006). Furthermore, serotonergic neurons have been shown to play an essential role in the development and control of breathing (Hilaire et al., 2010). Our results suggest that the number of Nkx2.2-derived afferents to the PreBötC during the first three weeks of postnatal life decreases. These data are in line with recent findings that serotonergic medullary neurons switch their function from rhythm generation to chemoreception between P12 and P21 (Cerpa et al., 2017). Olig3 regulates the development of dorsal interneurons and precerebellar neurons in the hindbrain (Z. Liu et al., 2008; Zechner et al., 2007). Furthermore, dorsal respiratory column development requires Olig3 expression, which ultimately delivers input from peripheral chemoreceptors to the respiratory oscillators to modulate breathing (Storm et al., 2009). Olig3−/− nulls exhibit cyanosis and respiratory failure at birth, further demonstrating the role of Olig3 expression in the proper development of breathing (Z. Liu et al., 2008). Our data suggest that the number of Olig3-derived innervations to the PreBötC, PiCo and RTN/pFRG do not change significantly between P1 and P21.
Supplementary Material
Acknowledgments
We thank Dr. Jeremy Nathans for distribution of key reagents.
Support
This work was sponsored by NIH/NHLBI grants R01HL132355, R01HL132355S1, and R01HL132355S2.
Abbreviations:
- BötC
Bötzinger Complex
- ChAT
Choline Acetyltransferase
- DRC
Dorsal Respiratory Column
- GFP
Green Fluorescent Protein
- HA
Hemagglutinin
- NA
Nucleus Ambiguus
- nVII
Seventh Cranial Nerve Nucleus
- pFRG
Parafacial Respiratory Group
- PiCo
Post-Inspiratory Complex
- PreBötC
PreBötzinger Complex
- ROI
Region of Interest
- RTN
Retrotrapezoid Nucleus
- SQM
Synapse Quantification Macro
- TEVP
tdTomato-tobacco Etched Viral Protease
- VRG
Ventral Respiratory Group
Footnotes
Conflict of interest statement
The authors have no conflicts of interest to disclose.
REFERENCES
- Ackermann F, Waites CL, & Garner CC (2015). Presynaptic active zones in invertebrates and vertebrates. EMBO Reports, 16(8), 923–938. [DOI] [PMC free article] [PubMed] [Google Scholar]
- Akakin HC, Gokozan H, Otero J, & Gurcan MN (2015). An adaptive algorithm for detection of multiple-type, positively stained nuclei in IHC images with minimal prior information: application to OLIG2 staining gliomas In Gurcan MN & Madabhushi A (Eds.), (p. 942007). Presented at the SPIE Medical Imaging, SPIE. [Google Scholar]
- Alenina N, Bashammakh S, & Bader M (2006). Specification and differentiation of serotonergic neurons. Stem Cell Reviews, 2(1), 5–10. [DOI] [PubMed] [Google Scholar]
- Anderson TM, Garcia AJ, Baertsch NA, Pollak J, Bloom JC, Wei AD, et al. (2016). A novel excitatory network for the control of breathing. Nature, 536(7614), 76–80. [DOI] [PMC free article] [PubMed] [Google Scholar]
- Balderes DA, Magnuson MA, & Sussel L (2013). Nkx2.2:Cre knock-in mouse line: a novel tool for pancreas- and CNS-specific gene deletion. Genesis: the Journal of Genetics and Development, 51(12), 844–851. [DOI] [PMC free article] [PubMed] [Google Scholar]
- Bartholome O, Van den Ackerveken P, Sánchez Gil J, la Brassinne Bonardeaux, de O, Leprince P, Franzen R, & Rogister B (2017). Puzzling Out Synaptic Vesicle 2 Family Members Functions. Frontiers in Molecular Neuroscience, 10, 554 10.3389/fnmol.2017.00148 [DOI] [PMC free article] [PubMed] [Google Scholar]
- Briscoe J, Pierani A, Jessell TM, & Ericson J (2000). A homeodomain protein code specifies progenitor cell identity and neuronal fate in the ventral neural tube. Cell, 101(4), 435–445. [DOI] [PubMed] [Google Scholar]
- Burry RW (2011). Controls for Immunocytochemistry. Journal of Histochemistry & Cytochemistry, 59(1), 6–12. 10.1369/jhc.2010.956920 [DOI] [PMC free article] [PubMed] [Google Scholar]
- Cerpa VJ, Wu Y, Bravo E, Teran FA, Flynn RS, & Richerson GB (2017). Medullary 5-HT neurons: Switch from tonic respiratory drive to chemoreception during postnatal development. Neuroscience, 344, 1–14. 10.1016/j.neuroscience.2016.09.002 [DOI] [PMC free article] [PubMed] [Google Scholar]
- Chahoud I, & Paumgartten FJR (2009). Influence of litter size on the postnatal growth of rat pups: Is there a rationale for litter-size standardization in toxicity studies? Environmental Research, 109(8), 1021–1027. 10.1016/j.envres.2009.07.015 [DOI] [PubMed] [Google Scholar]
- Crèvecœur J, Foerch P, Doupagne M, Thielen C, Vandenplas C, Moonen G, et al. (2013). Expression of SV2 isoforms during rodent brain development. BMC Neuroscience, 14(1), 87 10.1186/1471-2202-14-87 [DOI] [PMC free article] [PubMed] [Google Scholar]
- Denavit-Saubié M, Kalia M, Pierrefiche O, Schweitzer P, Foutz AS, & Champagnat J (2004). Maturation of Brain Stem Neurons Involved in Respiratory Rhythmogenesis: Biochemical, Bioelectrical and Morphological Properties. Neonatology, 65(3–4), 171–175. 10.1159/000244048 [DOI] [PubMed] [Google Scholar]
- Dubreuil V, Thoby-Brisson M, Rallu M, Persson K, Pattyn A, Birchmeier C, et al. (2009). Defective respiratory rhythmogenesis and loss of central chemosensitivity in Phox2b mutants targeting retrotrapezoid nucleus neurons. The Journal of Neuroscience : the Official Journal of the Society for Neuroscience, 29(47), 14836–14846. 10.1523/JNEUROSCI.2623-09.2009 [DOI] [PMC free article] [PubMed] [Google Scholar]
- Enjin A, Rabe N, Nakanishi ST, Vallstedt A, Gezelius H, Memic F, et al. (2010). Identification of novel spinal cholinergic genetic subtypes disclose Chodl and Pitx2 as markers for fast motor neurons and partition cells. The Journal of Comparative Neurology, 518(12), 2284–2304. [DOI] [PubMed] [Google Scholar]
- Fauzi MFA, Gokozan HN, Elder B, Puduvalli VK, Pierson CR, Otero JJ, & Gurcan MN (2015). A multi-resolution textural approach to diagnostic neuropathology reporting. Journal of Neuro-Oncology, 124(3), 393–402. [DOI] [PMC free article] [PubMed] [Google Scholar]
- Feldman JL, & Del Negro CA (2006). Looking for inspiration: new perspectives on respiratory rhythm. Nature Reviews. Neuroscience, 7(3), 232–242. [DOI] [PMC free article] [PubMed] [Google Scholar]
- Filézac de L’Etang A, Maharjan N, Cordeiro Braña M, Ruegsegger C, Rehmann R, Goswami A, et al. (2015). Marinesco-Sjögren syndrome protein SIL1 regulates motor neuron subtype-selective ER stress in ALS. Nature Publishing Group, 18(2), 227–238. 10.1038/nn.3903 [DOI] [PubMed] [Google Scholar]
- Freude S, Leeser U, Müller M, Hettich MM, Udelhoven M, Schilbach K, et al. (2008). IRS-2 branch of IGF-1 receptor signaling is essential for appropriate timing of myelination. Journal of Neurochemistry, 107(4), 907–917. [DOI] [PubMed] [Google Scholar]
- Goceri E, Goksel B, Elder JB, Puduvalli VK, Otero JJ, & Gurcan MN (2017). Quantitative validation of anti-PTBP1 antibody for diagnostic neuropathology use: Image analysis approach. International Journal for Numerical Methods in Biomedical Engineering, 33(11), e2862 10.1002/cnm.2862 [DOI] [PMC free article] [PubMed] [Google Scholar]
- Gokozan HN, Baig F, Corcoran S, Catacutan FP, Gygli PE, Takakura AC, et al. (2016). Area postrema undergoes dynamic postnatal changes in mice and humans. The Journal of Comparative Neurology, 524(6), 1259–1269. 10.1002/cne.23903 [DOI] [PMC free article] [PubMed] [Google Scholar]
- Graham B, & Redman S (1994). A simulation of action potentials in synaptic boutons during presynaptic inhibition. Journal of Neurophysiology, 71(2), 538–549. [DOI] [PubMed] [Google Scholar]
- Gray PA, Hayes JA, Ling GY, Llona I, Tupal S, Picardo MCD, et al. (2010). Developmental Origin of PreBotzinger Complex Respiratory Neurons. The Journal of Neuroscience, 30(44), 14883–14895. [DOI] [PMC free article] [PubMed] [Google Scholar]
- Guyenet PG, & Mulkey DK (2010). Retrotrapezoid nucleus and parafacial respiratory group. Respiratory Physiology & Neurobiology, 173(3), 244–255. [DOI] [PMC free article] [PubMed] [Google Scholar]
- Hilaire G, Voituron N, Menuet C, Ichiyama RM, Subramanian HH, & Dutschmann M (2010). The role of serotonin in respiratory function and dysfunction. Respiratory Physiology & Neurobiology, 174(1–2), 76–88. [DOI] [PMC free article] [PubMed] [Google Scholar]
- Hunt CE, & Brouillette RT (1987). Sudden infant death syndrome: 1987 perspective. The Journal of Pediatrics, 110(5), 669–678. [DOI] [PubMed] [Google Scholar]
- Jarvie BC, & Hentges ST (2012). Expression of GABAergic and glutamatergic phenotypic markers in hypothalamic proopiomelanocortin neurons. The Journal of Comparative Neurology, 520(17), 3863–3876. [DOI] [PMC free article] [PubMed] [Google Scholar]
- Jin Y, & Garner CC (2008). Molecular Mechanisms of Presynaptic Differentiation. Annual Review of Cell and Developmental Biology, 24(1), 237–262. [DOI] [PubMed] [Google Scholar]
- Kapur JN, Sahoo PK, & Wong AKC (1985). A new method for gray-level picture thresholding using the entropy of the histogram. Computer Vision, Graphics, and Image Processing, 29(3), 273–285. [Google Scholar]
- Kaya B, Goceri E, Becker A, Elder B, Puduvalli V, Winter J, et al. (2017). Automated fluorescent miscroscopic image analysis of PTBP1 expression in glioma. Plos One, 12(3), e0170991. [DOI] [PMC free article] [PubMed] [Google Scholar]
- Ke X-X, Zhang D, Zhao H, Hu R, Dong Z, Yang R, et al. (2015). Phox2B correlates with MYCN and is a prognostic marker for neuroblastoma development. Oncology Letters, 9(6), 2507–2514. [DOI] [PMC free article] [PubMed] [Google Scholar]
- Kubínová L, & Janáček J (2015). Confocal stereology: an efficient tool for measurement of microscopic structures. Cell and Tissue Research, 360(1), 13–28. [DOI] [PubMed] [Google Scholar]
- Lin LI (1989). A concordance correlation coefficient to evaluate reproducibility. Biometrics, 45(1), 255–268. [PubMed] [Google Scholar]
- Liu Z, Li H, Hu X, Yu L, Liu H, Han R, et al. (2008). Control of precerebellar neuron development by Olig3 bHLH transcription factor. The Journal of Neuroscience, 28(40), 10124–10133. [DOI] [PMC free article] [PubMed] [Google Scholar]
- McBride GB (2005). Using Statistical Methods for Water Quality Management Hoboken, NJ, USA: John Wiley & Sons, Inc; 10.1002/0471733199 [DOI] [Google Scholar]
- Mokin M, & Keifer J (2006). Quantitative analysis of immunofluorescent punctate staining of synaptically localized proteins using confocal microscopy and stereology. Journal of Neuroscience Methods, 157(2), 218–224. [DOI] [PubMed] [Google Scholar]
- Moss IR (2000). Respiratory responses to single and episodic hypoxia during development: mechanisms of adaptation. Respiration Physiology, 121(2–3), 185–197. [DOI] [PubMed] [Google Scholar]
- Mulkey DK, Rosin DL, West G, Takakura AC, Moreira TS, Bayliss DA, & Guyenet PG (2007). Serotonergic neurons activate chemosensitive retrotrapezoid nucleus neurons by a pH-independent mechanism. The Journal of Neuroscience, 27(51), 14128–14138. [DOI] [PMC free article] [PubMed] [Google Scholar]
- Nijhof B, Castells-Nobau A, Wolf L, Scheffer-de Gooyert JM, Monedero I, Torroja L, et al. (2016). A New Fiji-Based Algorithm That Systematically Quantifies Nine Synaptic Parameters Provides Insights into Drosophila NMJ Morphometry. PLoS Computational Biology, 12(3), e1004823. [DOI] [PMC free article] [PubMed] [Google Scholar]
- Patrizio A, & Specht CG (2016). Counting numbers of synaptic proteins: absolute quantification and single molecule imaging techniques. Neurophotonics, 3(4), 041805. [DOI] [PMC free article] [PubMed] [Google Scholar]
- Paxinos G, & Franklin KBJ (2012). Paxinos and Franklin’s the Mouse Brain in Stereotaxic Coordinates (4 ed.). Academic Press. [Google Scholar]
- Paxinos G, Watson C, Koutcherov Y, Wang H, & Halliday GM (2006). Atlas of the Developing Mouse Brain (1st ed.). Academic Press. [Google Scholar]
- Pellett S, Schwartz MP, Tepp WH, Josephson R, Scherf JM, Pier CL, et al. (2015). Human Induced Pluripotent Stem Cell Derived Neuronal Cells Cultured on Chemically-Defined Hydrogels for Sensitive In Vitro Detection of Botulinum Neurotoxin. Scientific Reports, 5(1), 14566. [DOI] [PMC free article] [PubMed] [Google Scholar]
- Piggins HD, Samuels RE, Coogan AN, & Cutler DJ (2001). Distribution of substance P and neurokinin-1 receptor immunoreactivity in the suprachiasmatic nuclei and intergeniculate leaflet of hamster, mouse, and rat. The Journal of Comparative Neurology, 438(1), 50–65. [DOI] [PubMed] [Google Scholar]
- Ruangkittisakul A, Schwarzacher SW, Secchia L, Poon BY, Ma Y, Funk GD, & Ballanyi K (2006). High sensitivity to neuromodulator-activated signaling pathways at physiological [K+] of confocally imaged respiratory center neurons in on-line-calibrated newborn rat brainstem slices. The Journal of Neuroscience, 26(46), 11870–11880. [DOI] [PMC free article] [PubMed] [Google Scholar]
- Ryu K-Y, Park H, Rossi DJ, Weissman IL, & Kopito RR (2012). Perturbation of the Hematopoietic System during Embryonic Liver Development Due to Disruption of Polyubiquitin Gene Ubc in Mice. Plos One, 7(2), e32956 10.1371/journal.pone.0032956 [DOI] [PMC free article] [PubMed] [Google Scholar]
- Semple BD, Blomgren K, Gimlin K, Ferriero DM, & Noble-Haeusslein LJ (2013). Brain development in rodents and humans: Identifying benchmarks of maturation and vulnerability to injury across species. Progress in Neurobiology, 106–107, 1–16. [DOI] [PMC free article] [PubMed] [Google Scholar]
- Shimamura K, Hartigan DJ, Martinez S, Puelles L, & Rubenstein JL (1995). Longitudinal organization of the anterior neural plate and neural tube. Development (Cambridge, England), 121(12), 3923–3933. [DOI] [PubMed] [Google Scholar]
- Simhal AK, Aguerrebere C, Collman F, Vogelstein JT, Micheva KD, Weinberg RJ, et al. (2017). Probabilistic fluorescence-based synapse detection. PLoS Computational Biology, 13(4), e1005493. [DOI] [PMC free article] [PubMed] [Google Scholar]
- Smith JC, Abdala APL, Borgmann A, Rybak IA, & Paton JFR (2013). Brainstem respiratory networks: building blocks and microcircuits. Trends in Neurosciences, 36(3), 152–162. [DOI] [PMC free article] [PubMed] [Google Scholar]
- Storm R, Cholewa-Waclaw J, Reuter K, Bröhl D, Sieber M, Treier M, et al. (2009). The bHLH transcription factor Olig3 marks the dorsal neuroepithelium of the hindbrain and is essential for the development of brainstem nuclei. Development (Cambridge, England), 136(2), 295–305. 10.1242/dev.027193 [DOI] [PubMed] [Google Scholar]
- Takashima S, & Becker LE (1986). Prenatal and postnatal maturation of medullary “respiratory centers.” Developmental Brain Research, 26(2), 173–177. 10.1016/0165-3806(86)90280-4 [DOI] [PubMed] [Google Scholar]
- Teppema LJ, & Dahan A (2010). The ventilatory response to hypoxia in mammals: mechanisms, measurement, and analysis. Physiological Reviews, 90(2), 675–754. [DOI] [PubMed] [Google Scholar]
- Thoby-Brisson M, Karlén M, Wu N, Charnay P, Champagnat J, & Fortin G (2009). Genetic identification of an embryonic parafacial oscillator coupling to the preBötzinger complex. Nature Reviews Neurology, 12(8), 1028–1035. [DOI] [PubMed] [Google Scholar]
- Thoby-Brisson M, Trinh J-B, Champagnat J, & Fortin G (2005). Emergence of the pre-Bötzinger respiratory rhythm generator in the mouse embryo. The Journal of Neuroscience, 25(17), 4307–4318. [DOI] [PMC free article] [PubMed] [Google Scholar]
- Vue TY, Bluske K, Alishahi A, Yang LL, Koyano-Nakagawa N, Novitch B, & Nakagawa Y (2009). Sonic hedgehog signaling controls thalamic progenitor identity and nuclei specification in mice. The Journal of Neuroscience, 29(14), 4484–4497. [DOI] [PMC free article] [PubMed] [Google Scholar]
- Vue TY, Lee M, Tan YE, Werkhoven Z, Wang L, & Nakagawa Y (2013). Thalamic control of neocortical area formation in mice. The Journal of Neuroscience, 33(19), 8442–8453. [DOI] [PMC free article] [PubMed] [Google Scholar]
- Wang Hui, Lei Q, Oosterveen T, Ericson J, & Matise MP (2011). Tcf/Lef repressors differentially regulate Shh-Gli target gene activation thresholds to generate progenitor patterning in the developing CNS. Development (Cambridge, England), 138(17), 3711–3721. [DOI] [PMC free article] [PubMed] [Google Scholar]
- Watson PF, & Petrie A (2010). Method agreement analysis: a review of correct methodology. Theriogenology, 73(9), 1167–1179. [DOI] [PubMed] [Google Scholar]
- Waugh DS (2011). An overview of enzymatic reagents for the removal of affinity tags. Protein Expression and Purification, 80(2), 283–293. 10.1016/j.pep.2011.08.005 [DOI] [PMC free article] [PubMed] [Google Scholar]
- Whittaker VP, & Gray EG (1962). The synapse: biology and morphology. British Medical Bulletin, 18, 223–228. [DOI] [PubMed] [Google Scholar]
- Wong-Riley MTT, & Liu Q (2005). Neurochemical development of brain stem nuclei involved in the control of respiration. Respiratory Physiology & Neurobiology, 149(1–3), 83–98. 10.1016/j.resp.2005.01.011 [DOI] [PubMed] [Google Scholar]
- Zechner D, Müller T, Wende H, Walther I, Taketo MM, Crenshaw EB, et al. (2007). Bmp and Wnt/beta-catenin signals control expression of the transcription factor Olig3 and the specification of spinal cord neurons. Developmental Biology, 303(1), 181–190. [DOI] [PubMed] [Google Scholar]
Associated Data
This section collects any data citations, data availability statements, or supplementary materials included in this article.